| Tissue | Expression Dynamics | Abbreviation |
| Breast |  | IDC: Invasive ductal carcinoma |
| DCIS: Ductal carcinoma in situ |
| Precancer(BRCA1-mut): Precancerous lesion from BRCA1 mutation carriers |
| Cervix | 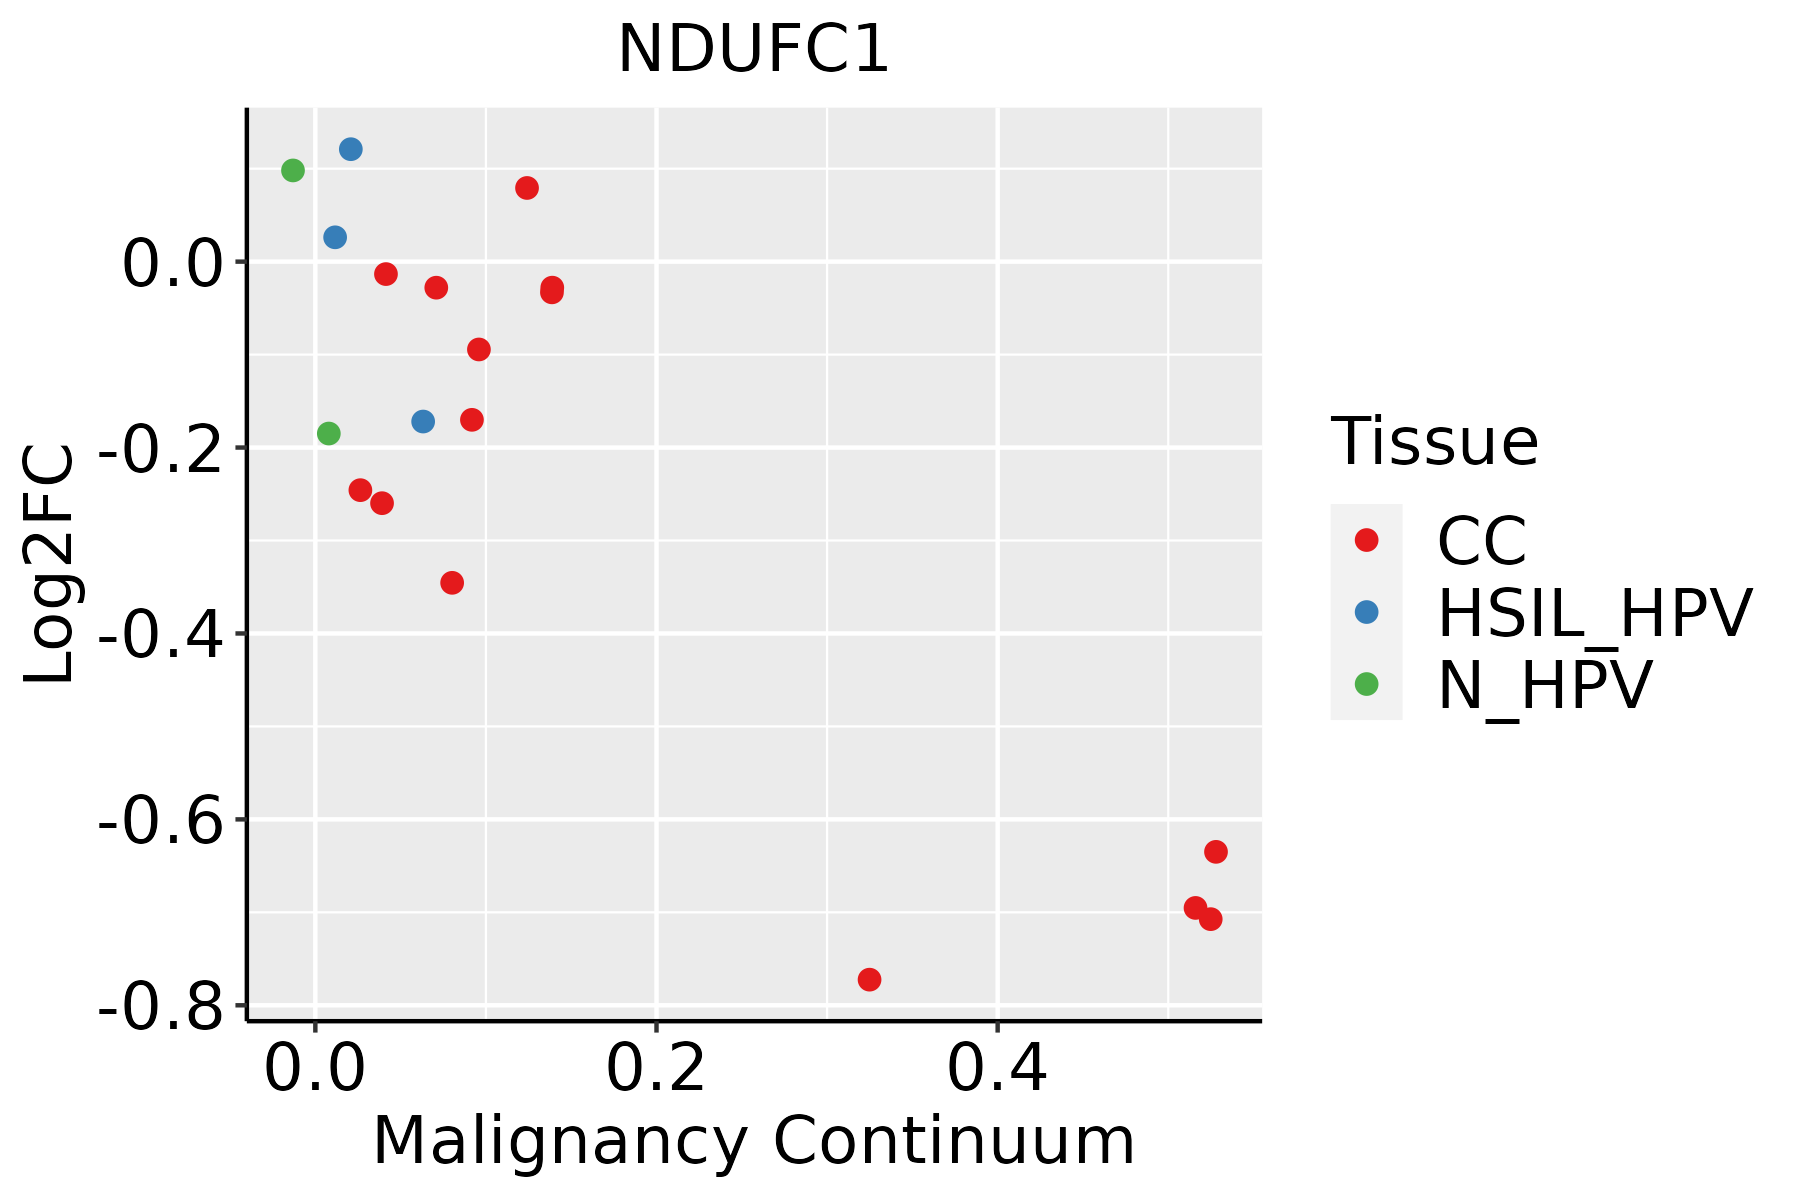 | CC: Cervix cancer |
| HSIL_HPV: HPV-infected high-grade squamous intraepithelial lesions |
| N_HPV: HPV-infected normal cervix |
| Colorectum (GSE201348) | 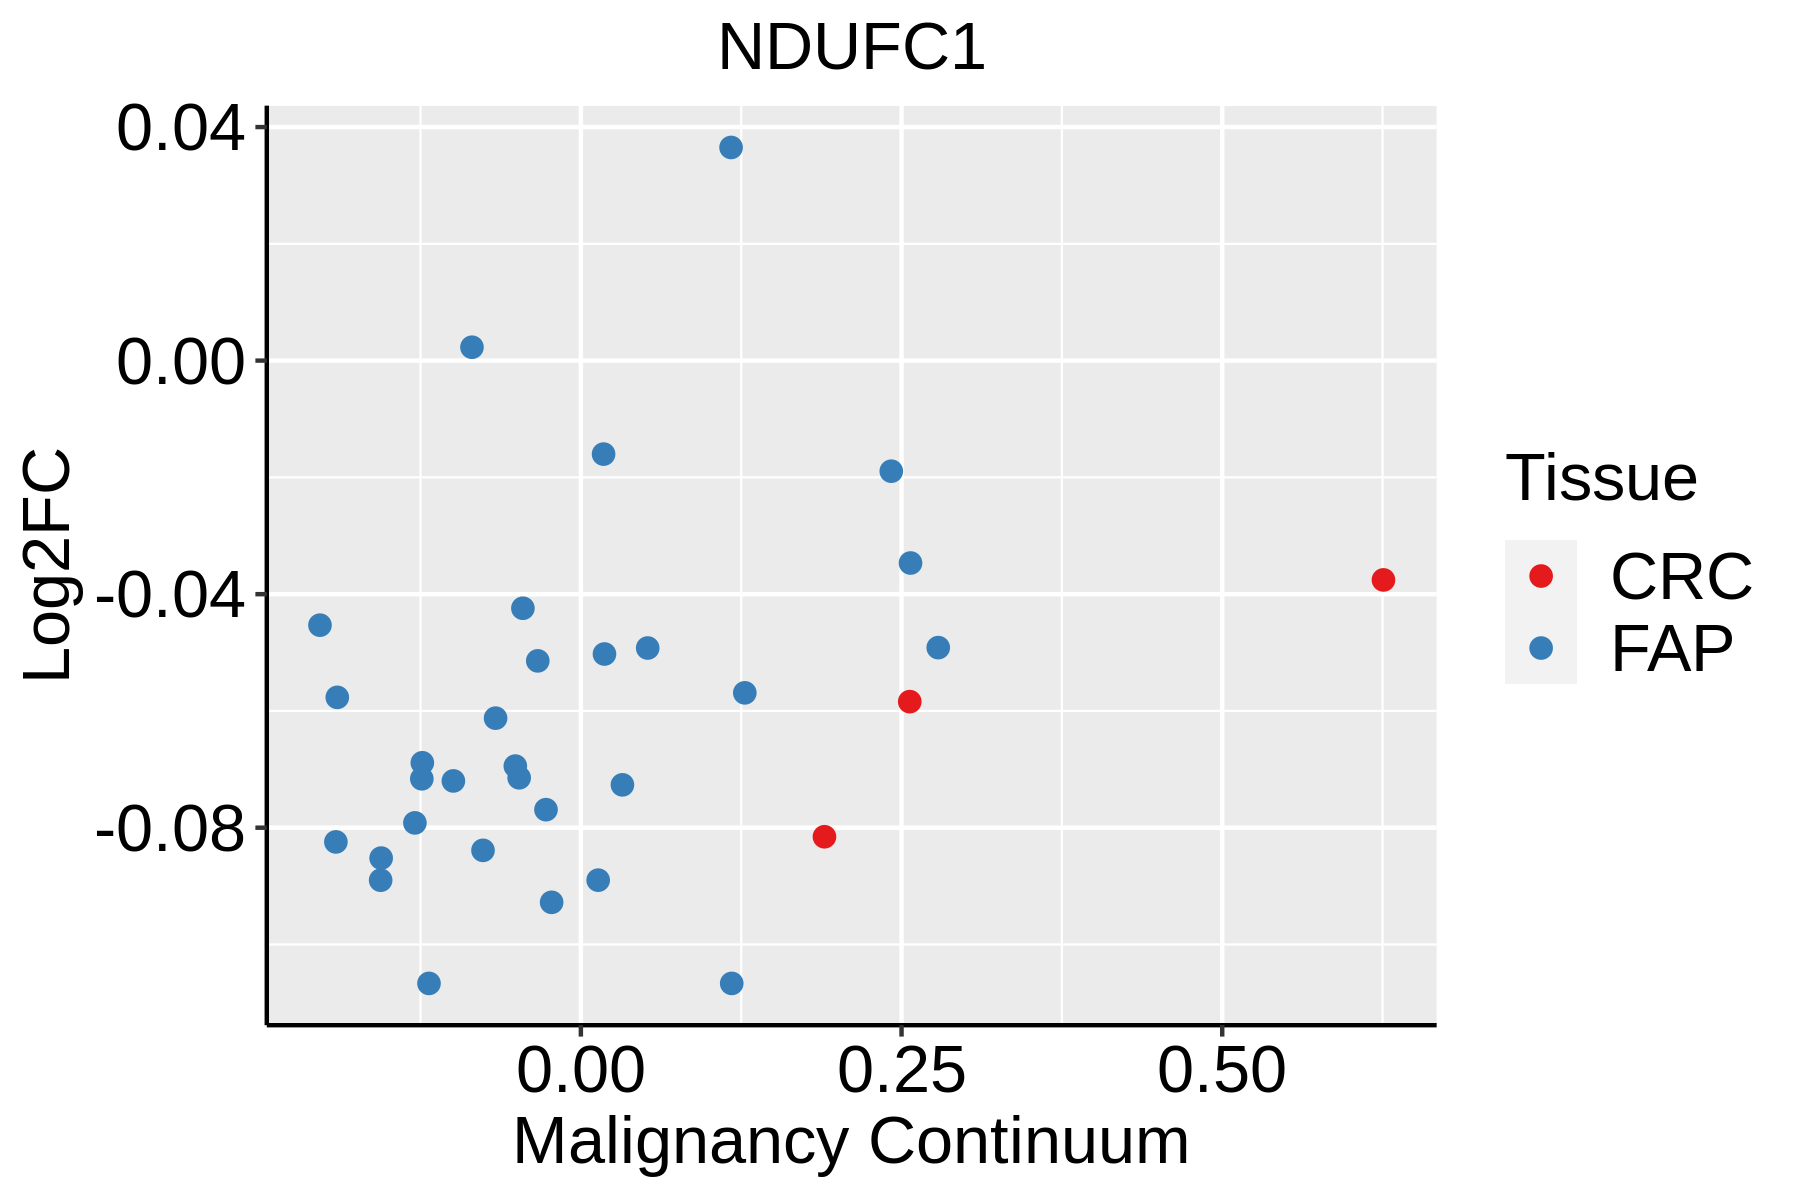 | FAP: Familial adenomatous polyposis |
| CRC: Colorectal cancer |
| Colorectum (HTA11) | 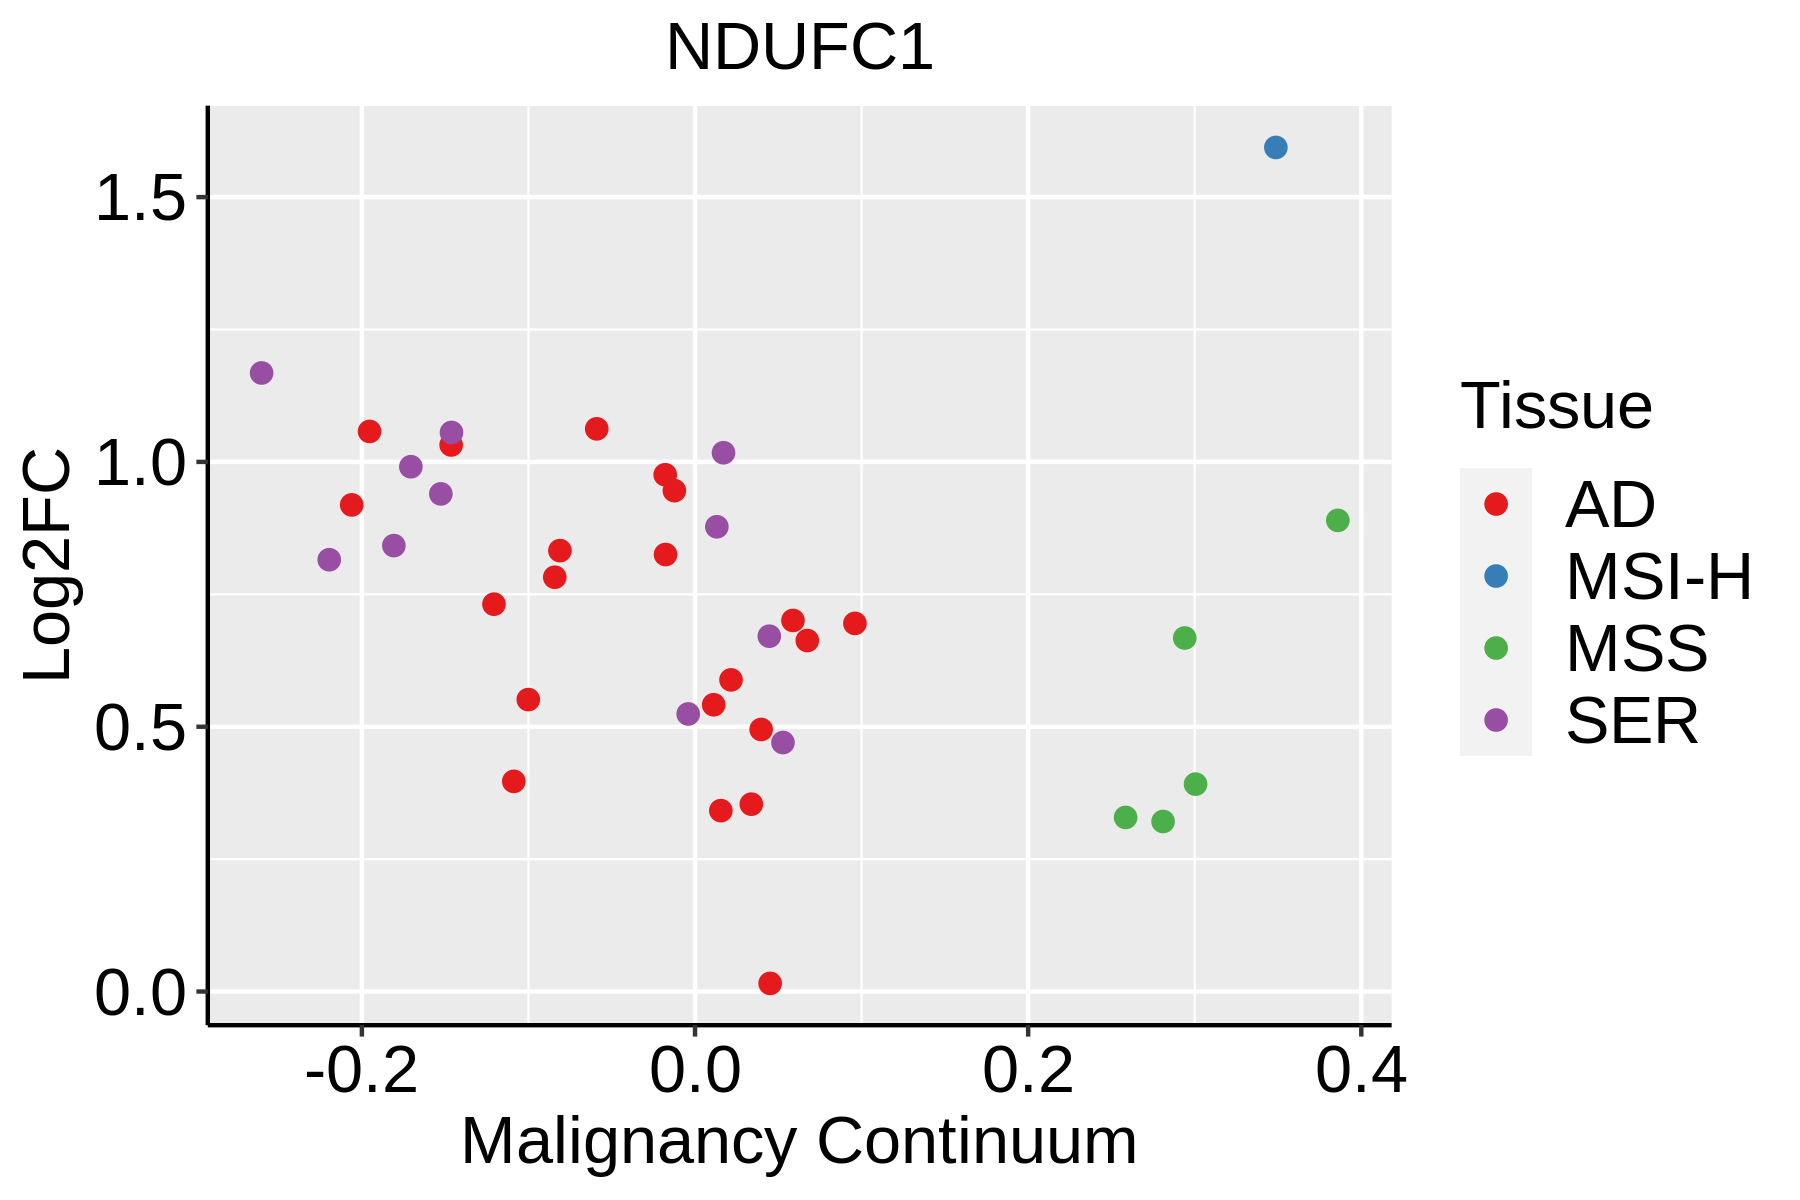 | AD: Adenomas |
| SER: Sessile serrated lesions |
| MSI-H: Microsatellite-high colorectal cancer |
| MSS: Microsatellite stable colorectal cancer |
| Endometrium | 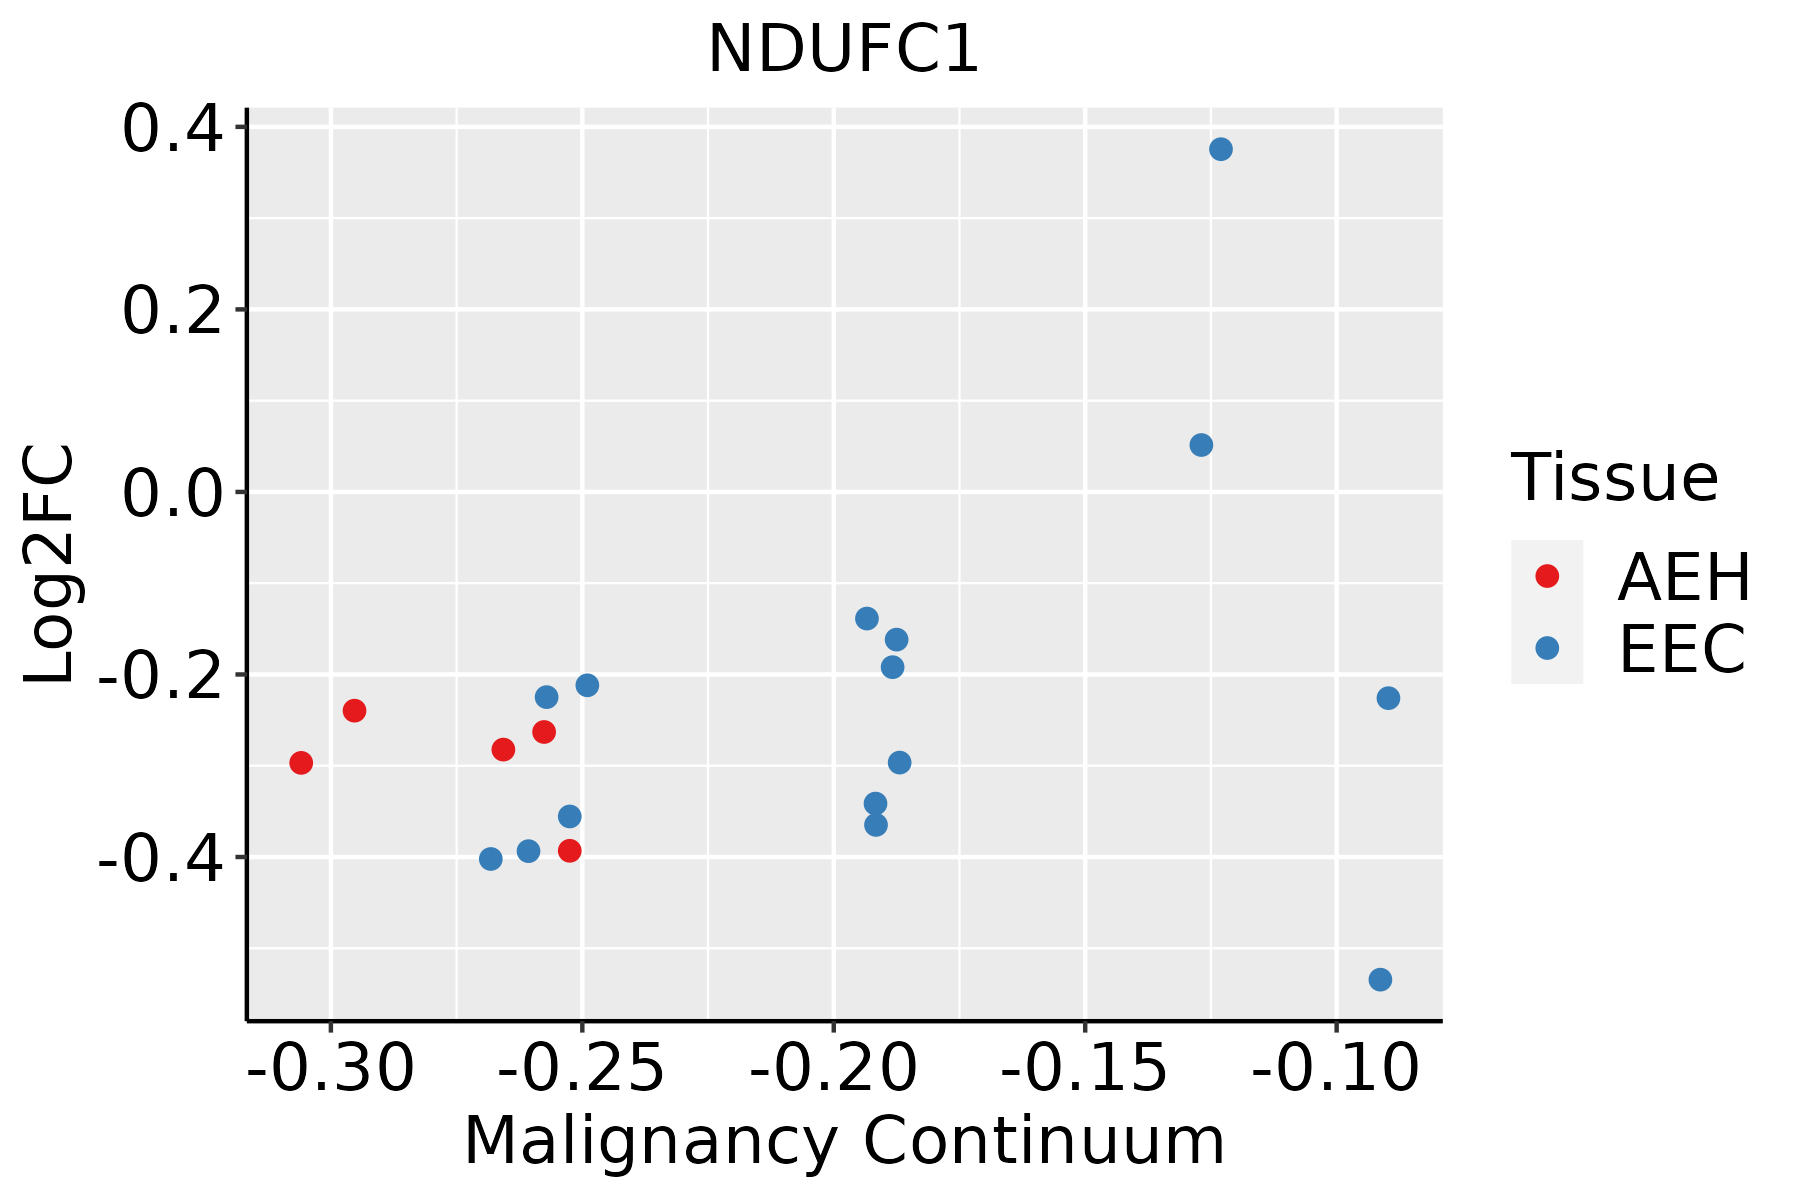 | AEH: Atypical endometrial hyperplasia |
| EEC: Endometrioid Cancer |
| Esophagus |  | ESCC: Esophageal squamous cell carcinoma |
| HGIN: High-grade intraepithelial neoplasias |
| LGIN: Low-grade intraepithelial neoplasias |
| Liver | 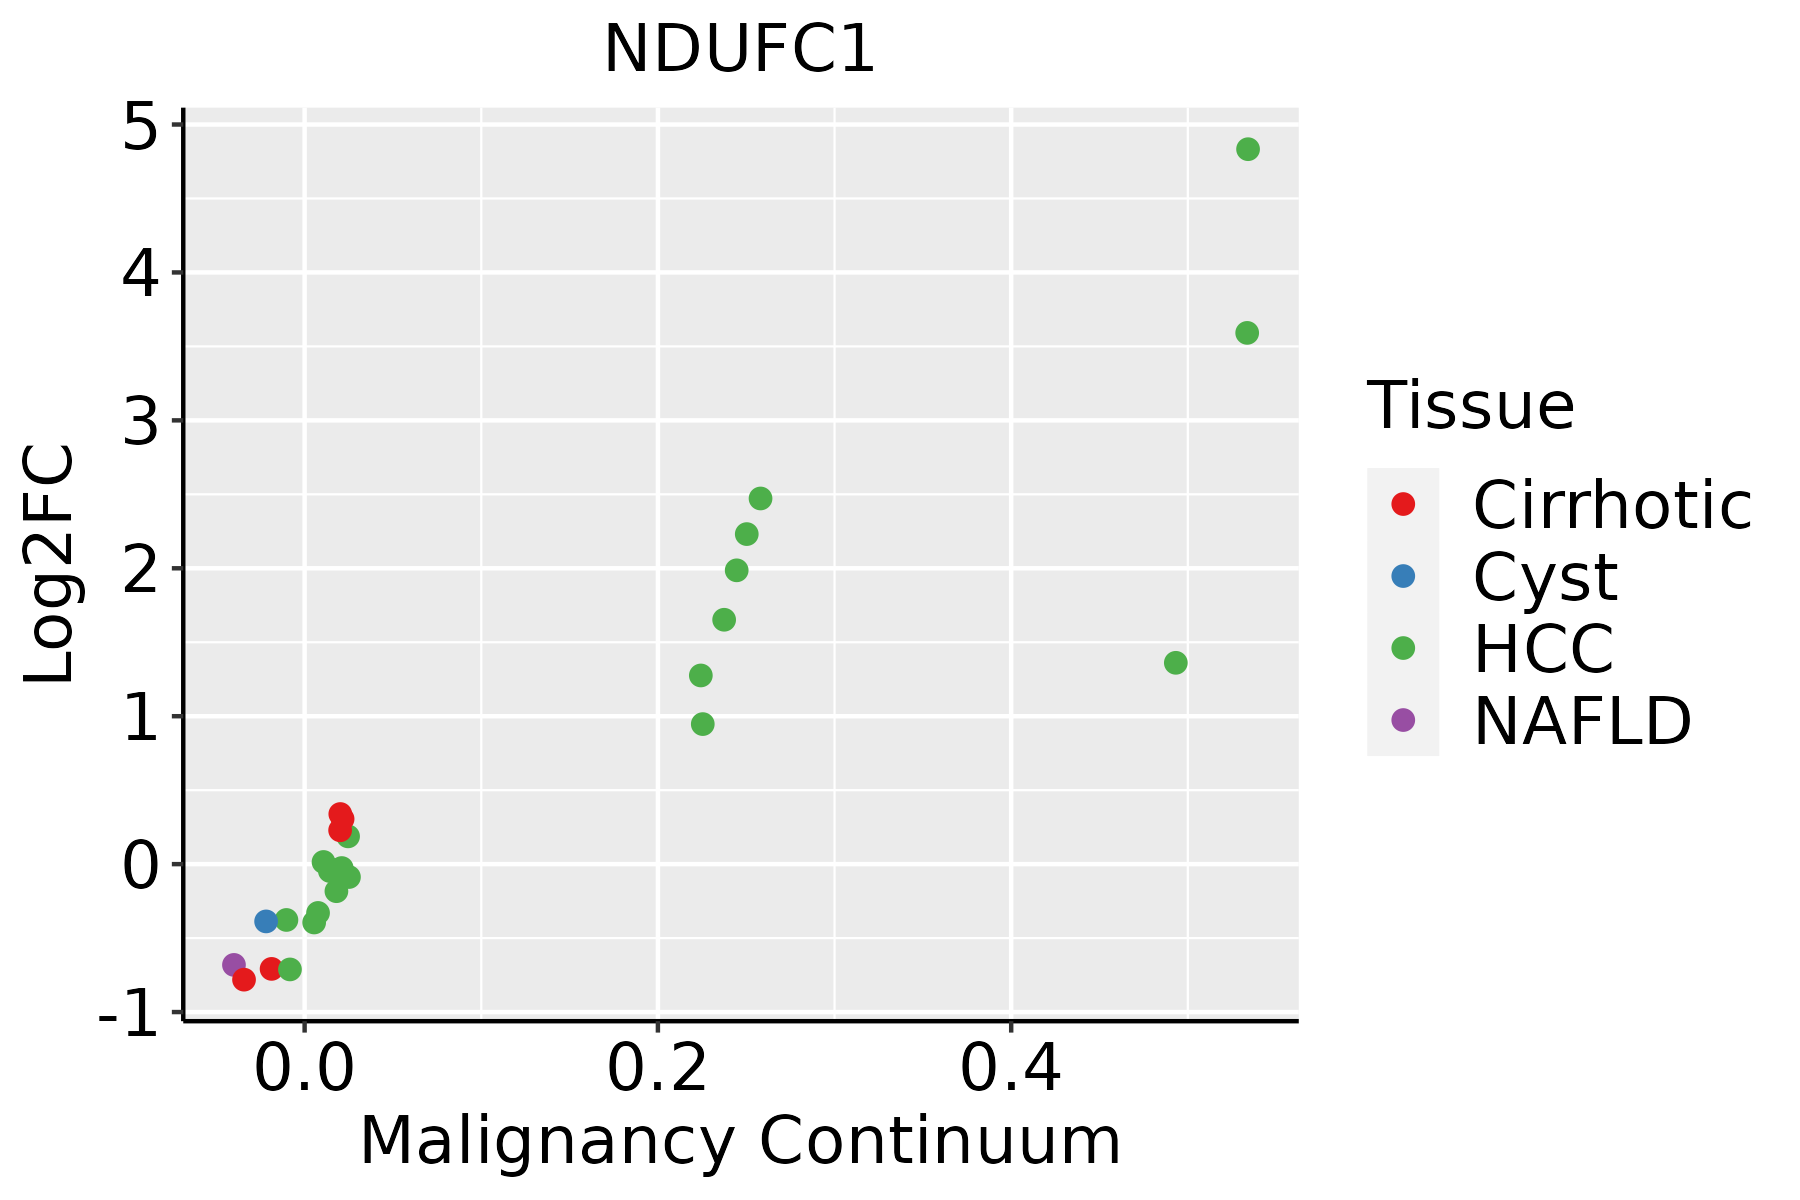 | HCC: Hepatocellular carcinoma |
| NAFLD: Non-alcoholic fatty liver disease |
| Oral Cavity | 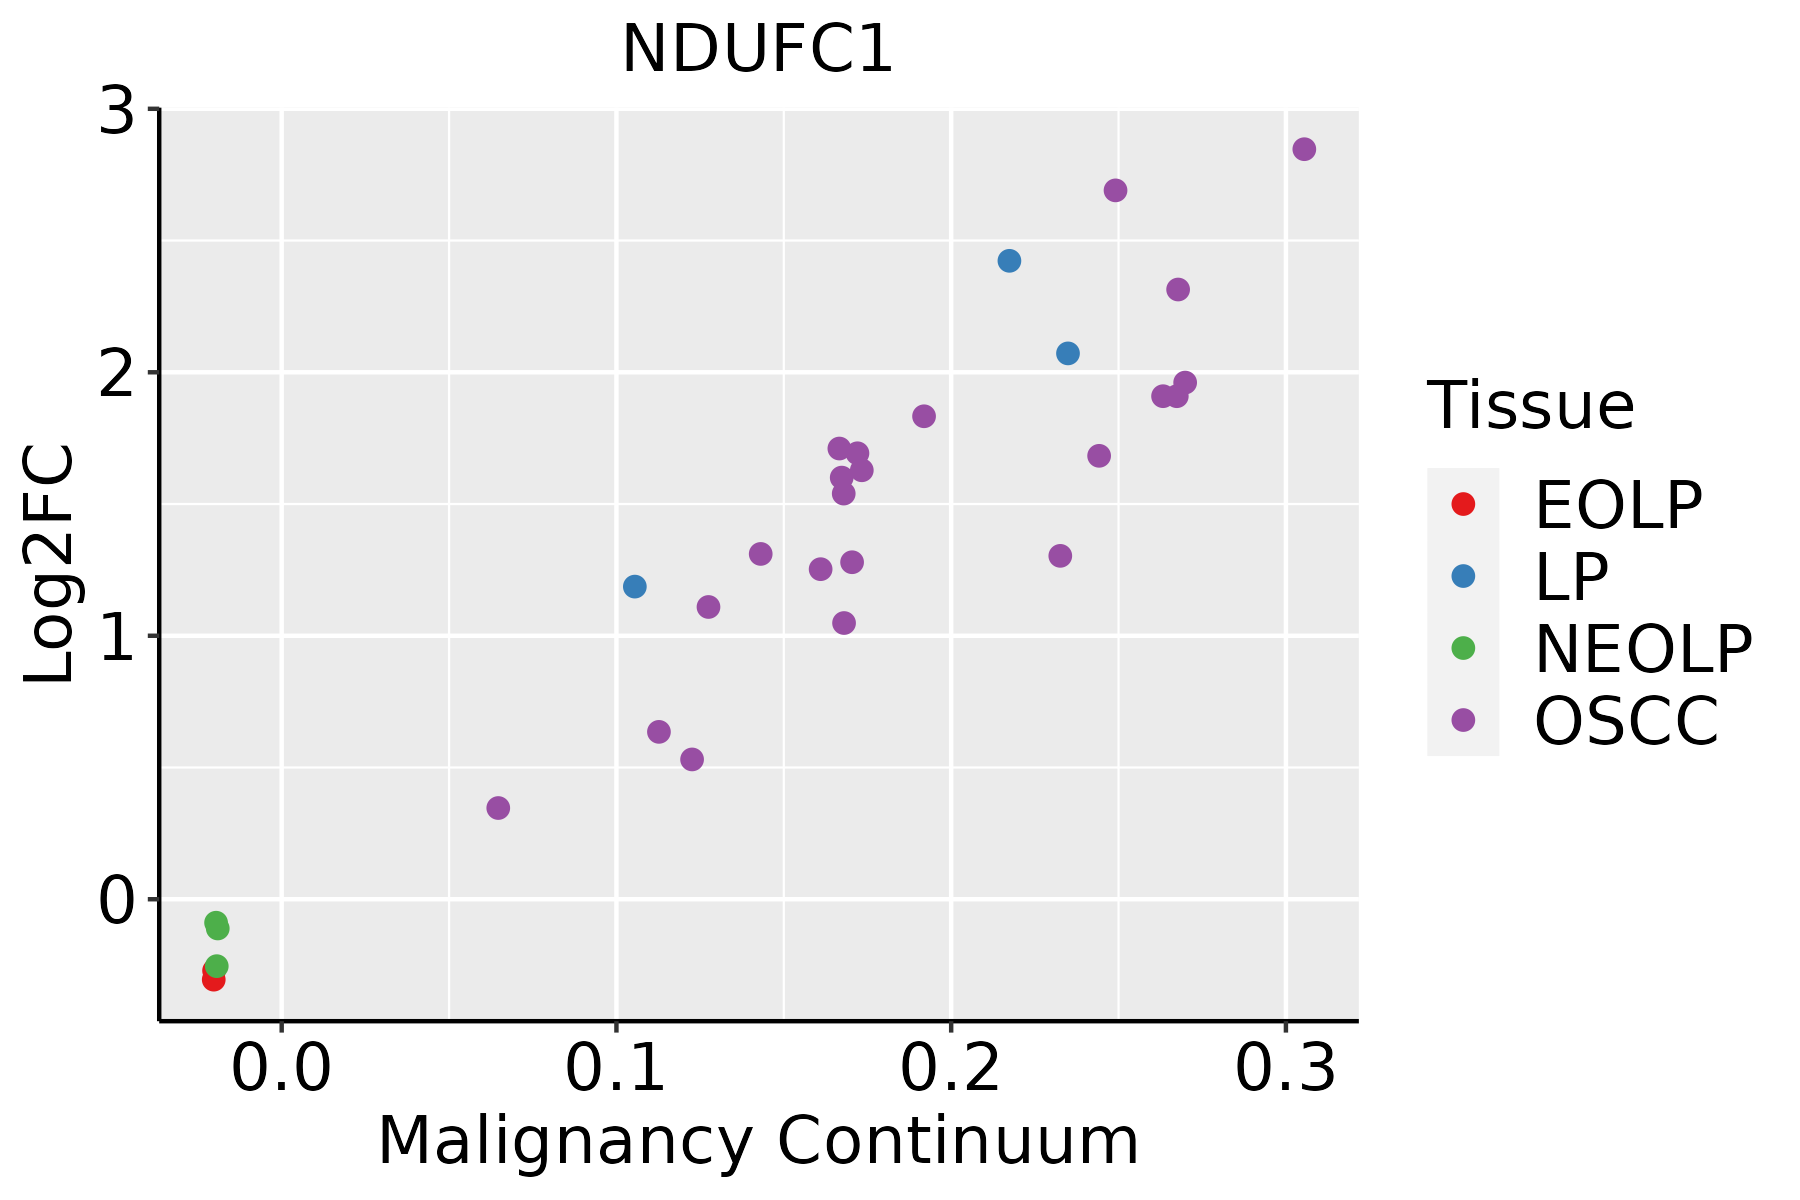 | EOLP: Erosive Oral lichen planus |
| LP: leukoplakia |
| NEOLP: Non-erosive oral lichen planus |
| OSCC: Oral squamous cell carcinoma |
| Prostate | 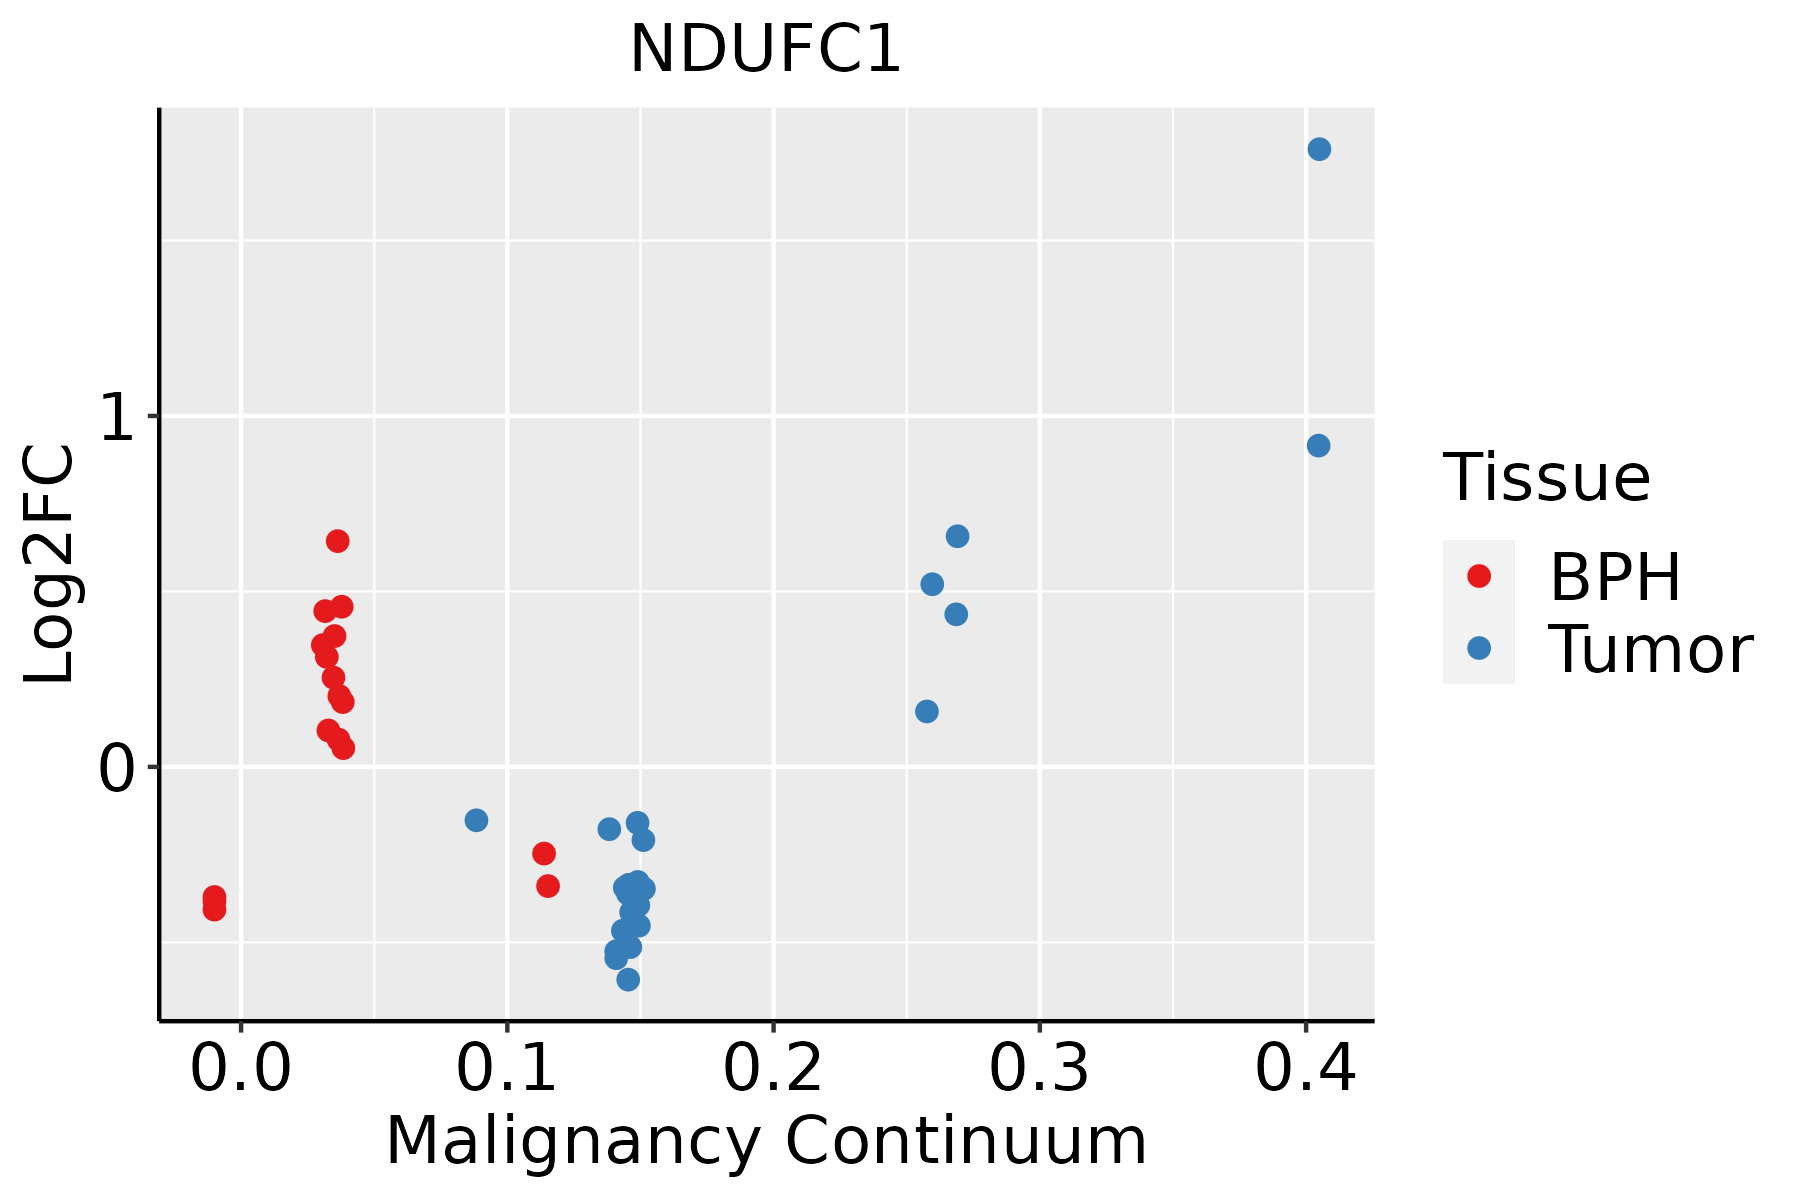 | BPH: Benign Prostatic Hyperplasia |
| Skin | 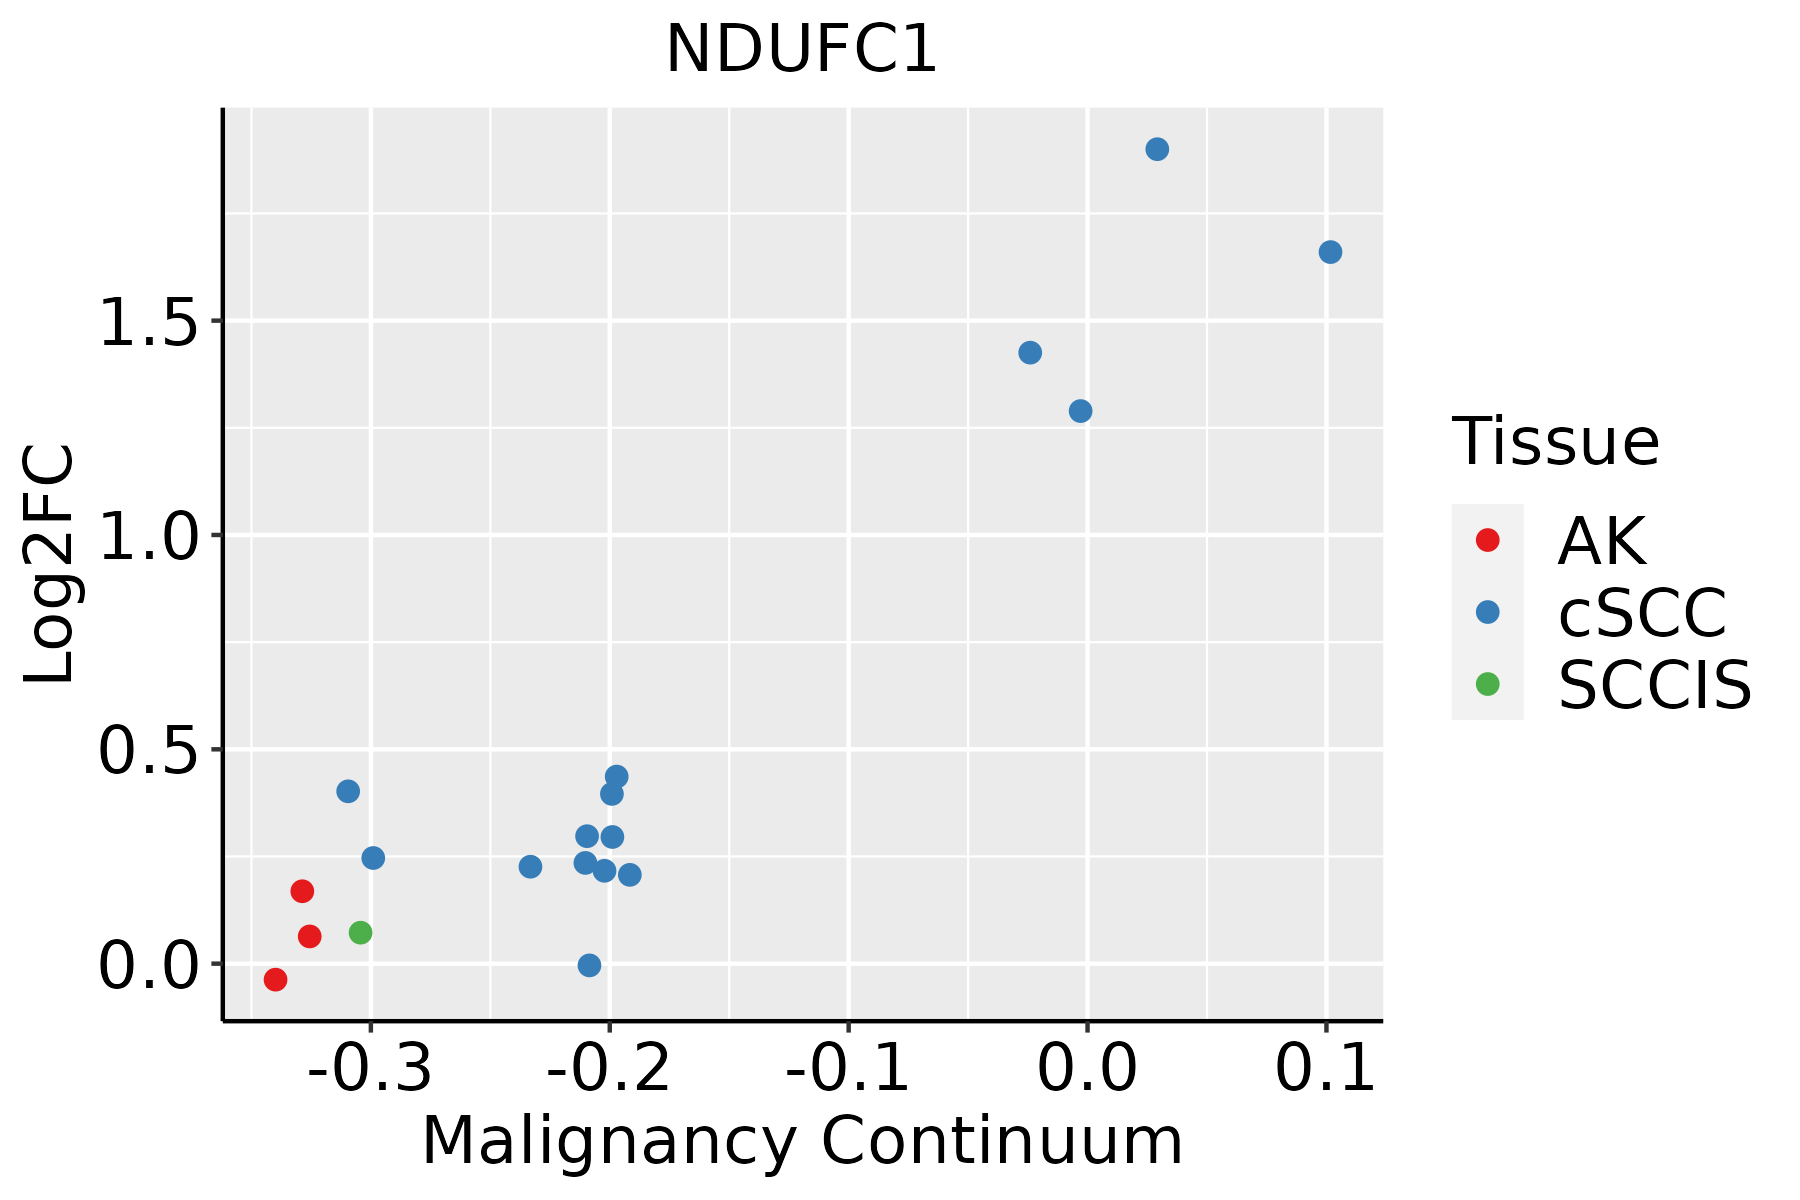 | AK: Actinic keratosis |
| cSCC: Cutaneous squamous cell carcinoma |
| SCCIS:squamous cell carcinoma in situ |
| Thyroid |  | ATC: Anaplastic thyroid cancer |
| HT: Hashimoto's thyroiditis |
| PTC: Papillary thyroid cancer |
| GO ID | Tissue | Disease Stage | Description | Gene Ratio | Bg Ratio | pvalue | p.adjust | Count |
| GO:00196462 | Colorectum | MSS | aerobic electron transport chain | 51/3467 | 87/18723 | 9.74e-17 | 3.57e-14 | 51 |
| GO:00061202 | Colorectum | MSS | mitochondrial electron transport, NADH to ubiquinone | 31/3467 | 51/18723 | 2.73e-11 | 3.67e-09 | 31 |
| GO:00102572 | Colorectum | MSS | NADH dehydrogenase complex assembly | 33/3467 | 57/18723 | 4.07e-11 | 4.86e-09 | 33 |
| GO:00329812 | Colorectum | MSS | mitochondrial respiratory chain complex I assembly | 33/3467 | 57/18723 | 4.07e-11 | 4.86e-09 | 33 |
| GO:00331082 | Colorectum | MSS | mitochondrial respiratory chain complex assembly | 44/3467 | 93/18723 | 2.17e-10 | 2.09e-08 | 44 |
| GO:00460343 | Colorectum | MSI-H | ATP metabolic process | 71/1319 | 277/18723 | 3.18e-22 | 8.32e-19 | 71 |
| GO:00427733 | Colorectum | MSI-H | ATP synthesis coupled electron transport | 40/1319 | 95/18723 | 1.05e-21 | 8.32e-19 | 40 |
| GO:00427753 | Colorectum | MSI-H | mitochondrial ATP synthesis coupled electron transport | 40/1319 | 95/18723 | 1.05e-21 | 8.32e-19 | 40 |
| GO:00090603 | Colorectum | MSI-H | aerobic respiration | 56/1319 | 189/18723 | 5.06e-21 | 3.51e-18 | 56 |
| GO:00196463 | Colorectum | MSI-H | aerobic electron transport chain | 37/1319 | 87/18723 | 2.32e-20 | 1.43e-17 | 37 |
| GO:00061193 | Colorectum | MSI-H | oxidative phosphorylation | 47/1319 | 141/18723 | 3.34e-20 | 1.86e-17 | 47 |
| GO:00229043 | Colorectum | MSI-H | respiratory electron transport chain | 42/1319 | 114/18723 | 4.50e-20 | 2.27e-17 | 42 |
| GO:00229003 | Colorectum | MSI-H | electron transport chain | 52/1319 | 175/18723 | 1.13e-19 | 5.21e-17 | 52 |
| GO:00060913 | Colorectum | MSI-H | generation of precursor metabolites and energy | 93/1319 | 490/18723 | 7.35e-19 | 3.14e-16 | 93 |
| GO:00453333 | Colorectum | MSI-H | cellular respiration | 59/1319 | 230/18723 | 1.08e-18 | 4.27e-16 | 59 |
| GO:00159803 | Colorectum | MSI-H | energy derivation by oxidation of organic compounds | 67/1319 | 318/18723 | 2.97e-16 | 1.03e-13 | 67 |
| GO:00102573 | Colorectum | MSI-H | NADH dehydrogenase complex assembly | 25/1319 | 57/18723 | 1.40e-14 | 3.53e-12 | 25 |
| GO:00329813 | Colorectum | MSI-H | mitochondrial respiratory chain complex I assembly | 25/1319 | 57/18723 | 1.40e-14 | 3.53e-12 | 25 |
| GO:00331083 | Colorectum | MSI-H | mitochondrial respiratory chain complex assembly | 30/1319 | 93/18723 | 5.71e-13 | 1.27e-10 | 30 |
| GO:00061203 | Colorectum | MSI-H | mitochondrial electron transport, NADH to ubiquinone | 22/1319 | 51/18723 | 8.17e-13 | 1.74e-10 | 22 |
| Pathway ID | Tissue | Disease Stage | Description | Gene Ratio | Bg Ratio | pvalue | p.adjust | qvalue | Count |
| hsa0501218 | Breast | Precancer | Parkinson disease | 99/684 | 266/8465 | 3.58e-42 | 5.65e-40 | 4.33e-40 | 99 |
| hsa0502016 | Breast | Precancer | Prion disease | 95/684 | 273/8465 | 1.39e-37 | 1.46e-35 | 1.12e-35 | 95 |
| hsa0501616 | Breast | Precancer | Huntington disease | 98/684 | 306/8465 | 2.85e-35 | 2.25e-33 | 1.72e-33 | 98 |
| hsa0019016 | Breast | Precancer | Oxidative phosphorylation | 59/684 | 134/8465 | 6.15e-30 | 3.24e-28 | 2.48e-28 | 59 |
| hsa0501016 | Breast | Precancer | Alzheimer disease | 103/684 | 384/8465 | 1.03e-29 | 4.66e-28 | 3.57e-28 | 103 |
| hsa0501416 | Breast | Precancer | Amyotrophic lateral sclerosis | 98/684 | 364/8465 | 2.13e-28 | 8.41e-27 | 6.44e-27 | 98 |
| hsa0502216 | Breast | Precancer | Pathways of neurodegeneration - multiple diseases | 112/684 | 476/8465 | 6.96e-27 | 2.44e-25 | 1.87e-25 | 112 |
| hsa0520818 | Breast | Precancer | Chemical carcinogenesis - reactive oxygen species | 68/684 | 223/8465 | 3.61e-23 | 1.14e-21 | 8.73e-22 | 68 |
| hsa0471418 | Breast | Precancer | Thermogenesis | 68/684 | 232/8465 | 4.40e-22 | 1.26e-20 | 9.69e-21 | 68 |
| hsa0541518 | Breast | Precancer | Diabetic cardiomyopathy | 63/684 | 203/8465 | 5.63e-22 | 1.48e-20 | 1.14e-20 | 63 |
| hsa0493216 | Breast | Precancer | Non-alcoholic fatty liver disease | 48/684 | 155/8465 | 6.16e-17 | 1.50e-15 | 1.15e-15 | 48 |
| hsa0472316 | Breast | Precancer | Retrograde endocannabinoid signaling | 25/684 | 148/8465 | 3.05e-04 | 2.47e-03 | 1.89e-03 | 25 |
| hsa0501219 | Breast | Precancer | Parkinson disease | 99/684 | 266/8465 | 3.58e-42 | 5.65e-40 | 4.33e-40 | 99 |
| hsa0502017 | Breast | Precancer | Prion disease | 95/684 | 273/8465 | 1.39e-37 | 1.46e-35 | 1.12e-35 | 95 |
| hsa0501617 | Breast | Precancer | Huntington disease | 98/684 | 306/8465 | 2.85e-35 | 2.25e-33 | 1.72e-33 | 98 |
| hsa0019017 | Breast | Precancer | Oxidative phosphorylation | 59/684 | 134/8465 | 6.15e-30 | 3.24e-28 | 2.48e-28 | 59 |
| hsa0501017 | Breast | Precancer | Alzheimer disease | 103/684 | 384/8465 | 1.03e-29 | 4.66e-28 | 3.57e-28 | 103 |
| hsa0501417 | Breast | Precancer | Amyotrophic lateral sclerosis | 98/684 | 364/8465 | 2.13e-28 | 8.41e-27 | 6.44e-27 | 98 |
| hsa0502217 | Breast | Precancer | Pathways of neurodegeneration - multiple diseases | 112/684 | 476/8465 | 6.96e-27 | 2.44e-25 | 1.87e-25 | 112 |
| hsa0520819 | Breast | Precancer | Chemical carcinogenesis - reactive oxygen species | 68/684 | 223/8465 | 3.61e-23 | 1.14e-21 | 8.73e-22 | 68 |


