Schematic overview of the cellular and molecular mechanisms involved in the cancer progression, including the proposed cellular and molecular mechanisms in cancer cells trajectory. AT1: alveolar type 1 cells; AT2: alveolar type 2 cells; AAH: atypical adenomatous hyperplasia; AIS: adenocarcinoma in situ; MIA: minimally invasive adenocarcinoma; IA: invasive adenocarcinoma; EMT: epithelial-mesenchymal transition

Home

Download

Statistics

Help

Contact

Center for Computational Systems Medicine
leaf

Gene summary

leaf

Malignant transformation analysis

leaf

Malignant transformation related pathway analysis

leaf

Cell-cell communication analysis

leaf

Single-cell gene regulatory network inference analysis

leaf

Somatic mutation of malignant transformation related genes

leaf

Related drugs of malignant transformation related genes

Gene: N4BP2L2

Gene summary for N4BP2L2

check button Gene summary.

Gene informationSpeciesHuman
Gene symbol

N4BP2L2

Gene ID

10443

Gene nameNEDD4 binding protein 2 like 2
Gene Alias92M18.3
Cytomap13q13.1
Gene Typeprotein-coding
GO ID

GO:0000122

UniProtAcc

B4DPY1


Top

Malignant transformation analysis

check button Identification of the aberrant gene expression in precancerous and cancerous lesions by comparing the gene expression of stem-like cells in diseased tissues with normal stem cells
check button Malignant transformation involving gene list.
Entrez IDSymbolReplicatesSpeciesOrganTissueAdj P-valueLog2FCMalignancy
10443N4BP2L2GSM4909282HumanBreastIDC4.33e-10-4.52e-01-0.0288
10443N4BP2L2GSM4909286HumanBreastIDC5.52e-03-1.60e-020.1081
10443N4BP2L2GSM4909287HumanBreastIDC3.60e-07-4.17e-010.2057
10443N4BP2L2GSM4909291HumanBreastIDC4.91e-07-4.96e-010.1753
10443N4BP2L2GSM4909292HumanBreastIDC2.97e-034.26e-010.1236
10443N4BP2L2GSM4909294HumanBreastIDC4.25e-12-4.43e-010.2022
10443N4BP2L2GSM4909296HumanBreastIDC3.01e-28-6.08e-010.1524
10443N4BP2L2GSM4909297HumanBreastIDC3.84e-444.15e-010.1517
10443N4BP2L2GSM4909298HumanBreastIDC9.90e-205.17e-010.1551
10443N4BP2L2GSM4909301HumanBreastIDC4.89e-07-3.46e-010.1577
10443N4BP2L2GSM4909304HumanBreastIDC1.07e-02-2.97e-010.1636
10443N4BP2L2GSM4909309HumanBreastIDC4.83e-04-2.67e-010.0483
10443N4BP2L2GSM4909311HumanBreastIDC2.03e-43-5.44e-010.1534
10443N4BP2L2GSM4909312HumanBreastIDC1.81e-16-3.45e-010.1552
10443N4BP2L2GSM4909313HumanBreastIDC2.41e-03-2.52e-010.0391
10443N4BP2L2GSM4909315HumanBreastIDC6.03e-07-3.88e-010.21
10443N4BP2L2GSM4909316HumanBreastIDC7.78e-06-5.94e-010.21
10443N4BP2L2GSM4909317HumanBreastIDC1.33e-104.49e-010.1355
10443N4BP2L2GSM4909319HumanBreastIDC6.13e-48-6.38e-010.1563
10443N4BP2L2GSM4909320HumanBreastIDC1.21e-13-7.00e-010.1575
Page: 1 2 3 4 5 6 7 8 9 10 11 12 13 14 15 

check button Transcriptomic changes along malignancy continuum.
TissueExpression DynamicsAbbreviation
BreastThe image shows the transcriptomic changes along malignancy continuum.log2FC in expression of this searched gene in stem-like cells from each diseased tissue sample relative to stem-like cells in normal samples in each tissue plotted against the malignancy continuum. Samples are colored based on if they are from different disease stage.
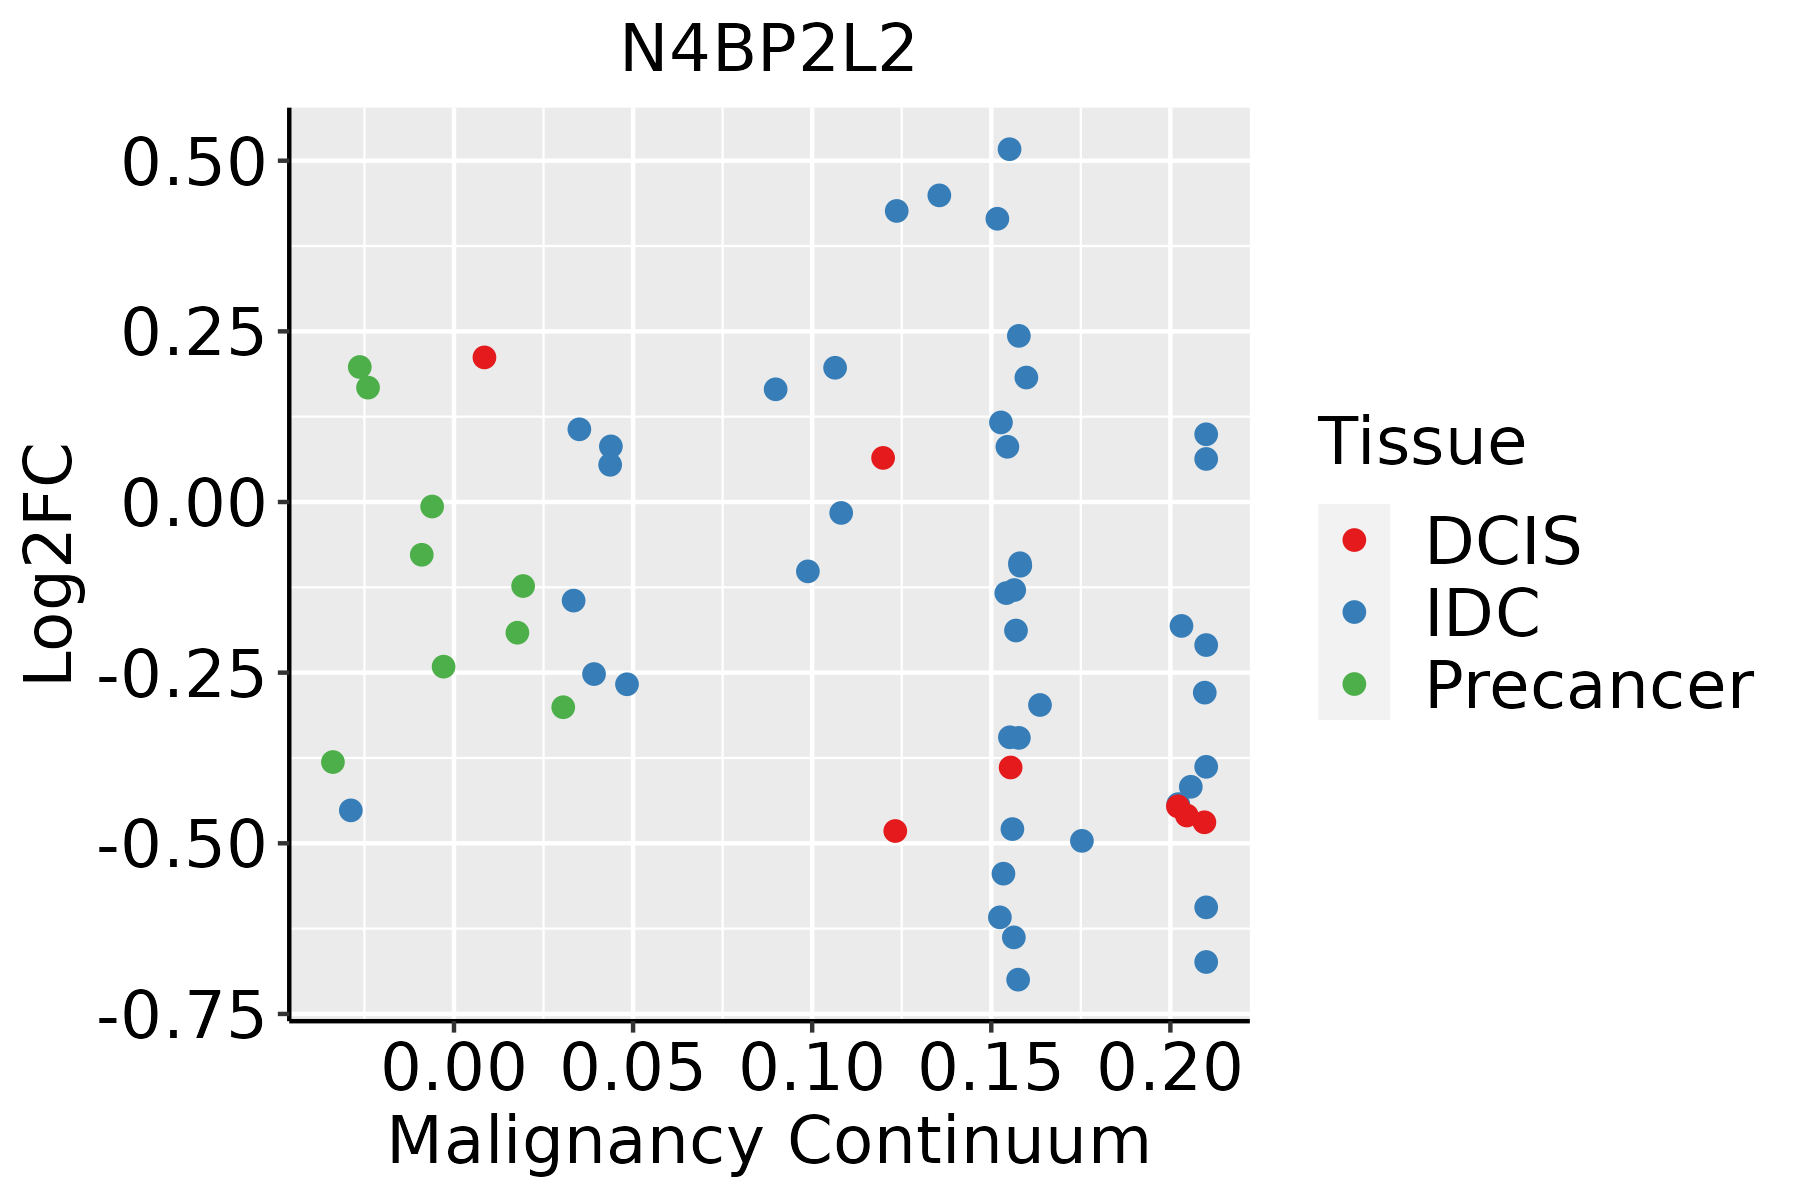
IDC: Invasive ductal carcinoma
DCIS: Ductal carcinoma in situ
Precancer(BRCA1-mut): Precancerous lesion from BRCA1 mutation carriers
CervixThe image shows the transcriptomic changes along malignancy continuum.log2FC in expression of this searched gene in stem-like cells from each diseased tissue sample relative to stem-like cells in normal samples in each tissue plotted against the malignancy continuum. Samples are colored based on if they are from different disease stage.CC: Cervix cancer
HSIL_HPV: HPV-infected high-grade squamous intraepithelial lesions
N_HPV: HPV-infected normal cervix
Colorectum (GSE201348)The image shows the transcriptomic changes along malignancy continuum.log2FC in expression of this searched gene in stem-like cells from each diseased tissue sample relative to stem-like cells in normal samples in each tissue plotted against the malignancy continuum. Samples are colored based on if they are from different disease stage.FAP: Familial adenomatous polyposis
CRC: Colorectal cancer
Colorectum (HTA11)The image shows the transcriptomic changes along malignancy continuum.log2FC in expression of this searched gene in stem-like cells from each diseased tissue sample relative to stem-like cells in normal samples in each tissue plotted against the malignancy continuum. Samples are colored based on if they are from different disease stage.AD: Adenomas
SER: Sessile serrated lesions
MSI-H: Microsatellite-high colorectal cancer
MSS: Microsatellite stable colorectal cancer
EndometriumThe image shows the transcriptomic changes along malignancy continuum.log2FC in expression of this searched gene in stem-like cells from each diseased tissue sample relative to stem-like cells in normal samples in each tissue plotted against the malignancy continuum. Samples are colored based on if they are from different disease stage.
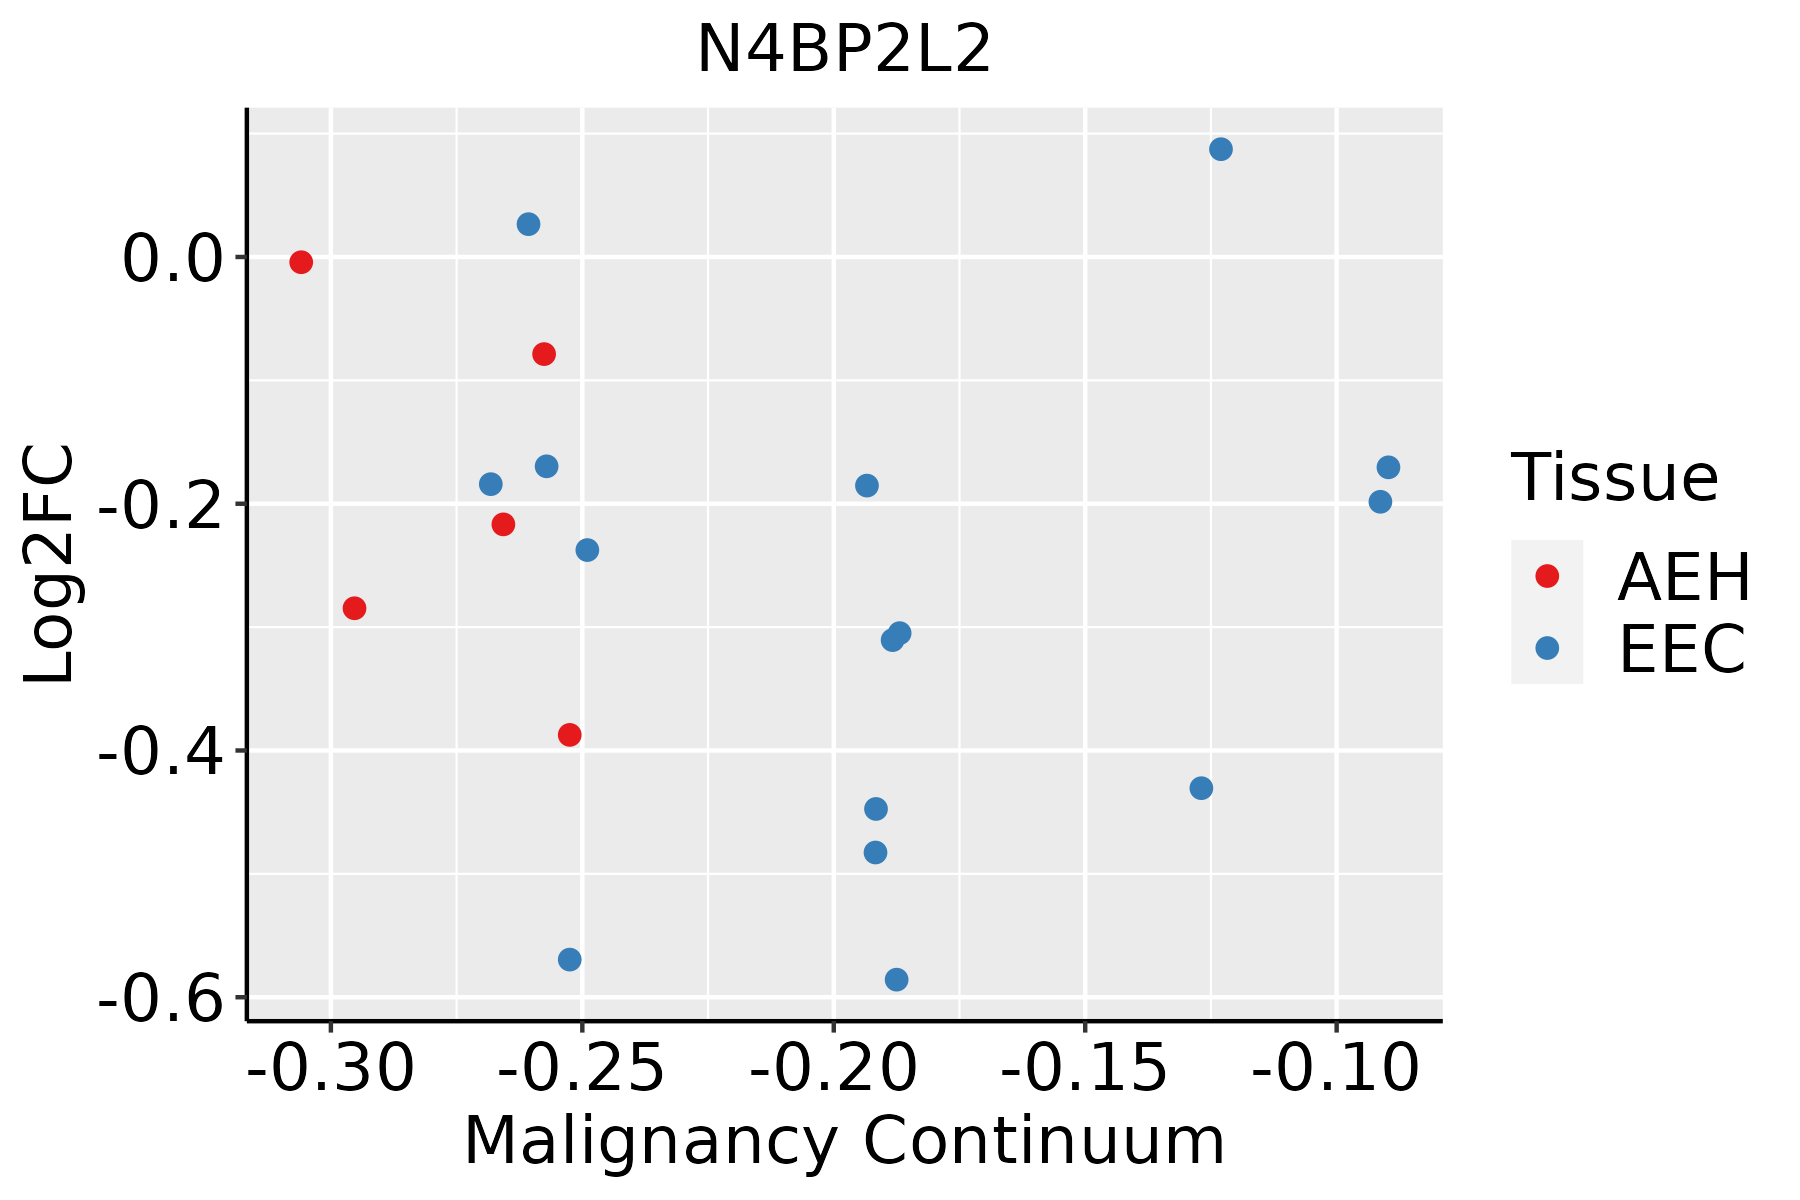
AEH: Atypical endometrial hyperplasia
EEC: Endometrioid Cancer
EsophagusThe image shows the transcriptomic changes along malignancy continuum.log2FC in expression of this searched gene in stem-like cells from each diseased tissue sample relative to stem-like cells in normal samples in each tissue plotted against the malignancy continuum. Samples are colored based on if they are from different disease stage.ESCC: Esophageal squamous cell carcinoma
HGIN: High-grade intraepithelial neoplasias
LGIN: Low-grade intraepithelial neoplasias
LiverThe image shows the transcriptomic changes along malignancy continuum.log2FC in expression of this searched gene in stem-like cells from each diseased tissue sample relative to stem-like cells in normal samples in each tissue plotted against the malignancy continuum. Samples are colored based on if they are from different disease stage.
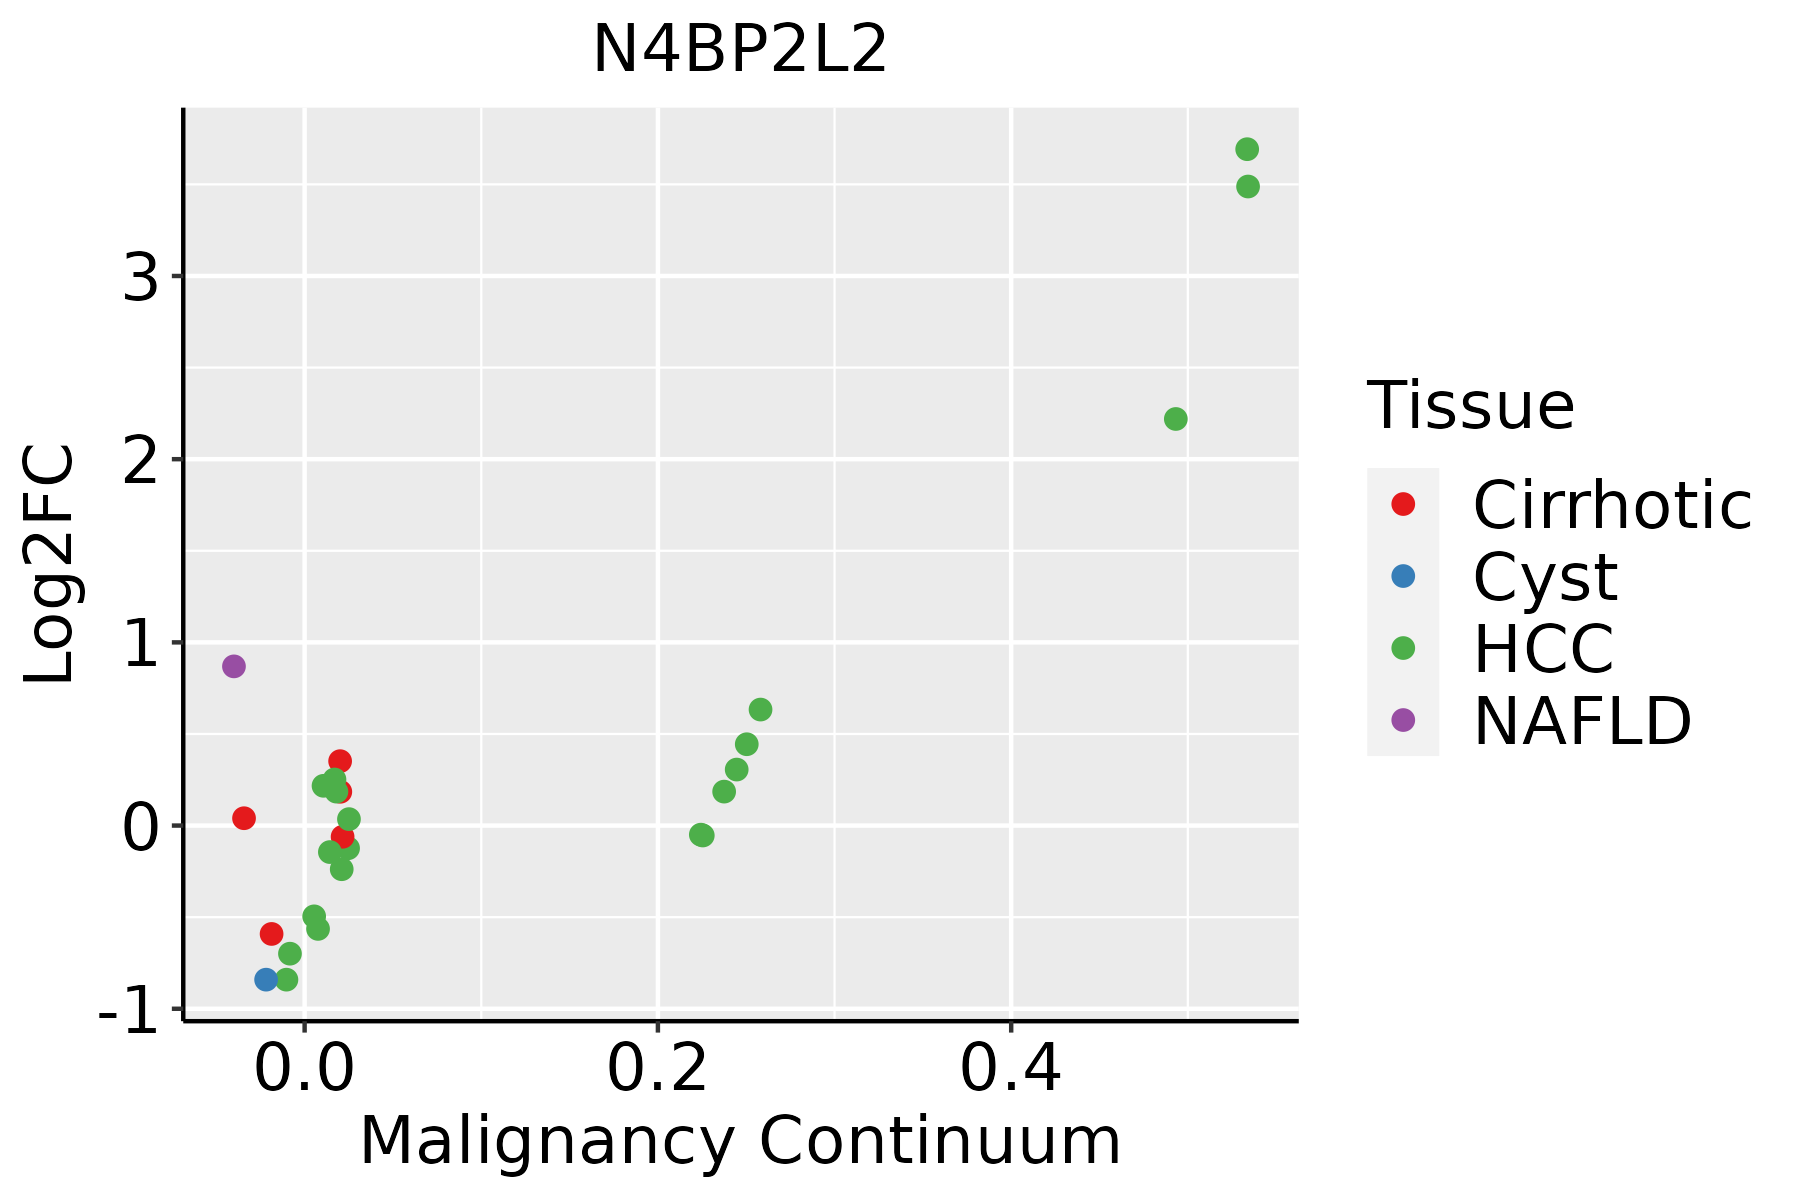
HCC: Hepatocellular carcinoma
NAFLD: Non-alcoholic fatty liver disease
LungThe image shows the transcriptomic changes along malignancy continuum.log2FC in expression of this searched gene in stem-like cells from each diseased tissue sample relative to stem-like cells in normal samples in each tissue plotted against the malignancy continuum. Samples are colored based on if they are from different disease stage.AAH: Atypical adenomatous hyperplasia
AIS: Adenocarcinoma in situ
IAC: Invasive lung adenocarcinoma
MIA: Minimally invasive adenocarcinoma
Oral CavityThe image shows the transcriptomic changes along malignancy continuum.log2FC in expression of this searched gene in stem-like cells from each diseased tissue sample relative to stem-like cells in normal samples in each tissue plotted against the malignancy continuum. Samples are colored based on if they are from different disease stage.
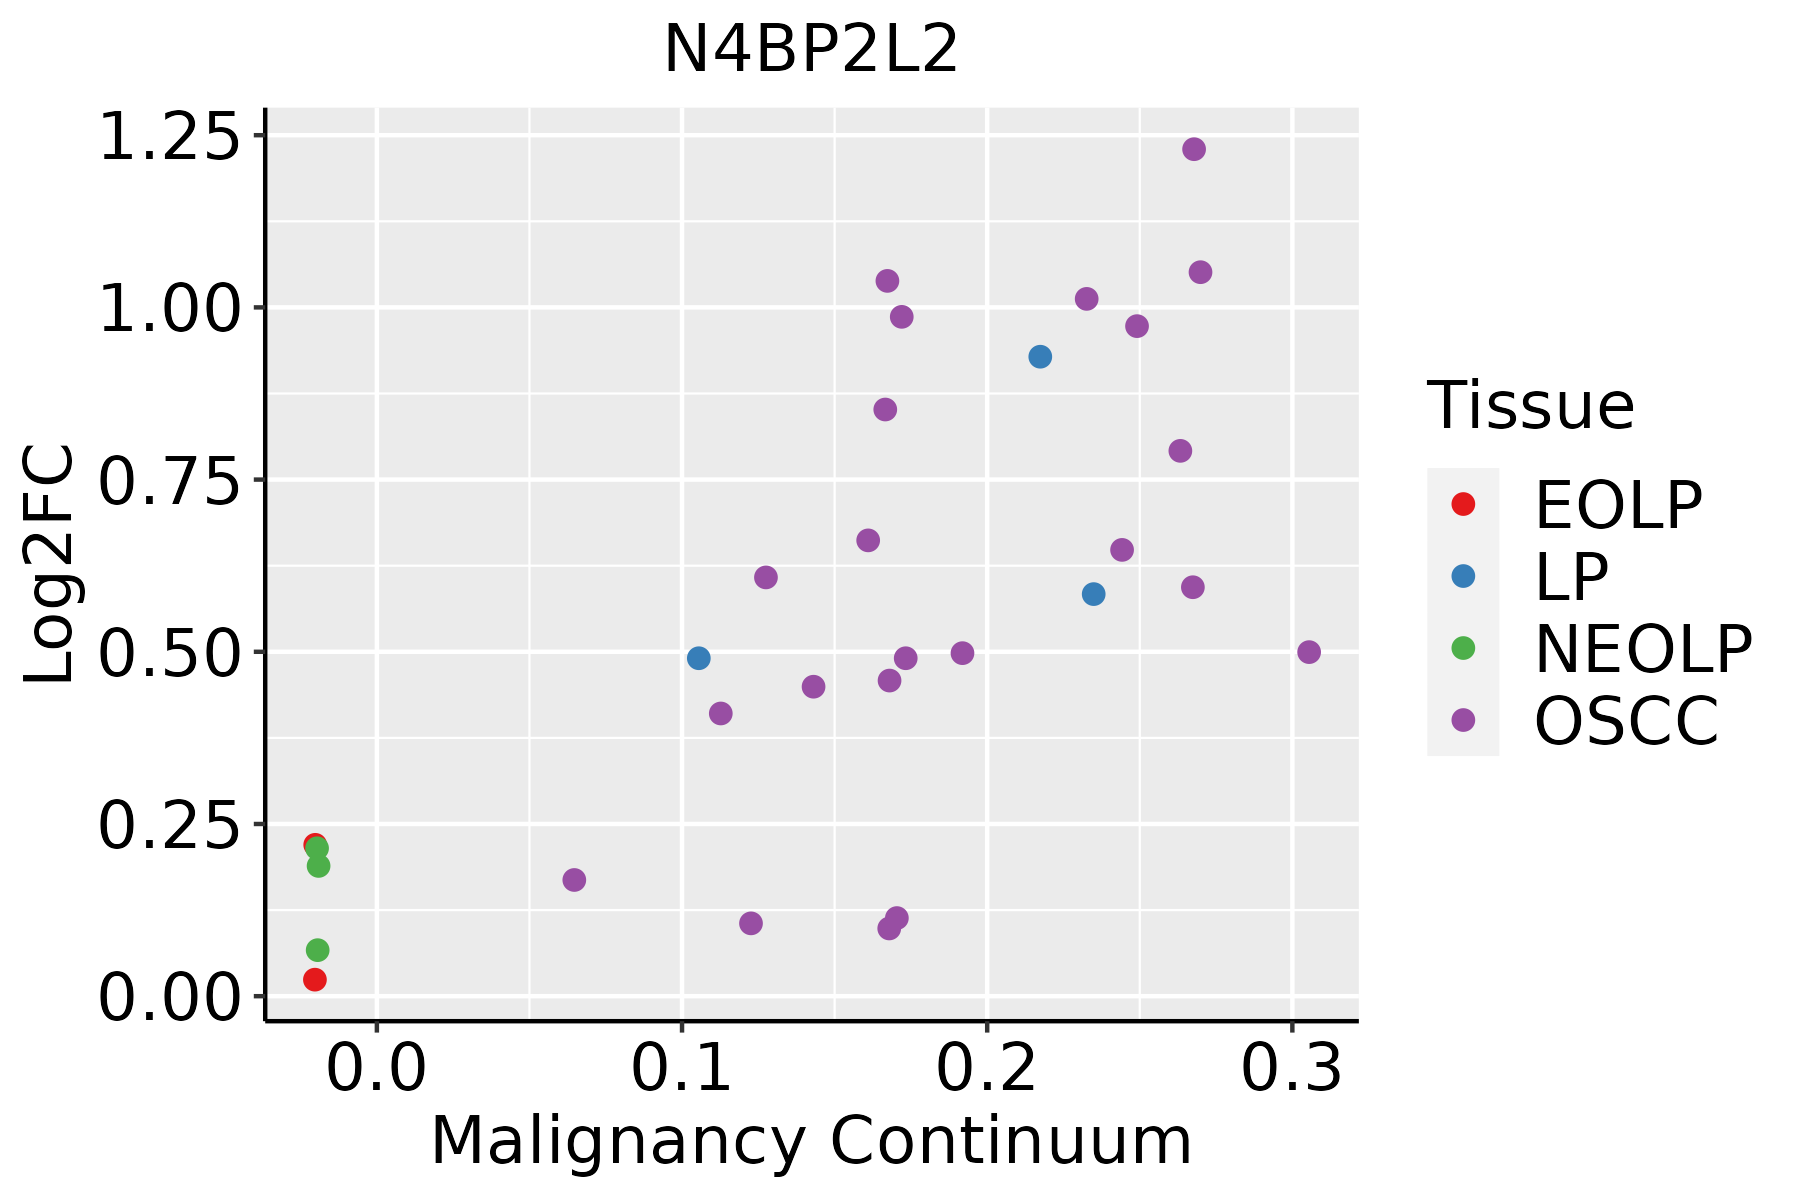
EOLP: Erosive Oral lichen planus
LP: leukoplakia
NEOLP: Non-erosive oral lichen planus
OSCC: Oral squamous cell carcinoma
ProstateThe image shows the transcriptomic changes along malignancy continuum.log2FC in expression of this searched gene in stem-like cells from each diseased tissue sample relative to stem-like cells in normal samples in each tissue plotted against the malignancy continuum. Samples are colored based on if they are from different disease stage.BPH: Benign Prostatic Hyperplasia
SkinThe image shows the transcriptomic changes along malignancy continuum.log2FC in expression of this searched gene in stem-like cells from each diseased tissue sample relative to stem-like cells in normal samples in each tissue plotted against the malignancy continuum. Samples are colored based on if they are from different disease stage.
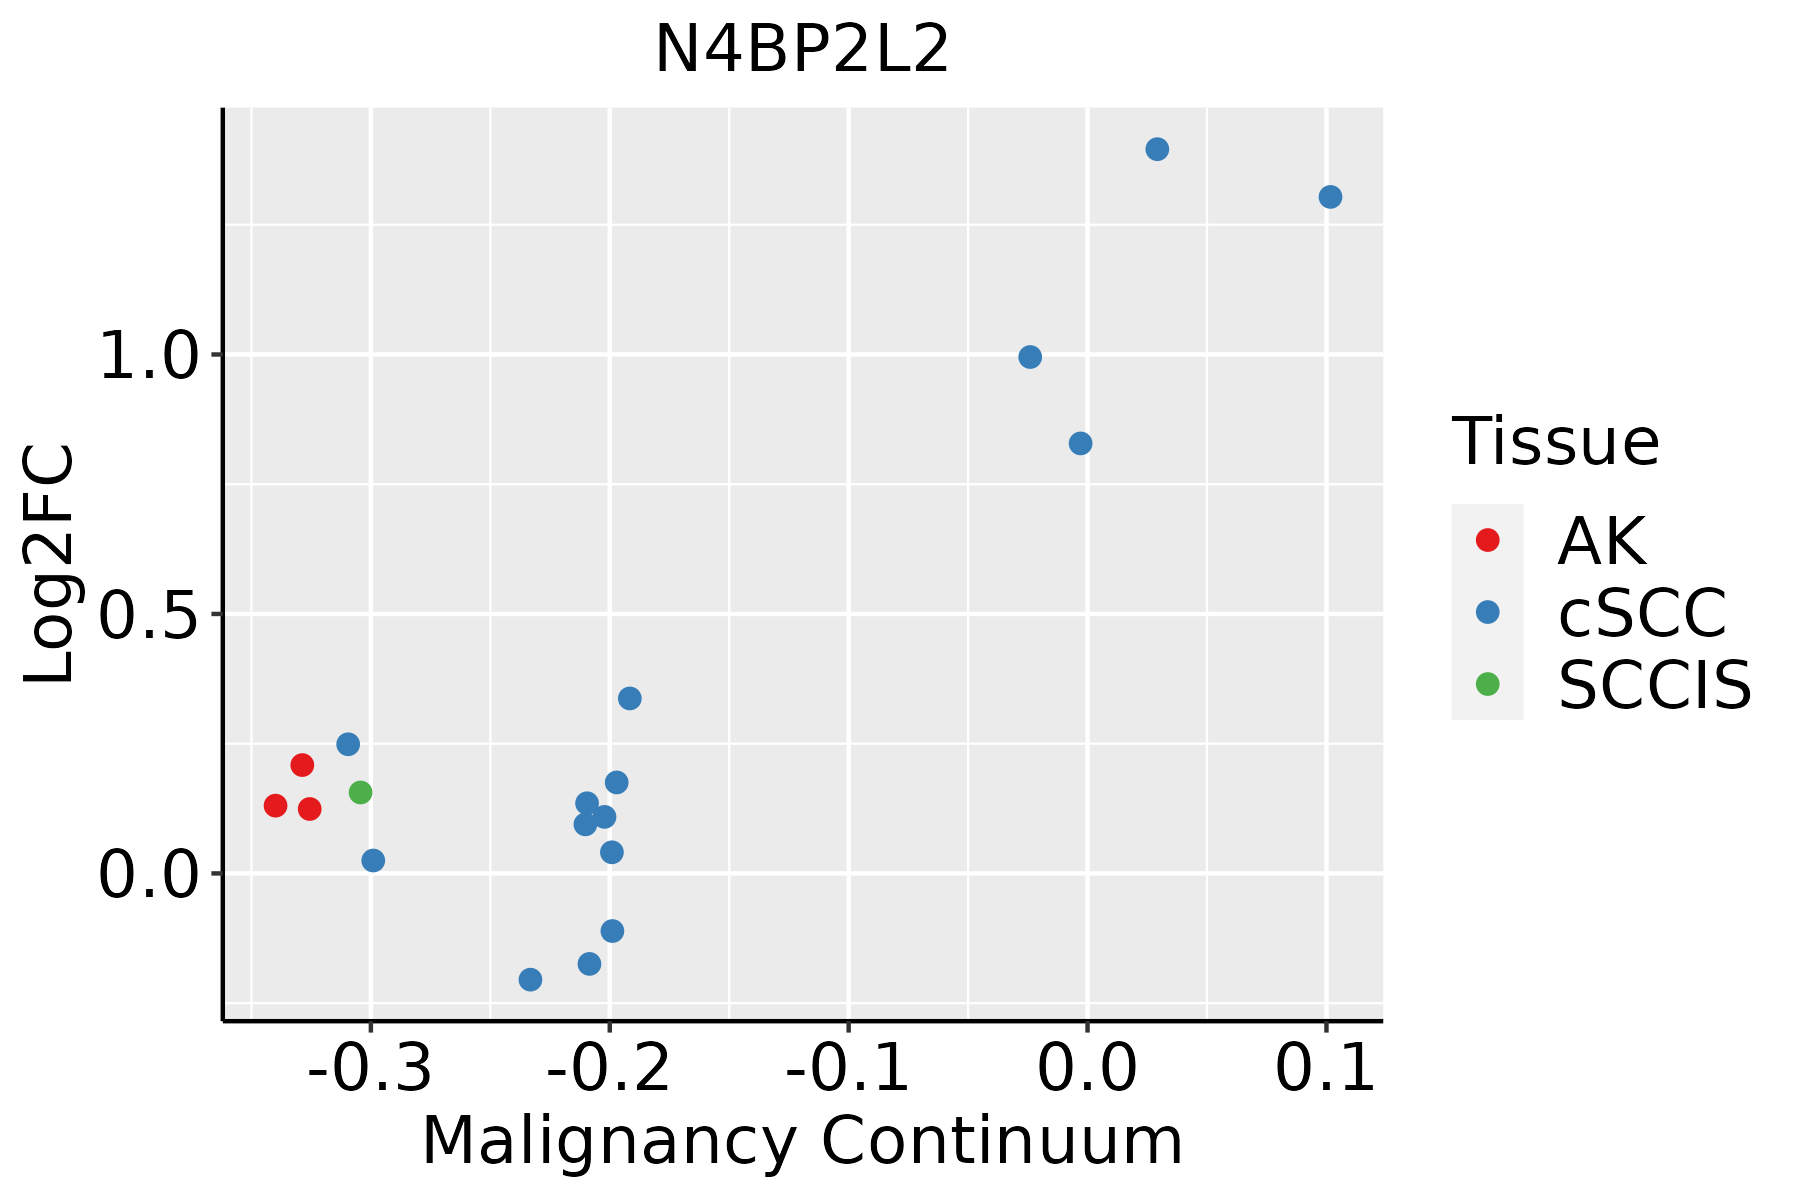
AK: Actinic keratosis
cSCC: Cutaneous squamous cell carcinoma
SCCIS:squamous cell carcinoma in situ
ThyroidThe image shows the transcriptomic changes along malignancy continuum.log2FC in expression of this searched gene in stem-like cells from each diseased tissue sample relative to stem-like cells in normal samples in each tissue plotted against the malignancy continuum. Samples are colored based on if they are from different disease stage.
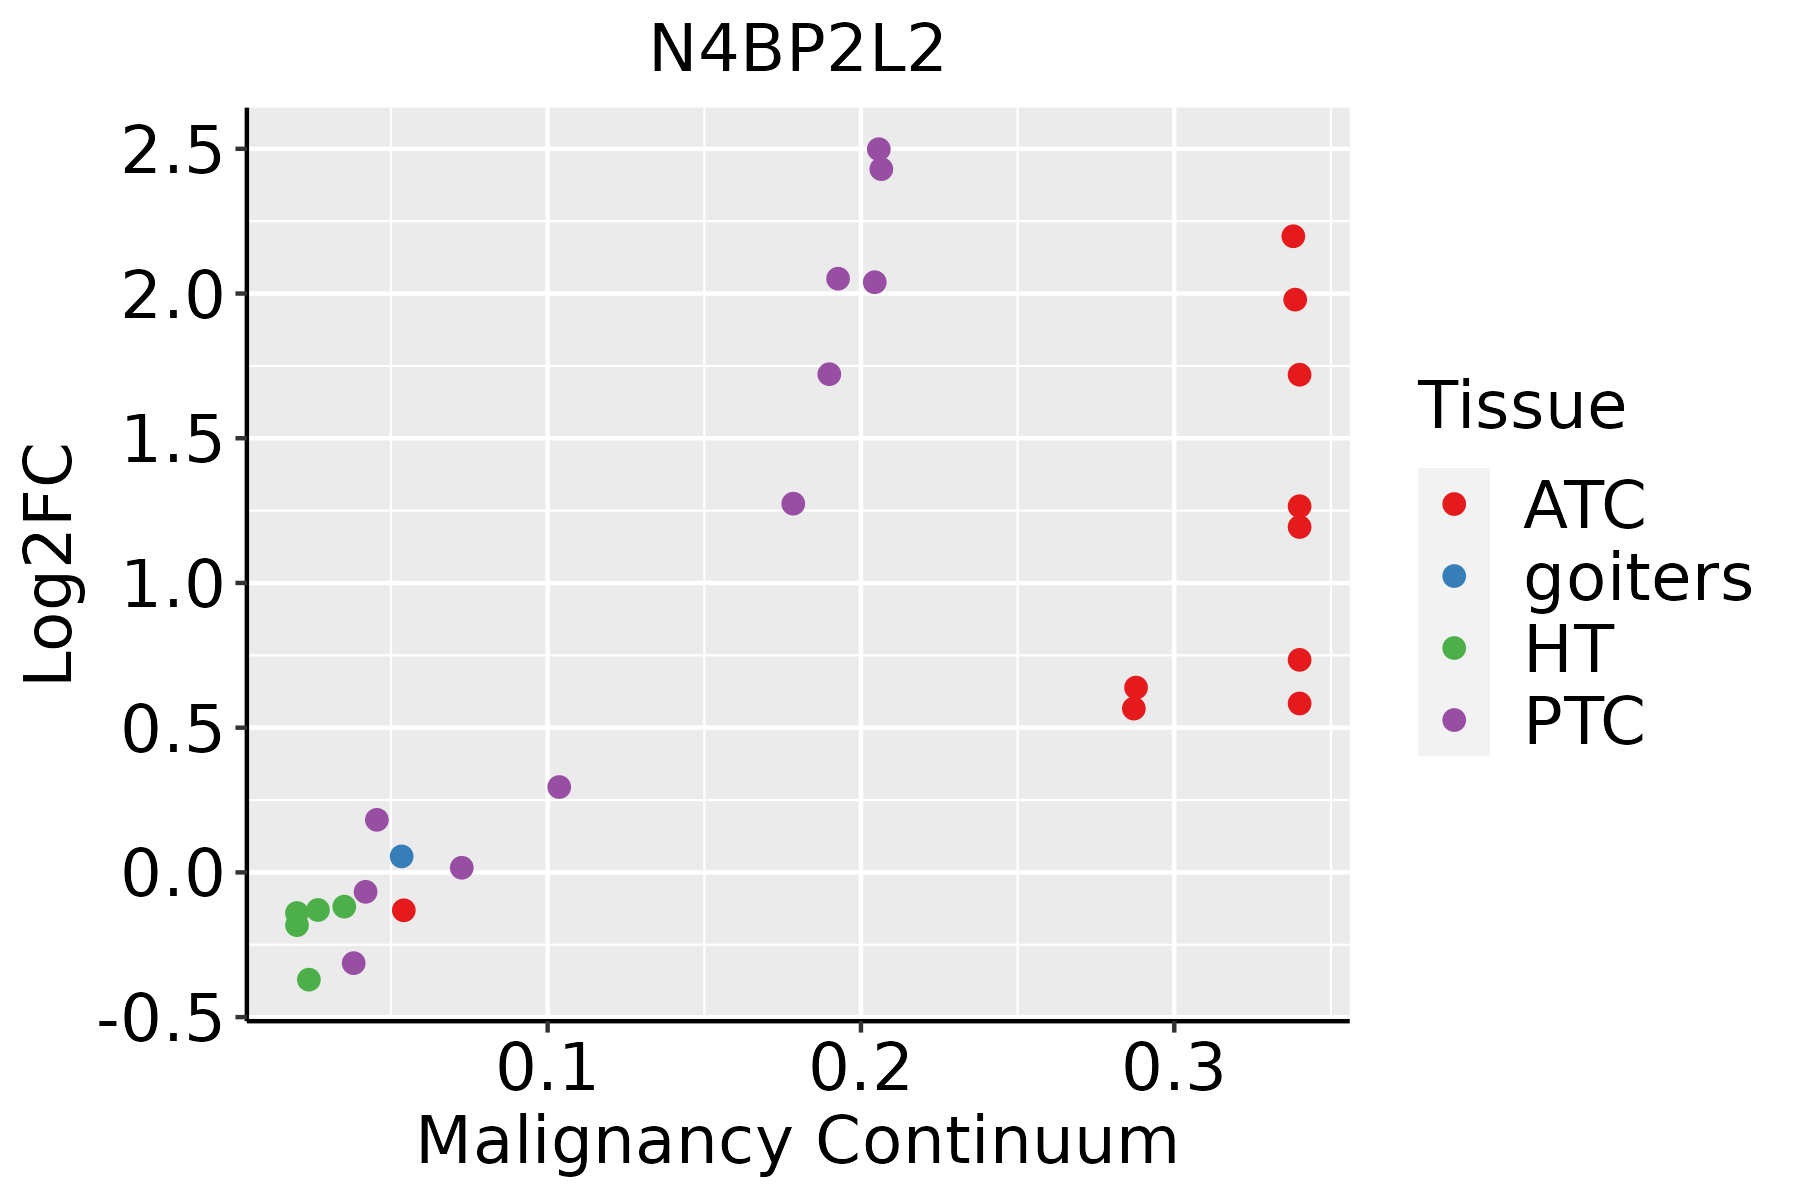
ATC: Anaplastic thyroid cancer
HT: Hashimoto's thyroiditis
PTC: Papillary thyroid cancer
∗log2FC in expression of this searched gene in stem-like cells from each diseased tissue sample relative to stem-like cells in normal samples in each tissue plotted against the malignancy continuum. Samples are colored based on if they are from different disease stage.

Top

Malignant transformation related pathway analysis

check buttonFind out the enriched GO biological processes and KEGG pathways involved in transition from healthy to precancer to cancer
check button Figure of enriched GO biological processes.
TissueDisease StageEnriched GO biological Processes
ColorectumADGO analysis - Figure of enriched GO biological processes: Top 15 enriched GO BP terms are showed in the bar plot of each disease state in each tissue. Each row represents a significant GO biological process which is colored according to the -log10(p.adjust).
ColorectumSERGO analysis - Figure of enriched GO biological processes: Top 15 enriched GO BP terms are showed in the bar plot of each disease state in each tissue. Each row represents a significant GO biological process which is colored according to the -log10(p.adjust).
ColorectumMSSGO analysis - Figure of enriched GO biological processes: Top 15 enriched GO BP terms are showed in the bar plot of each disease state in each tissue. Each row represents a significant GO biological process which is colored according to the -log10(p.adjust).
ColorectumMSI-HGO analysis - Figure of enriched GO biological processes: Top 15 enriched GO BP terms are showed in the bar plot of each disease state in each tissue. Each row represents a significant GO biological process which is colored according to the -log10(p.adjust).
ColorectumFAPGO analysis - Figure of enriched GO biological processes: Top 15 enriched GO BP terms are showed in the bar plot of each disease state in each tissue. Each row represents a significant GO biological process which is colored according to the -log10(p.adjust).
∗Top 15 enriched GO BP terms are showed in the bar plot of each disease state in each tissue. Each row represents a significant GO biological process which is colored according to the -log10(p.adjust).
Page: 1 2 3 4 5 6 7 8 9 

check button Enriched GO biological processes.
GO IDTissueDisease StageDescriptionGene RatioBg Ratiopvaluep.adjustCount
GO:200073715SkincSCCnegative regulation of stem cell differentiation16/486423/187231.47e-051.82e-0416
GO:190203611SkincSCCregulation of hematopoietic stem cell differentiation9/486414/187232.87e-031.60e-029
GO:190153211SkincSCCregulation of hematopoietic progenitor cell differentiation16/486432/187233.04e-031.67e-0216
GO:006021812SkincSCChematopoietic stem cell differentiation15/486430/187234.07e-032.16e-0215
GO:000224413SkincSCChematopoietic progenitor cell differentiation42/4864114/187236.74e-033.27e-0242
GO:004886317SkincSCCstem cell differentiation69/4864206/187239.56e-034.30e-0269
GO:0001701111ThyroidPTCin utero embryonic development175/5968367/187231.40e-104.73e-09175
GO:20007367ThyroidPTCregulation of stem cell differentiation32/596858/187232.01e-041.50e-0332
GO:200073716ThyroidPTCnegative regulation of stem cell differentiation16/596823/187232.31e-041.67e-0316
GO:00018246ThyroidPTCblastocyst development49/5968106/187231.37e-037.72e-0349
GO:004886318ThyroidPTCstem cell differentiation85/5968206/187232.71e-031.36e-0285
GO:19015325ThyroidPTCregulation of hematopoietic progenitor cell differentiation18/596832/187233.72e-031.79e-0218
GO:00602187ThyroidPTChematopoietic stem cell differentiation17/596830/187234.31e-032.04e-0217
GO:19020365ThyroidPTCregulation of hematopoietic stem cell differentiation9/596814/187231.27e-024.92e-029
GO:000170126ThyroidATCin utero embryonic development183/6293367/187236.62e-112.11e-09183
GO:004886321ThyroidATCstem cell differentiation97/6293206/187233.88e-053.15e-0497
GO:200073616ThyroidATCregulation of stem cell differentiation33/629358/187232.25e-041.46e-0333
GO:000182414ThyroidATCblastocyst development53/6293106/187233.48e-042.16e-0353
GO:200073721ThyroidATCnegative regulation of stem cell differentiation16/629323/187234.58e-042.71e-0316
GO:190153212ThyroidATCregulation of hematopoietic progenitor cell differentiation19/629332/187232.46e-031.14e-0219
Page: 1 2 3 4 5 6 7 

check button Enriched KEGG pathways.
Pathway IDTissueDisease StageDescriptionGene RatioBg Ratiopvaluep.adjustqvalueCount
Page: 1 

Top

Cell-cell communication analysis

check buttonIdentification of potential cell-cell interactions between two cell types and their ligand-receptor pairs for different disease states
LigandReceptorLRpairPathwayTissueDisease Stage
Page: 1 

Top

Single-cell gene regulatory network inference analysis

check buttonFind out the significant the regulons (TFs) and the target genes of each regulon across cell types for different disease states
TFCell TypeTissueDisease StageTarget GeneRSSRegulon Activity
∗The dot plots of a searched regulon are shown for all cell subpopulations in each disease state of each tissue based on the regulon specific score inferred using pySCENIC and by calculating the average expression.
Page: 1 

Top

Somatic mutation of malignant transformation related genes

check buttonAnnotation of somatic variants for genes involved in malignant transformation
Hugo SymbolVariant ClassVariant ClassificationdbSNP RSHGVScHGVSpHGVSp ShortSWISSPROTBIOTYPESIFTPolyPhenTumor Sample BarcodeTissueHistologySexAgeStageTherapy TypesDrugsOutcome
N4BP2L2SNVMissense_Mutationc.907N>Tp.His303Tyrp.H303YQ92802protein_codingdeleterious(0.02)benign(0.047)TCGA-A2-A0D4-01Breastbreast invasive carcinomaFemale<65I/IIChemotherapyadriamycinSD
N4BP2L2SNVMissense_Mutationnovelc.1801N>Ap.His601Asnp.H601NQ92802protein_codingdeleterious(0.03)benign(0.08)TCGA-AC-A3TM-01Breastbreast invasive carcinomaFemale<65III/IVChemotherapycytoxanCR
N4BP2L2SNVMissense_Mutationnovelc.1452T>Ap.Asn484Lysp.N484KQ92802protein_codingdeleterious(0.02)benign(0.007)TCGA-BH-A0BO-01Breastbreast invasive carcinomaFemale<65I/IIUnknownUnknownSD
N4BP2L2SNVMissense_Mutationc.294N>Cp.Lys98Asnp.K98NQ92802protein_codingdeleterious(0)probably_damaging(1)TCGA-BH-A209-01Breastbreast invasive carcinomaFemale>=65I/IIUnknownUnknownSD
N4BP2L2insertionFrame_Shift_Insnovelc.105_106insCTTTTTACTTTGTGCTTTCATGTTGCTCCCACTTTp.Ala36LeufsTer22p.A36Lfs*22Q92802protein_codingTCGA-AR-A0TY-01Breastbreast invasive carcinomaFemale<65I/IIUnspecificPaclitaxelPD
N4BP2L2SNVMissense_Mutationc.1861G>Ap.Glu621Lysp.E621KQ92802protein_codingtolerated(1)benign(0)TCGA-2W-A8YY-01Cervixcervical & endocervical cancerFemale<65I/IIChemotherapycisplatinCR
N4BP2L2SNVMissense_Mutationnovelc.172C>Tp.Pro58Serp.P58SQ92802protein_codingdeleterious(0)probably_damaging(0.998)TCGA-MA-AA42-01Cervixcervical & endocervical cancerFemale>=65I/IIUnknownUnknownSD
N4BP2L2SNVMissense_Mutationnovelc.459N>Tp.Gln153Hisp.Q153HQ92802protein_codingdeleterious(0)possibly_damaging(0.61)TCGA-VS-A94Z-01Cervixcervical & endocervical cancerFemale<65I/IIChemotherapycisplatinCR
N4BP2L2insertionFrame_Shift_Insnovelc.1700dupCp.Leu568PhefsTer4p.L568Ffs*4Q92802protein_codingTCGA-2W-A8YY-01Cervixcervical & endocervical cancerFemale<65I/IIChemotherapycisplatinCR
N4BP2L2SNVMissense_Mutationc.230C>Gp.Thr77Serp.T77SQ92802protein_codingdeleterious(0)probably_damaging(0.999)TCGA-A6-2684-01Colorectumcolon adenocarcinomaFemale>=65I/IIUnknownUnknownPD
Page: 1 2 3 4 5 6 7 8 

Top

Related drugs of malignant transformation related genes

check buttonIdentification of chemicals and drugs interact with genes involved in malignant transfromation
(DGIdb 4.0)
Entrez IDSymbolCategoryInteraction TypesDrug Claim NameDrug NamePMIDs
Page: 1