
|
|||||
|
 | |
| |
| |
| |
| |
| |
|
Gene: MMP7 |
Gene summary for MMP7 |
| Gene information | Species | Human | Gene symbol | MMP7 | Gene ID | 4316 |
| Gene name | matrix metallopeptidase 7 | |
| Gene Alias | MMP-7 | |
| Cytomap | 11q22.2 | |
| Gene Type | protein-coding | GO ID | GO:0000003 | UniProtAcc | P09237 |
Top |
Malignant transformation analysis |
| Identification of the aberrant gene expression in precancerous and cancerous lesions by comparing the gene expression of stem-like cells in diseased tissues with normal stem cells |
| Entrez ID | Symbol | Replicates | Species | Organ | Tissue | Adj P-value | Log2FC | Malignancy |
| 4316 | MMP7 | GSM4909281 | Human | Breast | IDC | 6.83e-08 | -5.72e-01 | 0.21 |
| 4316 | MMP7 | GSM4909286 | Human | Breast | IDC | 1.84e-33 | -8.58e-01 | 0.1081 |
| 4316 | MMP7 | GSM4909290 | Human | Breast | IDC | 8.75e-25 | -8.58e-01 | 0.2096 |
| 4316 | MMP7 | GSM4909291 | Human | Breast | IDC | 1.86e-20 | -8.58e-01 | 0.1753 |
| 4316 | MMP7 | GSM4909292 | Human | Breast | IDC | 1.18e-03 | -8.58e-01 | 0.1236 |
| 4316 | MMP7 | GSM4909293 | Human | Breast | IDC | 1.09e-27 | -7.86e-01 | 0.1581 |
| 4316 | MMP7 | GSM4909294 | Human | Breast | IDC | 5.17e-22 | -7.04e-01 | 0.2022 |
| 4316 | MMP7 | GSM4909296 | Human | Breast | IDC | 6.87e-19 | -7.45e-01 | 0.1524 |
| 4316 | MMP7 | GSM4909297 | Human | Breast | IDC | 1.07e-26 | -7.73e-01 | 0.1517 |
| 4316 | MMP7 | GSM4909298 | Human | Breast | IDC | 1.29e-14 | -6.19e-01 | 0.1551 |
| 4316 | MMP7 | GSM4909301 | Human | Breast | IDC | 1.01e-32 | -8.48e-01 | 0.1577 |
| 4316 | MMP7 | GSM4909302 | Human | Breast | IDC | 6.97e-21 | -7.36e-01 | 0.1545 |
| 4316 | MMP7 | GSM4909303 | Human | Breast | IDC | 1.18e-05 | -7.81e-01 | 0.0438 |
| 4316 | MMP7 | GSM4909304 | Human | Breast | IDC | 7.23e-34 | -8.53e-01 | 0.1636 |
| 4316 | MMP7 | GSM4909306 | Human | Breast | IDC | 9.23e-08 | -5.10e-01 | 0.1564 |
| 4316 | MMP7 | GSM4909307 | Human | Breast | IDC | 1.12e-04 | -2.99e-01 | 0.1569 |
| 4316 | MMP7 | GSM4909308 | Human | Breast | IDC | 3.04e-27 | -8.54e-01 | 0.158 |
| 4316 | MMP7 | GSM4909311 | Human | Breast | IDC | 1.28e-11 | -4.17e-01 | 0.1534 |
| 4316 | MMP7 | GSM4909312 | Human | Breast | IDC | 4.69e-33 | -8.58e-01 | 0.1552 |
| 4316 | MMP7 | GSM4909313 | Human | Breast | IDC | 1.54e-07 | -5.80e-01 | 0.0391 |
| Page: 1 2 3 4 5 6 7 8 |
| Tissue | Expression Dynamics | Abbreviation |
| Breast | 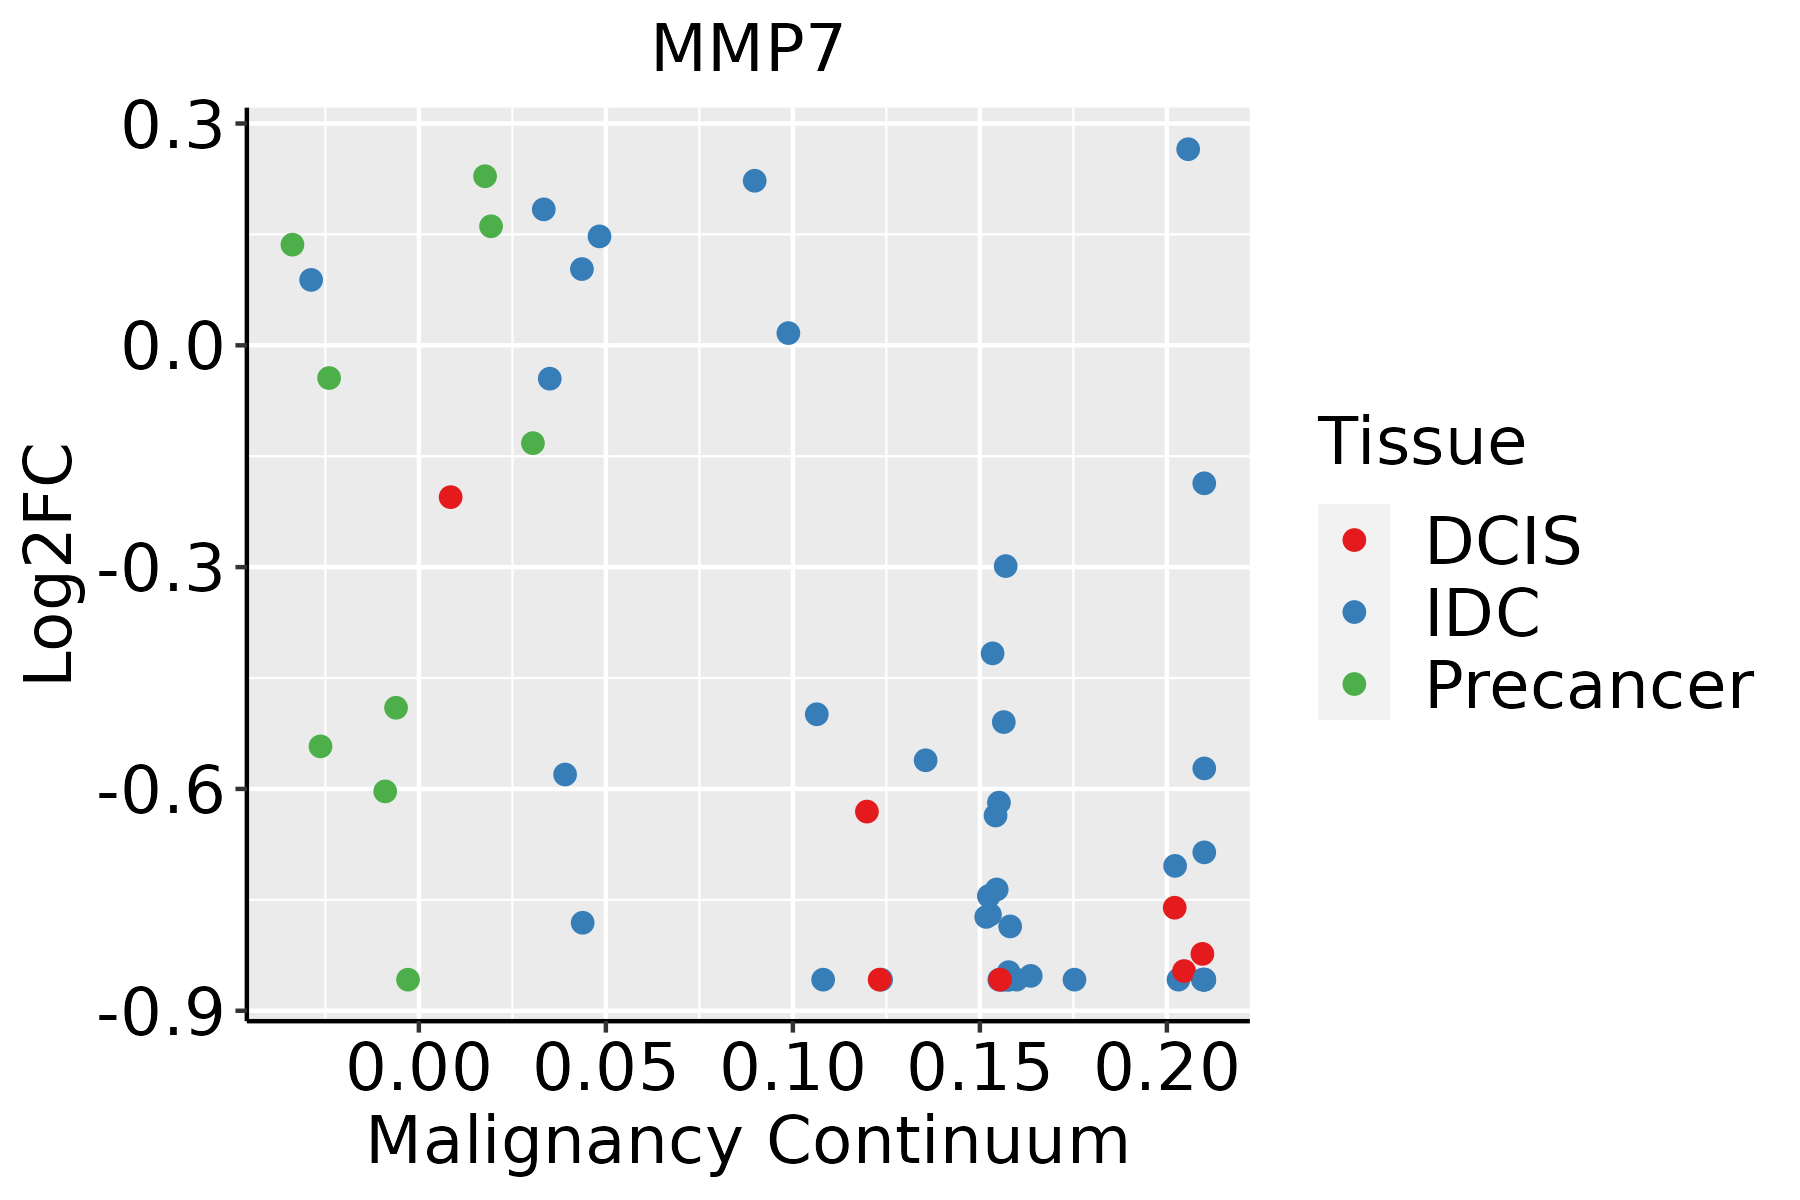 | IDC: Invasive ductal carcinoma |
| DCIS: Ductal carcinoma in situ | ||
| Precancer(BRCA1-mut): Precancerous lesion from BRCA1 mutation carriers | ||
| Cervix |  | CC: Cervix cancer |
| HSIL_HPV: HPV-infected high-grade squamous intraepithelial lesions | ||
| N_HPV: HPV-infected normal cervix | ||
| Colorectum (GSE201348) |  | FAP: Familial adenomatous polyposis |
| CRC: Colorectal cancer | ||
| Colorectum (HTA11) |  | AD: Adenomas |
| SER: Sessile serrated lesions | ||
| MSI-H: Microsatellite-high colorectal cancer | ||
| MSS: Microsatellite stable colorectal cancer | ||
| Endometrium | 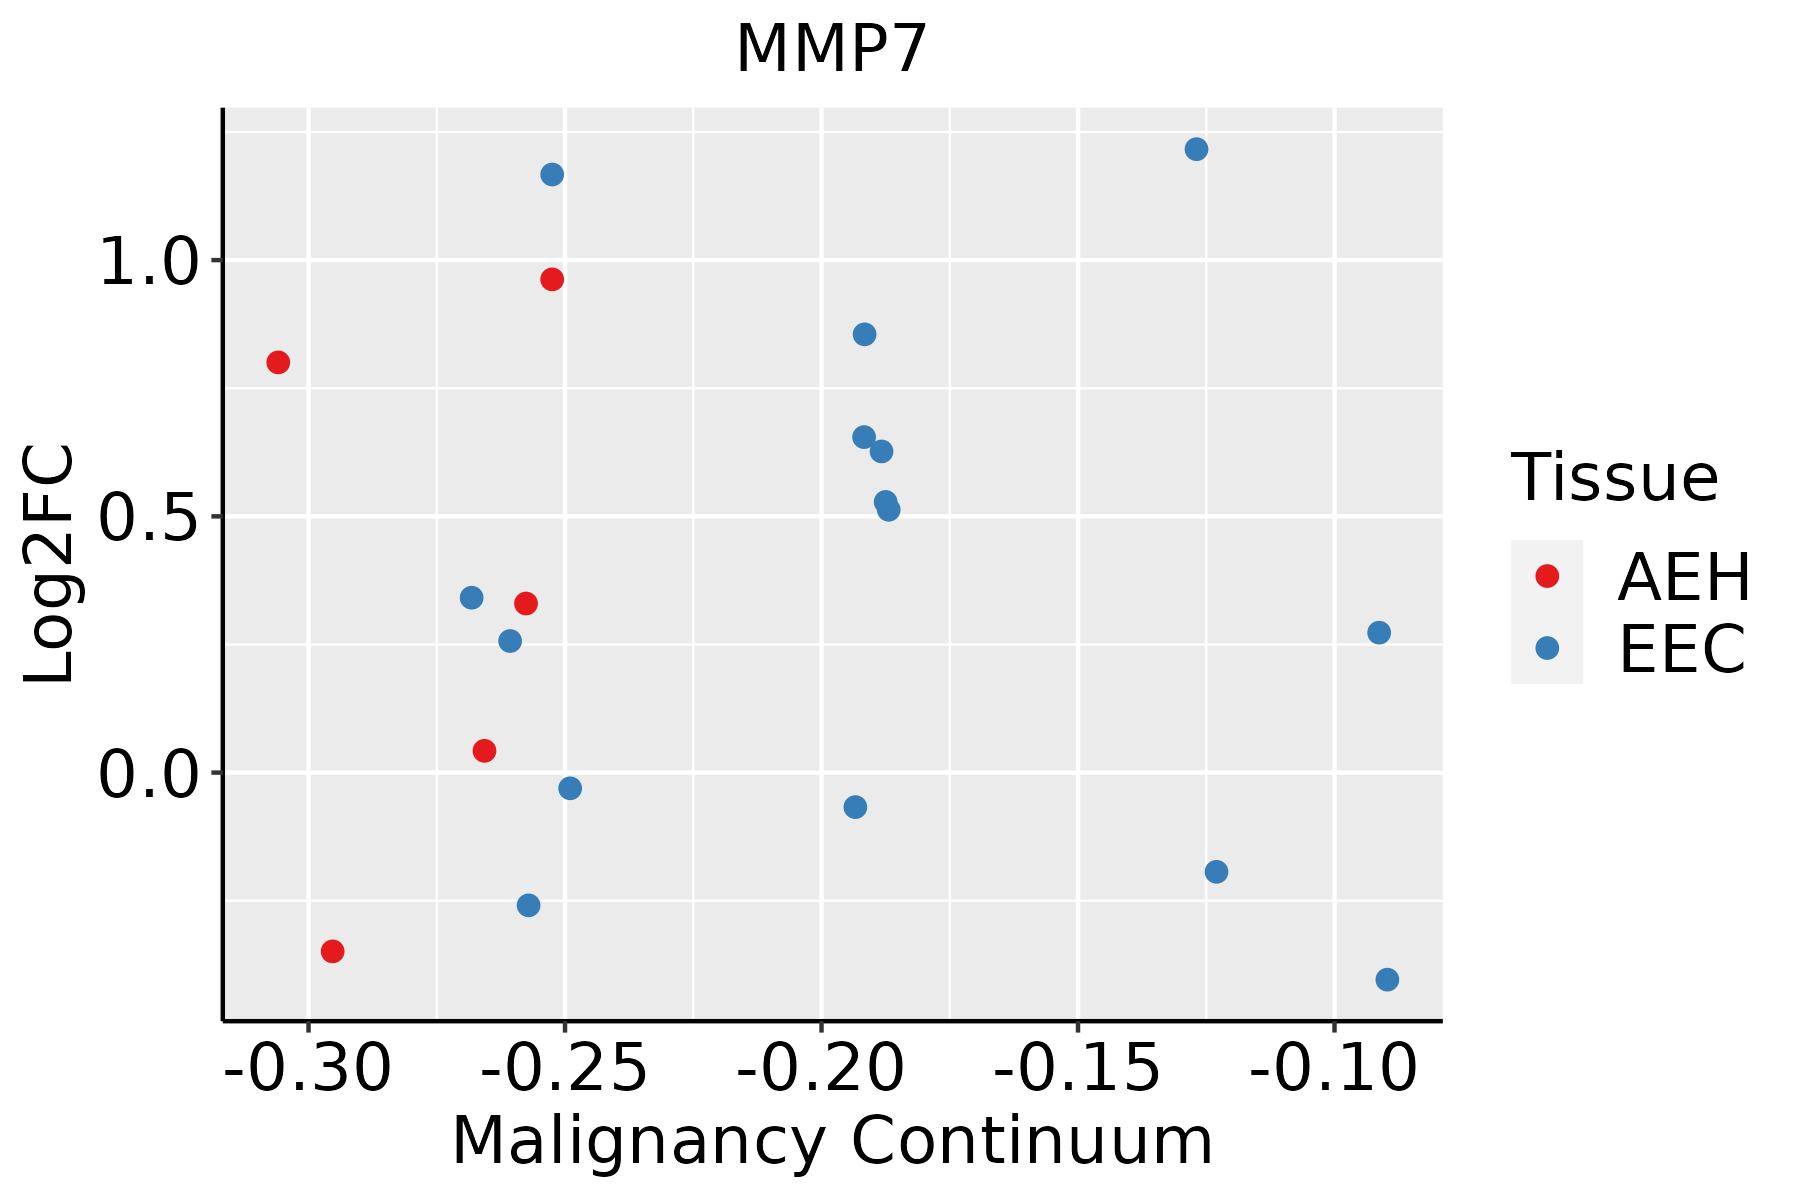 | AEH: Atypical endometrial hyperplasia |
| EEC: Endometrioid Cancer | ||
| Esophagus |  | ESCC: Esophageal squamous cell carcinoma |
| HGIN: High-grade intraepithelial neoplasias | ||
| LGIN: Low-grade intraepithelial neoplasias | ||
| GC |  | CAG: Chronic atrophic gastritis |
| CAG with IM: Chronic atrophic gastritis with intestinal metaplasia | ||
| CSG: Chronic superficial gastritis | ||
| GC: Gastric cancer | ||
| SIM: Severe intestinal metaplasia | ||
| WIM: Wild intestinal metaplasia | ||
| Liver | 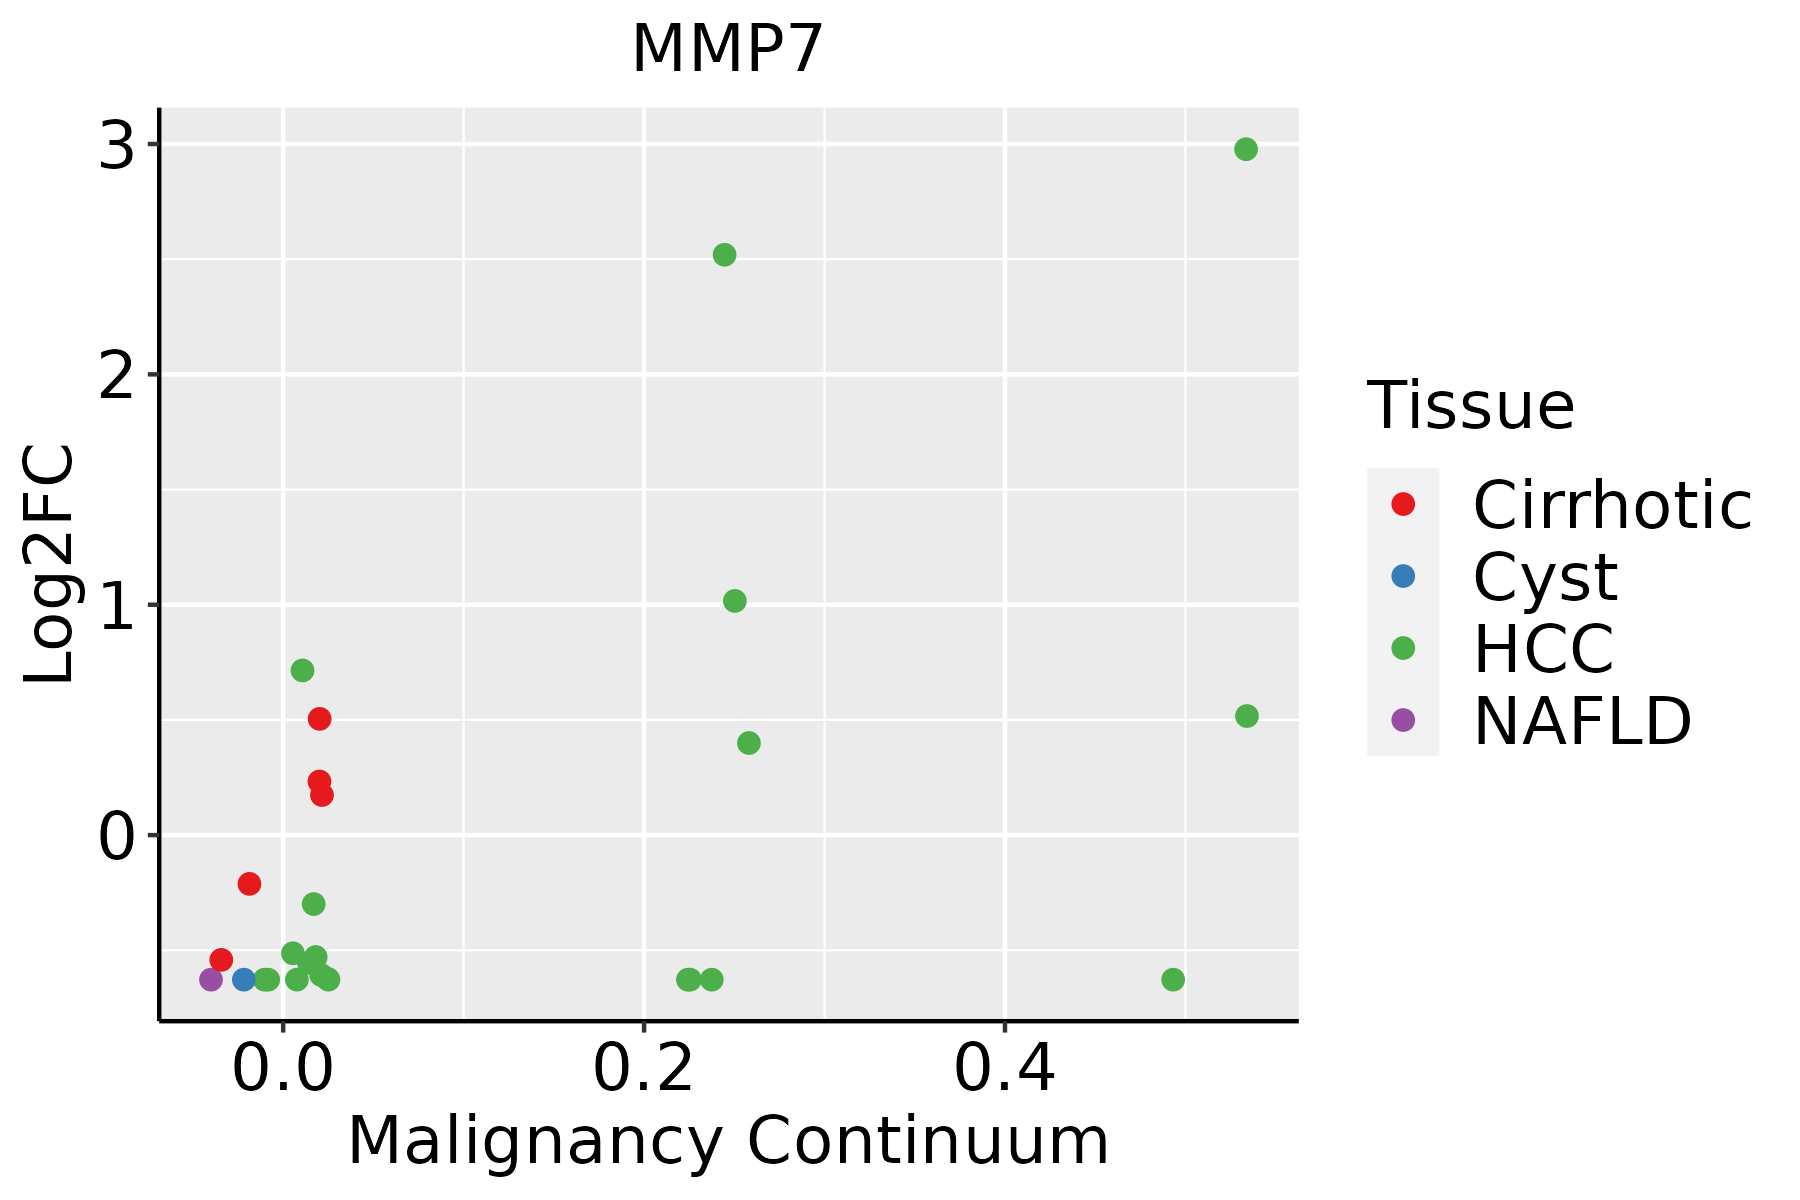 | HCC: Hepatocellular carcinoma |
| NAFLD: Non-alcoholic fatty liver disease | ||
| Oral Cavity |  | EOLP: Erosive Oral lichen planus |
| LP: leukoplakia | ||
| NEOLP: Non-erosive oral lichen planus | ||
| OSCC: Oral squamous cell carcinoma | ||
| Prostate | 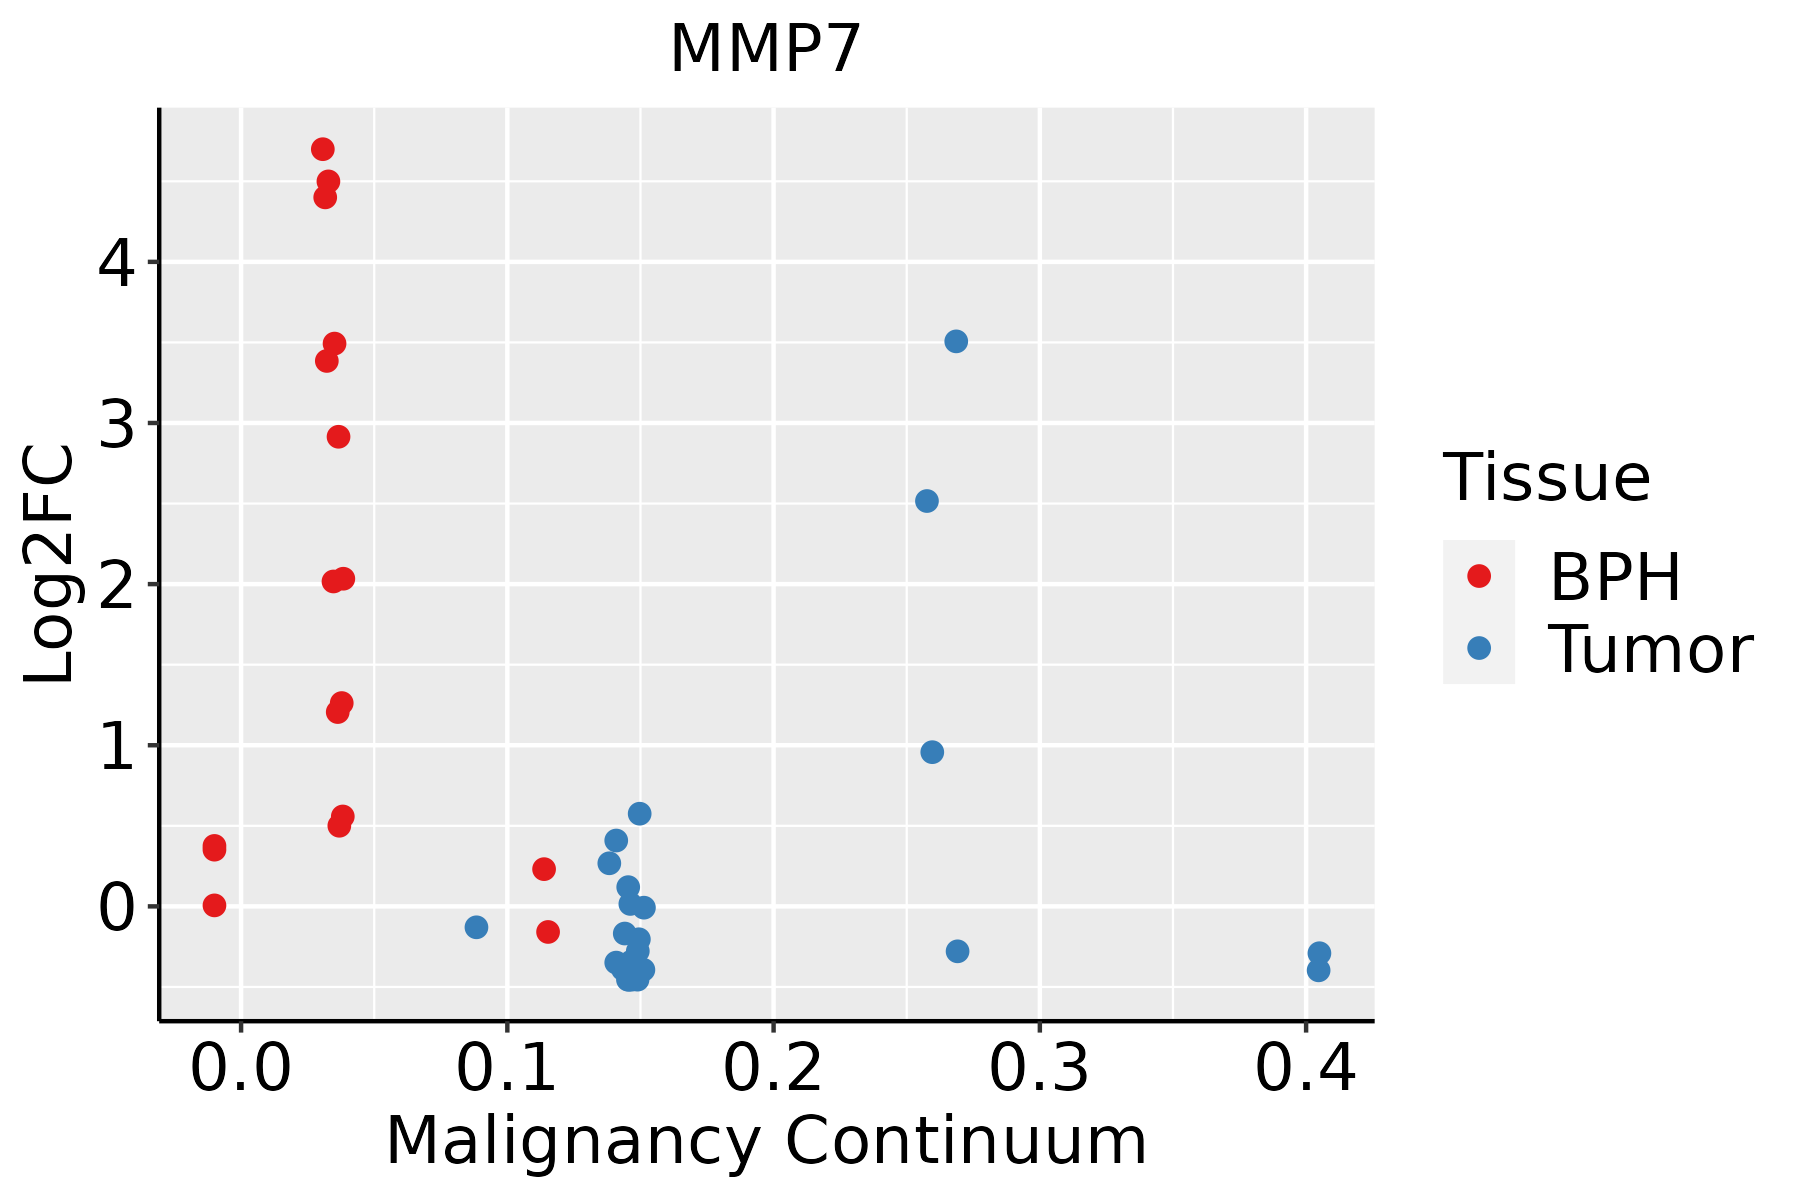 | BPH: Benign Prostatic Hyperplasia |
| ∗log2FC in expression of this searched gene in stem-like cells from each diseased tissue sample relative to stem-like cells in normal samples in each tissue plotted against the malignancy continuum. Samples are colored based on if they are from different disease stage. |
Top |
Malignant transformation related pathway analysis |
| Find out the enriched GO biological processes and KEGG pathways involved in transition from healthy to precancer to cancer |
| Tissue | Disease Stage | Enriched GO biological Processes |
| Colorectum | AD |  |
| Colorectum | SER |  |
| Colorectum | MSS |  |
| Colorectum | MSI-H |  |
| Colorectum | FAP |  |
| ∗Top 15 enriched GO BP terms are showed in the bar plot of each disease state in each tissue. Each row represents a significant GO biological process which is colored according to the -log10(p.adjust). |
| Page: 1 2 3 4 5 6 7 8 9 |
| GO ID | Tissue | Disease Stage | Description | Gene Ratio | Bg Ratio | pvalue | p.adjust | Count |
| GO:010400419 | Esophagus | ESCC | cellular response to environmental stimulus | 206/8552 | 331/18723 | 7.52e-10 | 1.88e-08 | 206 |
| GO:000756820 | Esophagus | ESCC | aging | 201/8552 | 339/18723 | 2.64e-07 | 3.94e-06 | 201 |
| GO:00301984 | Esophagus | ESCC | extracellular matrix organization | 171/8552 | 301/18723 | 6.08e-05 | 4.67e-04 | 171 |
| GO:00430624 | Esophagus | ESCC | extracellular structure organization | 171/8552 | 302/18723 | 7.73e-05 | 5.76e-04 | 171 |
| GO:00452294 | Esophagus | ESCC | external encapsulating structure organization | 172/8552 | 304/18723 | 7.80e-05 | 5.80e-04 | 172 |
| GO:00712606 | Esophagus | ESCC | cellular response to mechanical stimulus | 54/8552 | 81/18723 | 1.09e-04 | 7.64e-04 | 54 |
| GO:000961216 | Esophagus | ESCC | response to mechanical stimulus | 124/8552 | 216/18723 | 3.30e-04 | 1.94e-03 | 124 |
| GO:00065095 | Esophagus | ESCC | membrane protein ectodomain proteolysis | 31/8552 | 43/18723 | 4.04e-04 | 2.30e-03 | 31 |
| GO:00336195 | Esophagus | ESCC | membrane protein proteolysis | 39/8552 | 57/18723 | 4.34e-04 | 2.44e-03 | 39 |
| GO:004851118 | Esophagus | ESCC | rhythmic process | 164/8552 | 298/18723 | 6.80e-04 | 3.57e-03 | 164 |
| GO:00601357 | Esophagus | ESCC | maternal process involved in female pregnancy | 40/8552 | 62/18723 | 2.14e-03 | 9.54e-03 | 40 |
| GO:00329631 | Esophagus | ESCC | collagen metabolic process | 62/8552 | 104/18723 | 2.90e-03 | 1.22e-02 | 62 |
| GO:00226172 | Esophagus | ESCC | extracellular matrix disassembly | 39/8552 | 63/18723 | 6.92e-03 | 2.52e-02 | 39 |
| GO:00224117 | Liver | Cirrhotic | cellular component disassembly | 182/4634 | 443/18723 | 1.59e-14 | 1.54e-12 | 182 |
| GO:003166712 | Liver | Cirrhotic | response to nutrient levels | 174/4634 | 474/18723 | 3.08e-09 | 1.27e-07 | 174 |
| GO:007149612 | Liver | Cirrhotic | cellular response to external stimulus | 123/4634 | 320/18723 | 3.27e-08 | 1.10e-06 | 123 |
| GO:00336192 | Liver | Cirrhotic | membrane protein proteolysis | 31/4634 | 57/18723 | 1.55e-06 | 3.02e-05 | 31 |
| GO:00065092 | Liver | Cirrhotic | membrane protein ectodomain proteolysis | 24/4634 | 43/18723 | 1.30e-05 | 1.82e-04 | 24 |
| GO:007121411 | Liver | Cirrhotic | cellular response to abiotic stimulus | 115/4634 | 331/18723 | 2.62e-05 | 3.38e-04 | 115 |
| GO:010400411 | Liver | Cirrhotic | cellular response to environmental stimulus | 115/4634 | 331/18723 | 2.62e-05 | 3.38e-04 | 115 |
| Page: 1 2 3 4 5 6 7 8 9 10 11 |
| Pathway ID | Tissue | Disease Stage | Description | Gene Ratio | Bg Ratio | pvalue | p.adjust | qvalue | Count |
| hsa0516618 | Breast | Precancer | Human T-cell leukemia virus 1 infection | 33/684 | 222/8465 | 4.29e-04 | 3.31e-03 | 2.53e-03 | 33 |
| hsa0516619 | Breast | Precancer | Human T-cell leukemia virus 1 infection | 33/684 | 222/8465 | 4.29e-04 | 3.31e-03 | 2.53e-03 | 33 |
| hsa0516624 | Breast | IDC | Human T-cell leukemia virus 1 infection | 40/867 | 222/8465 | 2.52e-04 | 2.21e-03 | 1.66e-03 | 40 |
| hsa0516634 | Breast | IDC | Human T-cell leukemia virus 1 infection | 40/867 | 222/8465 | 2.52e-04 | 2.21e-03 | 1.66e-03 | 40 |
| hsa0516642 | Breast | DCIS | Human T-cell leukemia virus 1 infection | 41/846 | 222/8465 | 7.03e-05 | 6.88e-04 | 5.07e-04 | 41 |
| hsa0516652 | Breast | DCIS | Human T-cell leukemia virus 1 infection | 41/846 | 222/8465 | 7.03e-05 | 6.88e-04 | 5.07e-04 | 41 |
| hsa0516620 | Cervix | CC | Human T-cell leukemia virus 1 infection | 61/1267 | 222/8465 | 8.13e-07 | 7.98e-06 | 4.72e-06 | 61 |
| hsa043109 | Cervix | CC | Wnt signaling pathway | 43/1267 | 171/8465 | 3.03e-04 | 1.64e-03 | 9.68e-04 | 43 |
| hsa05166110 | Cervix | CC | Human T-cell leukemia virus 1 infection | 61/1267 | 222/8465 | 8.13e-07 | 7.98e-06 | 4.72e-06 | 61 |
| hsa0431012 | Cervix | CC | Wnt signaling pathway | 43/1267 | 171/8465 | 3.03e-04 | 1.64e-03 | 9.68e-04 | 43 |
| hsa0516625 | Cervix | HSIL_HPV | Human T-cell leukemia virus 1 infection | 25/459 | 222/8465 | 3.95e-04 | 3.49e-03 | 2.82e-03 | 25 |
| hsa0516635 | Cervix | HSIL_HPV | Human T-cell leukemia virus 1 infection | 25/459 | 222/8465 | 3.95e-04 | 3.49e-03 | 2.82e-03 | 25 |
| hsa0516643 | Cervix | N_HPV | Human T-cell leukemia virus 1 infection | 22/349 | 222/8465 | 1.17e-04 | 1.18e-03 | 9.23e-04 | 22 |
| hsa0516653 | Cervix | N_HPV | Human T-cell leukemia virus 1 infection | 22/349 | 222/8465 | 1.17e-04 | 1.18e-03 | 9.23e-04 | 22 |
| hsa05166 | Colorectum | AD | Human T-cell leukemia virus 1 infection | 72/2092 | 222/8465 | 5.24e-03 | 2.44e-02 | 1.55e-02 | 72 |
| hsa04310 | Colorectum | AD | Wnt signaling pathway | 56/2092 | 171/8465 | 1.03e-02 | 3.93e-02 | 2.51e-02 | 56 |
| hsa051661 | Colorectum | AD | Human T-cell leukemia virus 1 infection | 72/2092 | 222/8465 | 5.24e-03 | 2.44e-02 | 1.55e-02 | 72 |
| hsa043101 | Colorectum | AD | Wnt signaling pathway | 56/2092 | 171/8465 | 1.03e-02 | 3.93e-02 | 2.51e-02 | 56 |
| hsa0516626 | Endometrium | AEH | Human T-cell leukemia virus 1 infection | 50/1197 | 222/8465 | 4.30e-04 | 3.11e-03 | 2.27e-03 | 50 |
| hsa0431010 | Endometrium | AEH | Wnt signaling pathway | 37/1197 | 171/8465 | 4.68e-03 | 2.53e-02 | 1.86e-02 | 37 |
| Page: 1 2 3 |
Top |
Cell-cell communication analysis |
| Identification of potential cell-cell interactions between two cell types and their ligand-receptor pairs for different disease states |
| Ligand | Receptor | LRpair | Pathway | Tissue | Disease Stage |
| Page: 1 |
Top |
Single-cell gene regulatory network inference analysis |
| Find out the significant the regulons (TFs) and the target genes of each regulon across cell types for different disease states |
| TF | Cell Type | Tissue | Disease Stage | Target Gene | RSS | Regulon Activity |
| ∗The dot plots of a searched regulon are shown for all cell subpopulations in each disease state of each tissue based on the regulon specific score inferred using pySCENIC and by calculating the average expression. |
| Page: 1 |
Top |
Somatic mutation of malignant transformation related genes |
| Annotation of somatic variants for genes involved in malignant transformation |
| Hugo Symbol | Variant Class | Variant Classification | dbSNP RS | HGVSc | HGVSp | HGVSp Short | SWISSPROT | BIOTYPE | SIFT | PolyPhen | Tumor Sample Barcode | Tissue | Histology | Sex | Age | Stage | Therapy Types | Drugs | Outcome |
| MMP7 | deletion | Frame_Shift_Del | novel | c.513delN | p.Pro172GlnfsTer33 | p.P172Qfs*33 | P09237 | protein_coding | TCGA-D8-A27V-01 | Breast | breast invasive carcinoma | Female | <65 | I/II | Hormone Therapy | tamoxiphen | SD | ||
| MMP7 | SNV | Missense_Mutation | rs764896028 | c.195N>A | p.Phe65Leu | p.F65L | P09237 | protein_coding | deleterious(0.01) | probably_damaging(0.989) | TCGA-FU-A3HZ-01 | Cervix | cervical & endocervical cancer | Female | <65 | I/II | Chemotherapy | cisplatin | CR |
| MMP7 | SNV | Missense_Mutation | rs751581884 | c.479G>A | p.Arg160Gln | p.R160Q | P09237 | protein_coding | tolerated(0.3) | probably_damaging(0.957) | TCGA-AA-3811-01 | Colorectum | colon adenocarcinoma | Female | >=65 | III/IV | Unknown | Unknown | PD |
| MMP7 | SNV | Missense_Mutation | novel | c.749N>G | p.Asp250Gly | p.D250G | P09237 | protein_coding | deleterious(0) | probably_damaging(0.999) | TCGA-AA-3950-01 | Colorectum | colon adenocarcinoma | Female | >=65 | I/II | Unknown | Unknown | SD |
| MMP7 | SNV | Missense_Mutation | novel | c.170N>T | p.Ala57Val | p.A57V | P09237 | protein_coding | tolerated(0.25) | benign(0.025) | TCGA-AA-3966-01 | Colorectum | colon adenocarcinoma | Female | >=65 | I/II | Unknown | Unknown | SD |
| MMP7 | SNV | Missense_Mutation | novel | c.104C>T | p.Ala35Val | p.A35V | P09237 | protein_coding | tolerated(0.59) | probably_damaging(0.993) | TCGA-AZ-4315-01 | Colorectum | colon adenocarcinoma | Male | <65 | I/II | Unknown | Unknown | SD |
| MMP7 | SNV | Missense_Mutation | c.76G>A | p.Gly26Ser | p.G26S | P09237 | protein_coding | tolerated(0.83) | benign(0.024) | TCGA-AG-A00H-01 | Colorectum | rectum adenocarcinoma | Male | >=65 | I/II | Chemotherapy | 5-fluorouracil | PD | |
| MMP7 | SNV | Missense_Mutation | rs145006821 | c.232N>A | p.Val78Ile | p.V78I | P09237 | protein_coding | tolerated(0.23) | benign(0.003) | TCGA-AG-A02N-01 | Colorectum | rectum adenocarcinoma | Male | >=65 | I/II | Chemotherapy | folinic | CR |
| MMP7 | SNV | Missense_Mutation | novel | c.148N>G | p.Lys50Glu | p.K50E | P09237 | protein_coding | deleterious(0.04) | benign(0.041) | TCGA-A5-A0G2-01 | Endometrium | uterine corpus endometrioid carcinoma | Female | <65 | III/IV | Unknown | Unknown | SD |
| MMP7 | SNV | Missense_Mutation | novel | c.142G>C | p.Glu48Gln | p.E48Q | P09237 | protein_coding | tolerated(0.08) | benign(0.057) | TCGA-AP-A0LM-01 | Endometrium | uterine corpus endometrioid carcinoma | Female | <65 | III/IV | Chemotherapy | cisplatin | SD |
| Page: 1 2 3 4 |
Top |
Related drugs of malignant transformation related genes |
| Identification of chemicals and drugs interact with genes involved in malignant transfromation |
| (DGIdb 4.0) |
| Entrez ID | Symbol | Category | Interaction Types | Drug Claim Name | Drug Name | PMIDs |
| 4316 | MMP7 | NEUTRAL ZINC METALLOPEPTIDASE, DRUGGABLE GENOME, ENZYME, PROTEASE | inhibitor | 252166768 | ||
| 4316 | MMP7 | NEUTRAL ZINC METALLOPEPTIDASE, DRUGGABLE GENOME, ENZYME, PROTEASE | inhibitor | 178103078 | DOXYCYCLINE | |
| 4316 | MMP7 | NEUTRAL ZINC METALLOPEPTIDASE, DRUGGABLE GENOME, ENZYME, PROTEASE | inhibitor | CHEMBL1200567 | DOXYCYCLINE HYCLATE | |
| 4316 | MMP7 | NEUTRAL ZINC METALLOPEPTIDASE, DRUGGABLE GENOME, ENZYME, PROTEASE | inhibitor | CHEMBL1200699 | DOXYCYCLINE | |
| 4316 | MMP7 | NEUTRAL ZINC METALLOPEPTIDASE, DRUGGABLE GENOME, ENZYME, PROTEASE | inhibitor | 252166829 | ||
| 4316 | MMP7 | NEUTRAL ZINC METALLOPEPTIDASE, DRUGGABLE GENOME, ENZYME, PROTEASE | Marimastat | MARIMASTAT | ||
| 4316 | MMP7 | NEUTRAL ZINC METALLOPEPTIDASE, DRUGGABLE GENOME, ENZYME, PROTEASE | Prinomastat | PRINOMASTAT | ||
| 4316 | MMP7 | NEUTRAL ZINC METALLOPEPTIDASE, DRUGGABLE GENOME, ENZYME, PROTEASE | inhibitor | CHEMBL2364574 | DOXYCYCLINE CALCIUM | |
| 4316 | MMP7 | NEUTRAL ZINC METALLOPEPTIDASE, DRUGGABLE GENOME, ENZYME, PROTEASE | inhibitor | 178101905 | MARIMASTAT |
| Page: 1 |

Copyright 2023-Present -The University of Texas Health Science Center at Houston |