
|
|||||
|
 | |
| |
| |
| |
| |
| |
|
Gene: MISP |
Gene summary for MISP |
| Gene information | Species | Human | Gene symbol | MISP | Gene ID | 126353 |
| Gene name | mitotic spindle positioning | |
| Gene Alias | C19orf21 | |
| Cytomap | 19p13.3 | |
| Gene Type | protein-coding | GO ID | GO:0000132 | UniProtAcc | Q8IVT2 |
Top |
Malignant transformation analysis |
| Identification of the aberrant gene expression in precancerous and cancerous lesions by comparing the gene expression of stem-like cells in diseased tissues with normal stem cells |
| Entrez ID | Symbol | Replicates | Species | Organ | Tissue | Adj P-value | Log2FC | Malignancy |
| 126353 | MISP | HTA11_3410_2000001011 | Human | Colorectum | AD | 2.56e-03 | 3.48e-02 | 0.0155 |
| 126353 | MISP | HTA11_2487_2000001011 | Human | Colorectum | SER | 1.66e-23 | 1.20e+00 | -0.1808 |
| 126353 | MISP | HTA11_2951_2000001011 | Human | Colorectum | AD | 1.39e-03 | 3.18e-01 | 0.0216 |
| 126353 | MISP | HTA11_1938_2000001011 | Human | Colorectum | AD | 2.55e-12 | 5.19e-01 | -0.0811 |
| 126353 | MISP | HTA11_347_2000001011 | Human | Colorectum | AD | 8.85e-11 | 3.75e-01 | -0.1954 |
| 126353 | MISP | HTA11_411_2000001011 | Human | Colorectum | SER | 7.54e-09 | 1.74e+00 | -0.2602 |
| 126353 | MISP | HTA11_2112_2000001011 | Human | Colorectum | SER | 2.09e-17 | 1.73e+00 | -0.2196 |
| 126353 | MISP | HTA11_3361_2000001011 | Human | Colorectum | AD | 2.81e-11 | 6.91e-01 | -0.1207 |
| 126353 | MISP | HTA11_83_2000001011 | Human | Colorectum | SER | 2.99e-10 | 6.33e-01 | -0.1526 |
| 126353 | MISP | HTA11_696_2000001011 | Human | Colorectum | AD | 2.63e-20 | 7.56e-01 | -0.1464 |
| 126353 | MISP | HTA11_866_2000001011 | Human | Colorectum | AD | 1.26e-04 | 3.30e-01 | -0.1001 |
| 126353 | MISP | HTA11_1391_2000001011 | Human | Colorectum | AD | 1.71e-17 | 7.49e-01 | -0.059 |
| 126353 | MISP | HTA11_2992_2000001011 | Human | Colorectum | SER | 3.06e-05 | 8.13e-01 | -0.1706 |
| 126353 | MISP | HTA11_5212_2000001011 | Human | Colorectum | AD | 1.16e-06 | 7.94e-01 | -0.2061 |
| 126353 | MISP | HTA11_546_2000001011 | Human | Colorectum | AD | 2.91e-05 | 2.87e-01 | -0.0842 |
| 126353 | MISP | HTA11_866_3004761011 | Human | Colorectum | AD | 1.86e-06 | 1.37e-01 | 0.096 |
| 126353 | MISP | HTA11_4255_2000001011 | Human | Colorectum | SER | 4.78e-03 | 1.71e-01 | 0.0446 |
| 126353 | MISP | HTA11_8622_2000001021 | Human | Colorectum | SER | 2.43e-02 | 2.83e-01 | 0.0528 |
| 126353 | MISP | HTA11_10711_2000001011 | Human | Colorectum | AD | 9.18e-03 | 3.08e-01 | 0.0338 |
| 126353 | MISP | HTA11_7696_3000711011 | Human | Colorectum | AD | 2.71e-13 | 5.37e-01 | 0.0674 |
| Page: 1 2 3 4 5 6 |
| Tissue | Expression Dynamics | Abbreviation |
| Colorectum (GSE201348) |  | FAP: Familial adenomatous polyposis |
| CRC: Colorectal cancer | ||
| Colorectum (HTA11) |  | AD: Adenomas |
| SER: Sessile serrated lesions | ||
| MSI-H: Microsatellite-high colorectal cancer | ||
| MSS: Microsatellite stable colorectal cancer | ||
| Esophagus |  | ESCC: Esophageal squamous cell carcinoma |
| HGIN: High-grade intraepithelial neoplasias | ||
| LGIN: Low-grade intraepithelial neoplasias | ||
| GC | 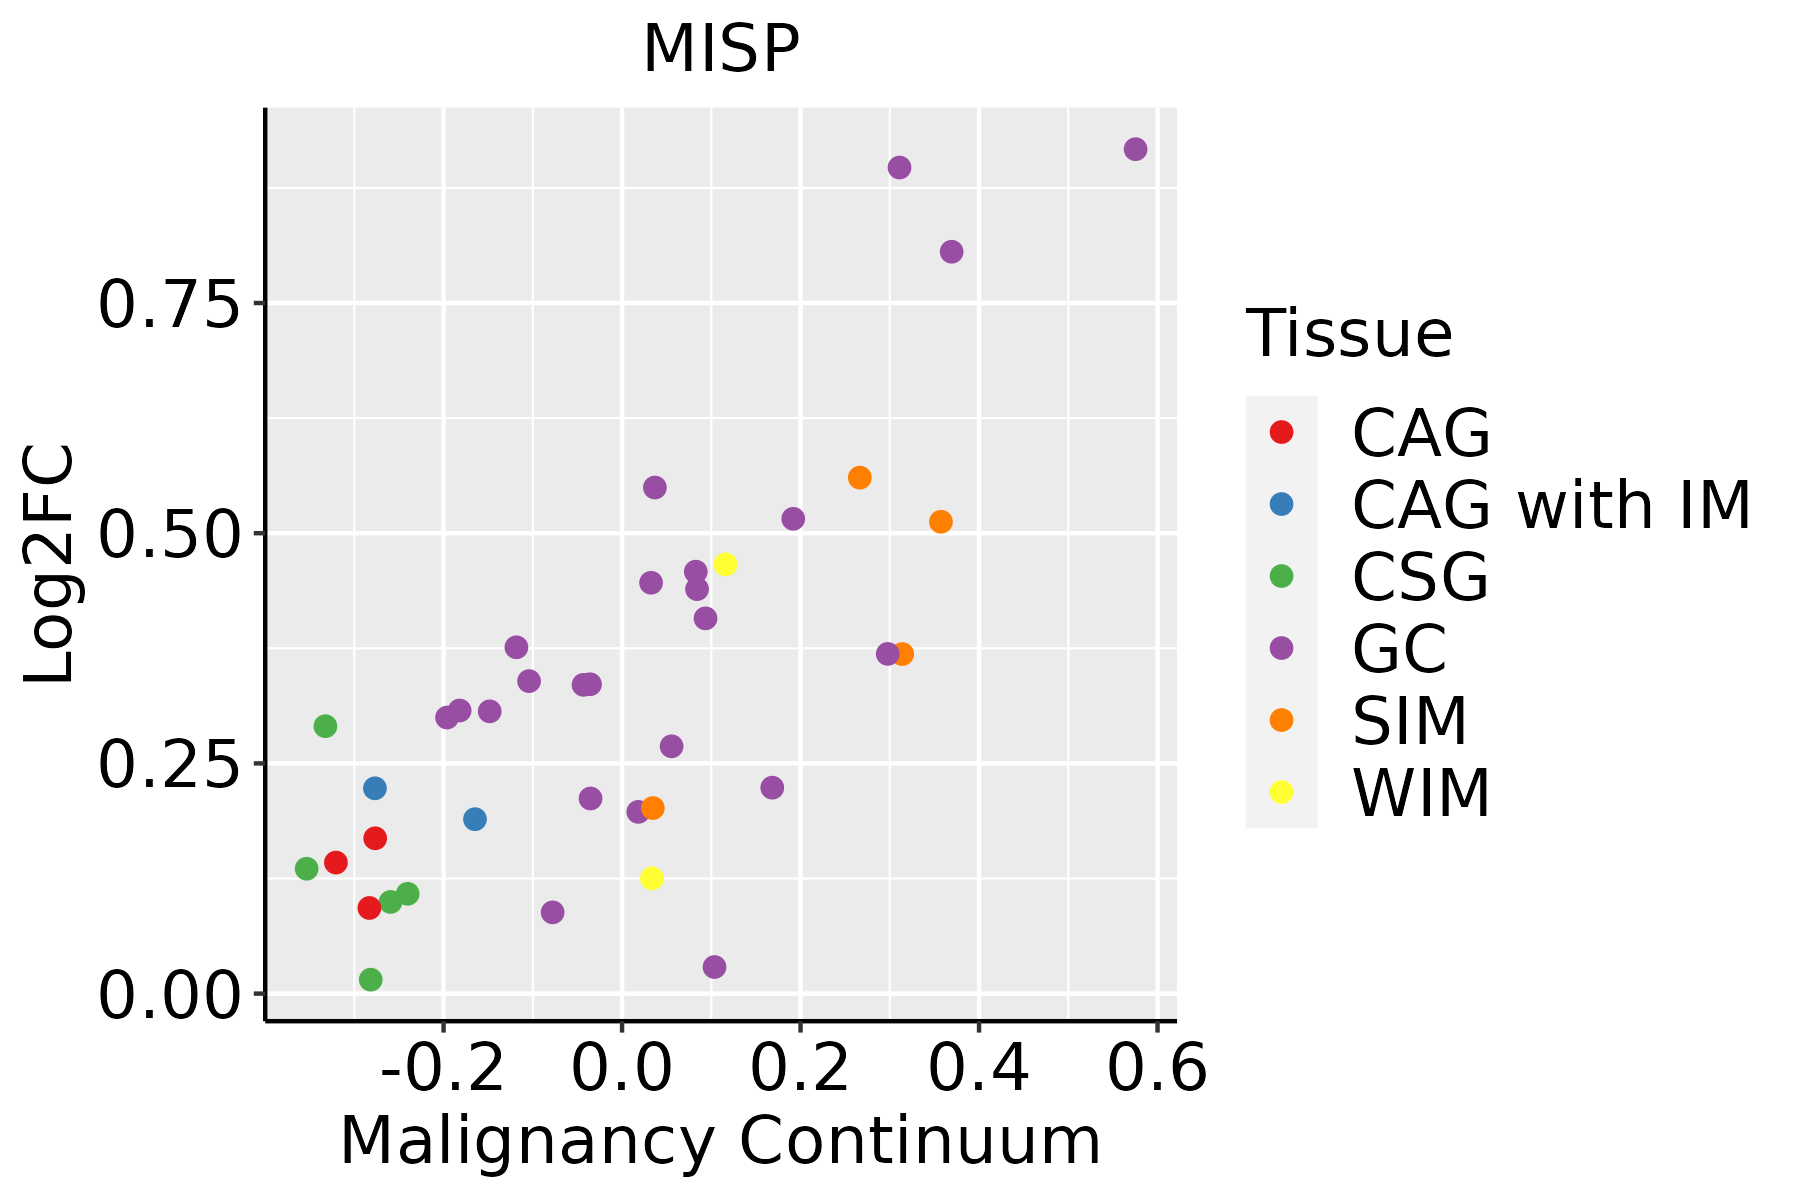 | CAG: Chronic atrophic gastritis |
| CAG with IM: Chronic atrophic gastritis with intestinal metaplasia | ||
| CSG: Chronic superficial gastritis | ||
| GC: Gastric cancer | ||
| SIM: Severe intestinal metaplasia | ||
| WIM: Wild intestinal metaplasia | ||
| Oral Cavity | 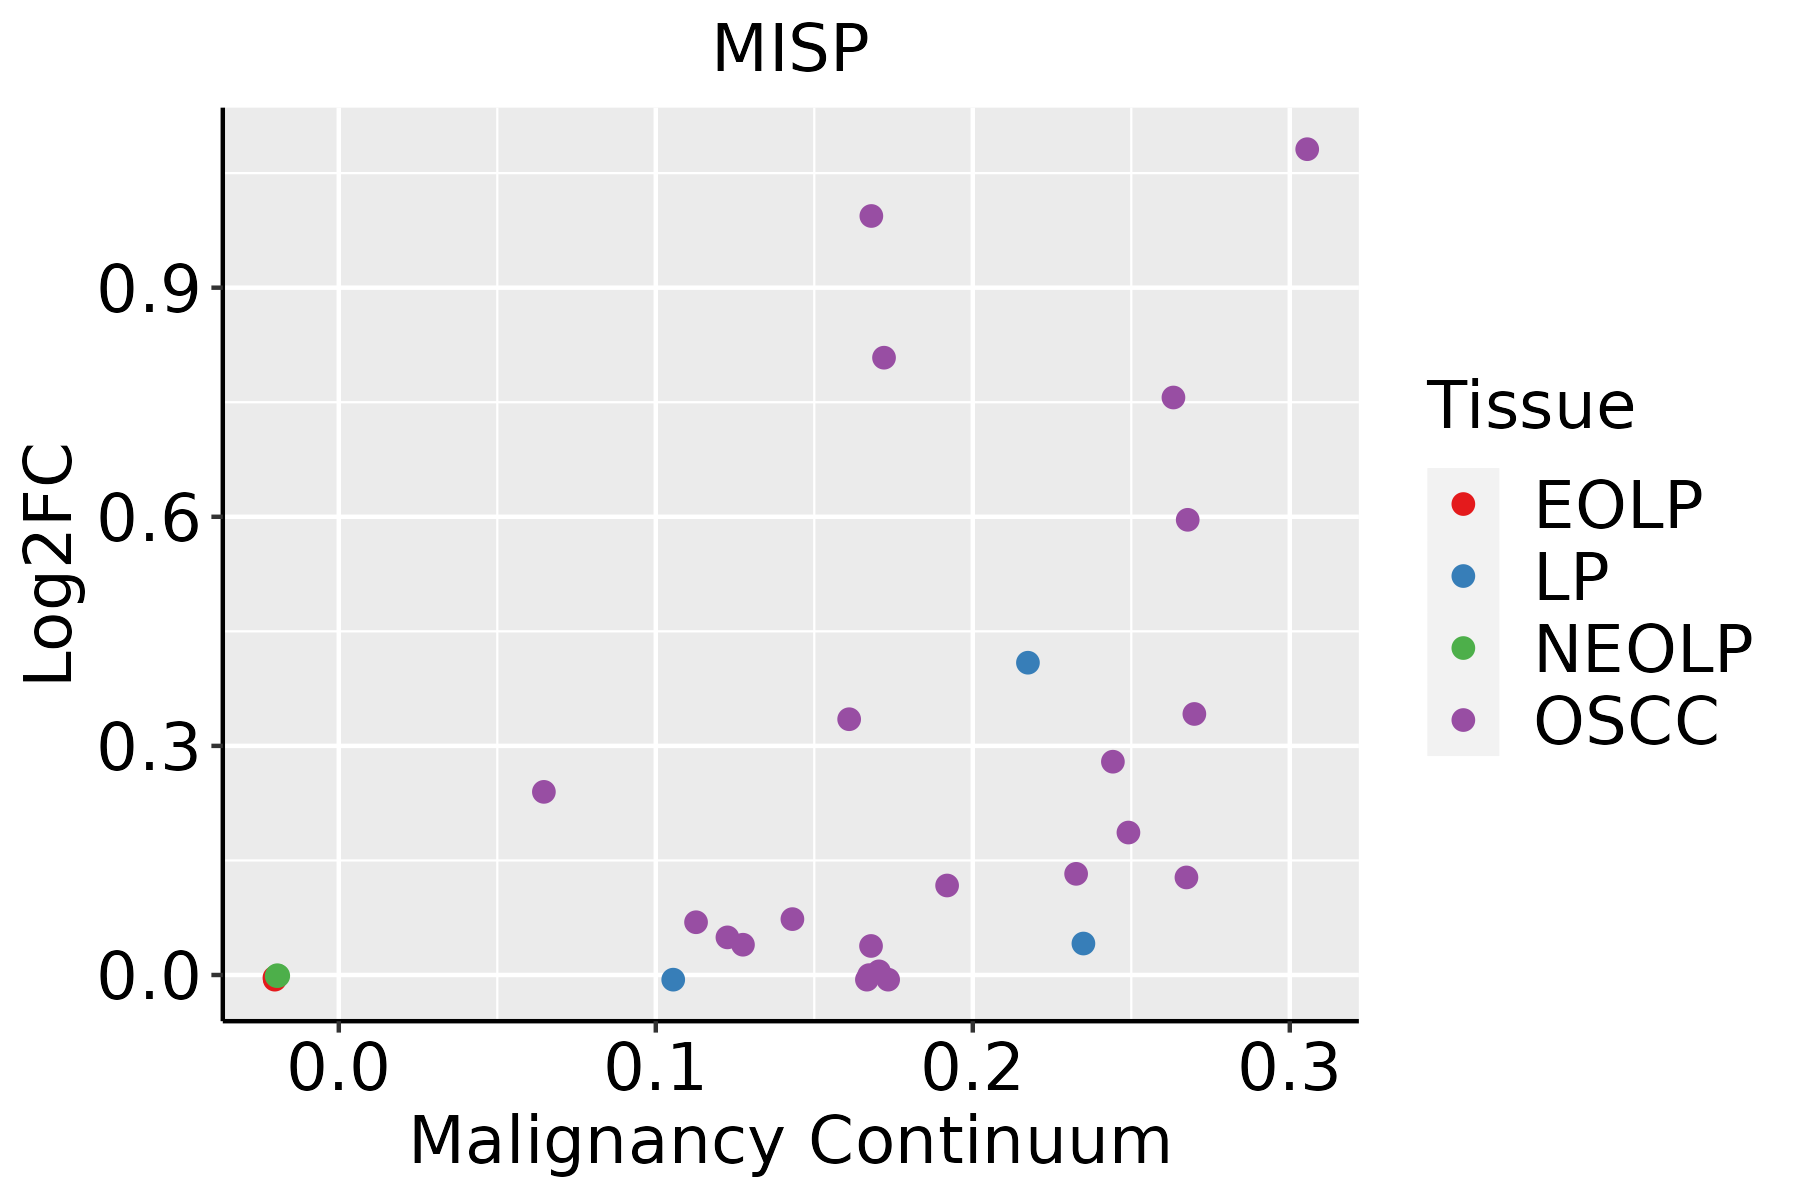 | EOLP: Erosive Oral lichen planus |
| LP: leukoplakia | ||
| NEOLP: Non-erosive oral lichen planus | ||
| OSCC: Oral squamous cell carcinoma | ||
| Skin | 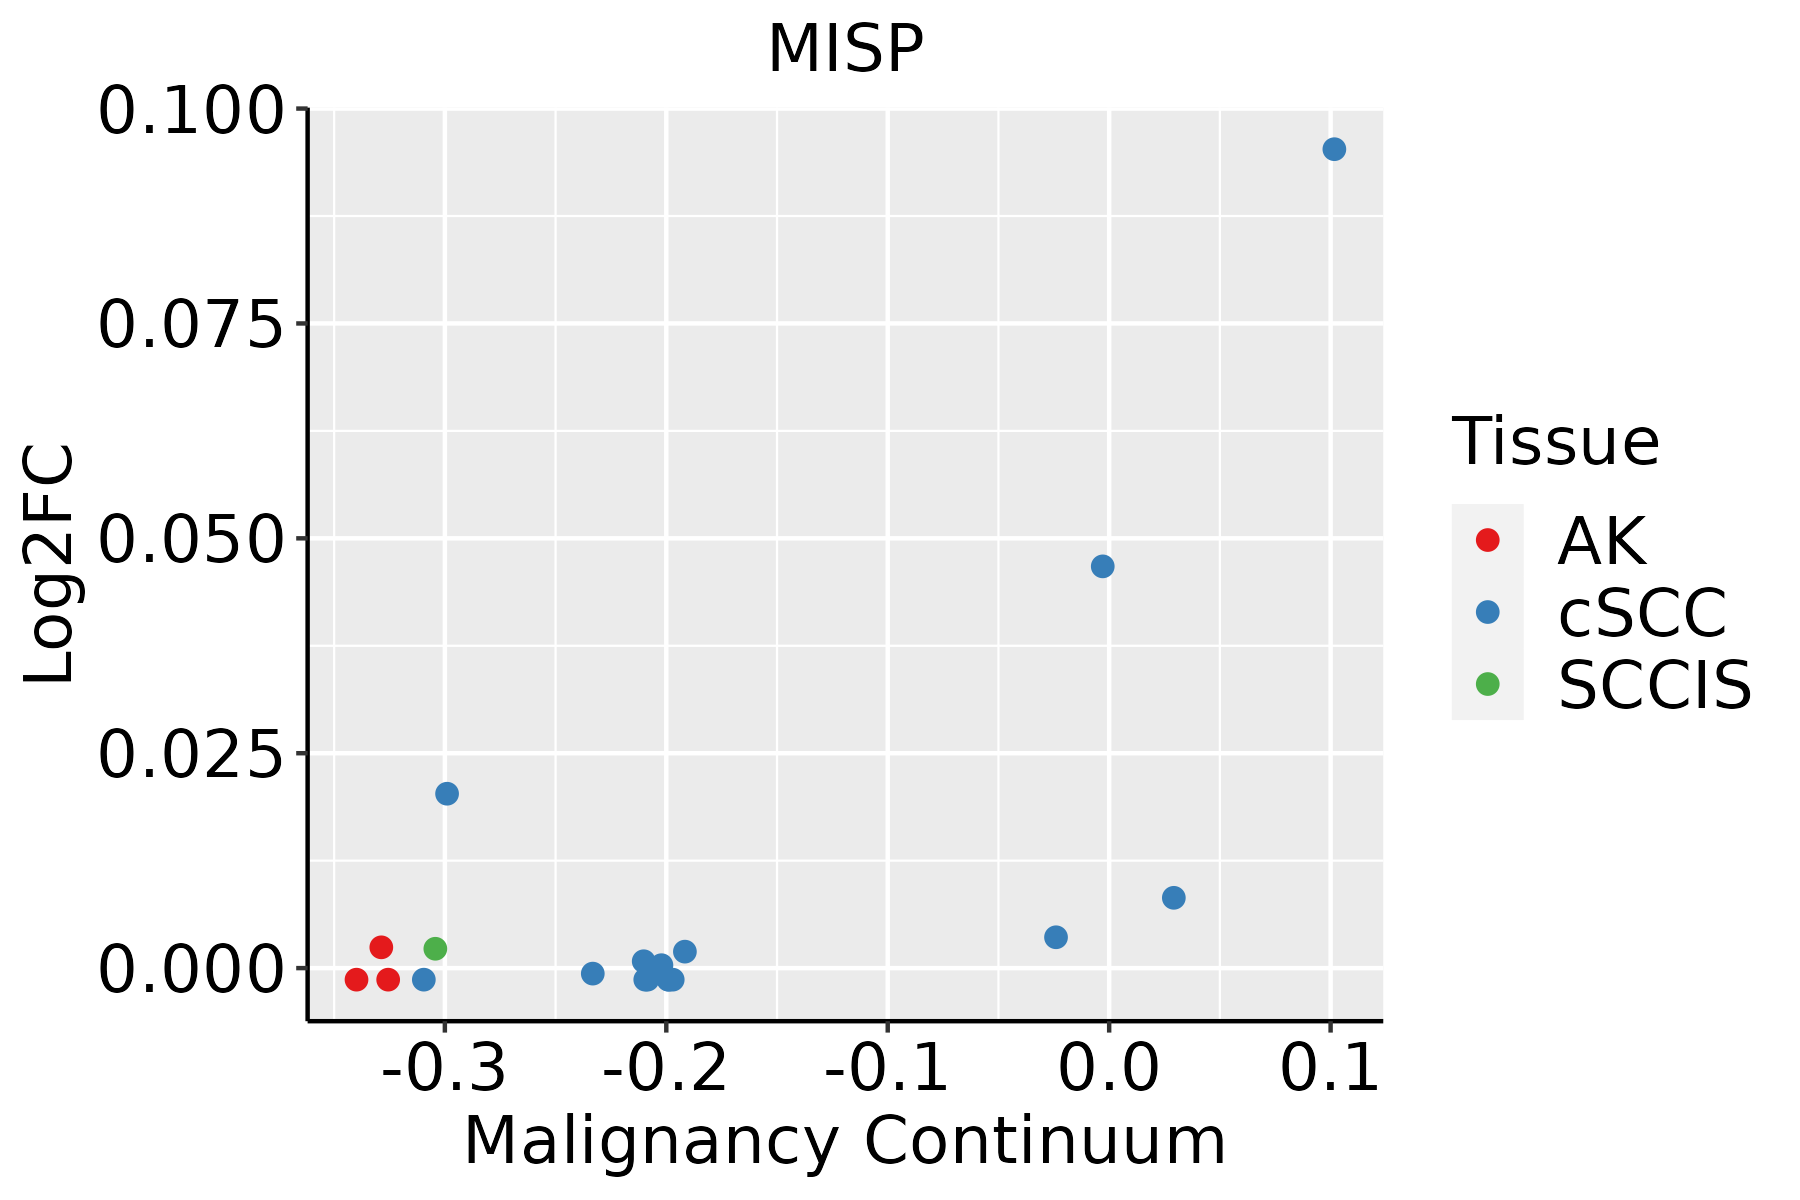 | AK: Actinic keratosis |
| cSCC: Cutaneous squamous cell carcinoma | ||
| SCCIS:squamous cell carcinoma in situ |
| ∗log2FC in expression of this searched gene in stem-like cells from each diseased tissue sample relative to stem-like cells in normal samples in each tissue plotted against the malignancy continuum. Samples are colored based on if they are from different disease stage. |
Top |
Malignant transformation related pathway analysis |
| Find out the enriched GO biological processes and KEGG pathways involved in transition from healthy to precancer to cancer |
| Tissue | Disease Stage | Enriched GO biological Processes |
| Colorectum | AD |  |
| Colorectum | SER |  |
| Colorectum | MSS |  |
| Colorectum | MSI-H |  |
| Colorectum | FAP |  |
| ∗Top 15 enriched GO BP terms are showed in the bar plot of each disease state in each tissue. Each row represents a significant GO biological process which is colored according to the -log10(p.adjust). |
| Page: 1 2 3 4 5 6 7 8 9 |
| GO ID | Tissue | Disease Stage | Description | Gene Ratio | Bg Ratio | pvalue | p.adjust | Count |
| GO:00512942 | Skin | cSCC | establishment of spindle orientation | 17/4864 | 37/18723 | 6.83e-03 | 3.30e-02 | 17 |
| GO:00516604 | Stomach | GC | establishment of centrosome localization | 6/1159 | 10/18723 | 9.40e-06 | 3.19e-04 | 6 |
| GO:00071635 | Stomach | GC | establishment or maintenance of cell polarity | 28/1159 | 218/18723 | 1.98e-04 | 3.37e-03 | 28 |
| GO:00300105 | Stomach | GC | establishment of cell polarity | 20/1159 | 143/18723 | 5.20e-04 | 7.33e-03 | 20 |
| GO:00516423 | Stomach | GC | centrosome localization | 8/1159 | 32/18723 | 5.82e-04 | 7.99e-03 | 8 |
| GO:00618423 | Stomach | GC | microtubule organizing center localization | 8/1159 | 33/18723 | 7.27e-04 | 9.50e-03 | 8 |
| GO:005166011 | Stomach | CAG with IM | establishment of centrosome localization | 6/1050 | 10/18723 | 5.30e-06 | 2.00e-04 | 6 |
| GO:000716311 | Stomach | CAG with IM | establishment or maintenance of cell polarity | 28/1050 | 218/18723 | 3.67e-05 | 1.02e-03 | 28 |
| GO:003001011 | Stomach | CAG with IM | establishment of cell polarity | 20/1050 | 143/18723 | 1.44e-04 | 2.88e-03 | 20 |
| GO:00516421 | Stomach | CAG with IM | centrosome localization | 8/1050 | 32/18723 | 3.00e-04 | 5.12e-03 | 8 |
| GO:006184211 | Stomach | CAG with IM | microtubule organizing center localization | 8/1050 | 33/18723 | 3.76e-04 | 6.04e-03 | 8 |
| GO:005166021 | Stomach | CSG | establishment of centrosome localization | 6/1034 | 10/18723 | 4.85e-06 | 1.91e-04 | 6 |
| GO:000716321 | Stomach | CSG | establishment or maintenance of cell polarity | 28/1034 | 218/18723 | 2.79e-05 | 7.99e-04 | 28 |
| GO:003001021 | Stomach | CSG | establishment of cell polarity | 20/1034 | 143/18723 | 1.17e-04 | 2.50e-03 | 20 |
| GO:00516422 | Stomach | CSG | centrosome localization | 8/1034 | 32/18723 | 2.70e-04 | 4.82e-03 | 8 |
| GO:00618422 | Stomach | CSG | microtubule organizing center localization | 8/1034 | 33/18723 | 3.39e-04 | 5.66e-03 | 8 |
| Page: 1 2 3 4 5 6 |
| Pathway ID | Tissue | Disease Stage | Description | Gene Ratio | Bg Ratio | pvalue | p.adjust | qvalue | Count |
| Page: 1 |
Top |
Cell-cell communication analysis |
| Identification of potential cell-cell interactions between two cell types and their ligand-receptor pairs for different disease states |
| Ligand | Receptor | LRpair | Pathway | Tissue | Disease Stage |
| Page: 1 |
Top |
Single-cell gene regulatory network inference analysis |
| Find out the significant the regulons (TFs) and the target genes of each regulon across cell types for different disease states |
| TF | Cell Type | Tissue | Disease Stage | Target Gene | RSS | Regulon Activity |
| ∗The dot plots of a searched regulon are shown for all cell subpopulations in each disease state of each tissue based on the regulon specific score inferred using pySCENIC and by calculating the average expression. |
| Page: 1 |
Top |
Somatic mutation of malignant transformation related genes |
| Annotation of somatic variants for genes involved in malignant transformation |
| Hugo Symbol | Variant Class | Variant Classification | dbSNP RS | HGVSc | HGVSp | HGVSp Short | SWISSPROT | BIOTYPE | SIFT | PolyPhen | Tumor Sample Barcode | Tissue | Histology | Sex | Age | Stage | Therapy Types | Drugs | Outcome |
| MISP | SNV | Missense_Mutation | rs140196930 | c.1169N>A | p.Arg390Gln | p.R390Q | Q8IVT2 | protein_coding | tolerated(0.14) | benign(0.037) | TCGA-A2-A3KC-01 | Breast | breast invasive carcinoma | Female | <65 | I/II | Chemotherapy | adriamycin | SD |
| MISP | SNV | Missense_Mutation | novel | c.1609A>T | p.Arg537Trp | p.R537W | Q8IVT2 | protein_coding | deleterious(0) | probably_damaging(0.995) | TCGA-A8-A08R-01 | Breast | breast invasive carcinoma | Female | <65 | I/II | Unknown | Unknown | SD |
| MISP | SNV | Missense_Mutation | rs775079741 | c.1225G>A | p.Asp409Asn | p.D409N | Q8IVT2 | protein_coding | tolerated(0.22) | benign(0.027) | TCGA-LL-A5YN-01 | Breast | breast invasive carcinoma | Female | <65 | I/II | Chemotherapy | carboplatin | SD |
| MISP | insertion | In_Frame_Ins | novel | c.1988_1989insTAGGAA | p.Ala663_Met664insArgAsn | p.A663_M664insRN | Q8IVT2 | protein_coding | TCGA-A8-A0A4-01 | Breast | breast invasive carcinoma | Female | >=65 | I/II | Hormone Therapy | tamoxiphen | CR | ||
| MISP | insertion | Frame_Shift_Ins | novel | c.1990_1991insTAGGAATGTGCCACTGCACCCAGATAGTTTATTTTTAT | p.Met664IlefsTer57 | p.M664Ifs*57 | Q8IVT2 | protein_coding | TCGA-A8-A0A4-01 | Breast | breast invasive carcinoma | Female | >=65 | I/II | Hormone Therapy | tamoxiphen | CR | ||
| MISP | insertion | Nonsense_Mutation | novel | c.1899_1900insGGACTACAGGCGCCTGCCTCCACGCCTGGCTAATTTTTTTGT | p.Lys633_Lys634insGlyLeuGlnAlaProAlaSerThrProGlyTerPhePheCys | p.K633_K634insGLQAPASTPG*FFC | Q8IVT2 | protein_coding | TCGA-AO-A0JB-01 | Breast | breast invasive carcinoma | Female | <65 | III/IV | Chemotherapy | cyclophosphamide | SD | ||
| MISP | SNV | Missense_Mutation | novel | c.1691N>C | p.Glu564Ala | p.E564A | Q8IVT2 | protein_coding | deleterious(0) | possibly_damaging(0.841) | TCGA-DS-A1OD-01 | Cervix | cervical & endocervical cancer | Female | <65 | I/II | Chemotherapy | cisplatin | SD |
| MISP | SNV | Missense_Mutation | c.503G>T | p.Gly168Val | p.G168V | Q8IVT2 | protein_coding | tolerated(0.33) | benign(0.01) | TCGA-EA-A3HU-01 | Cervix | cervical & endocervical cancer | Female | <65 | I/II | Unknown | Unknown | SD | |
| MISP | SNV | Missense_Mutation | novel | c.1747G>C | p.Asp583His | p.D583H | Q8IVT2 | protein_coding | deleterious(0.04) | possibly_damaging(0.503) | TCGA-JW-A5VJ-01 | Cervix | cervical & endocervical cancer | Female | <65 | I/II | Unknown | Unknown | PD |
| MISP | SNV | Missense_Mutation | c.1787N>A | p.Thr596Lys | p.T596K | Q8IVT2 | protein_coding | tolerated(0.06) | probably_damaging(0.927) | TCGA-LP-A4AW-01 | Cervix | cervical & endocervical cancer | Female | <65 | I/II | Unknown | Unknown | SD |
| Page: 1 2 3 4 5 6 7 8 |
Top |
Related drugs of malignant transformation related genes |
| Identification of chemicals and drugs interact with genes involved in malignant transfromation |
| (DGIdb 4.0) |
| Entrez ID | Symbol | Category | Interaction Types | Drug Claim Name | Drug Name | PMIDs |
| Page: 1 |

Copyright 2023-Present -The University of Texas Health Science Center at Houston |