
|
|||||
|
 | |
| |
| |
| |
| |
| |
|
Gene: MBD3 |
Gene summary for MBD3 |
| Gene information | Species | Human | Gene symbol | MBD3 | Gene ID | 53615 |
| Gene name | methyl-CpG binding domain protein 3 | |
| Gene Alias | MBD3 | |
| Cytomap | 19p13.3 | |
| Gene Type | protein-coding | GO ID | GO:0000122 | UniProtAcc | O95983 |
Top |
Malignant transformation analysis |
| Identification of the aberrant gene expression in precancerous and cancerous lesions by comparing the gene expression of stem-like cells in diseased tissues with normal stem cells |
| Entrez ID | Symbol | Replicates | Species | Organ | Tissue | Adj P-value | Log2FC | Malignancy |
| 53615 | MBD3 | LZE7T | Human | Esophagus | ESCC | 1.34e-05 | 1.95e-01 | 0.0667 |
| 53615 | MBD3 | LZE24T | Human | Esophagus | ESCC | 4.58e-07 | 7.55e-02 | 0.0596 |
| 53615 | MBD3 | LZE21T | Human | Esophagus | ESCC | 7.00e-05 | 2.34e-01 | 0.0655 |
| 53615 | MBD3 | P1T-E | Human | Esophagus | ESCC | 2.14e-04 | 2.07e-01 | 0.0875 |
| 53615 | MBD3 | P2T-E | Human | Esophagus | ESCC | 8.80e-08 | 5.43e-02 | 0.1177 |
| 53615 | MBD3 | P4T-E | Human | Esophagus | ESCC | 2.10e-09 | 1.53e-01 | 0.1323 |
| 53615 | MBD3 | P5T-E | Human | Esophagus | ESCC | 5.46e-06 | 8.58e-03 | 0.1327 |
| 53615 | MBD3 | P8T-E | Human | Esophagus | ESCC | 2.59e-05 | 5.58e-02 | 0.0889 |
| 53615 | MBD3 | P9T-E | Human | Esophagus | ESCC | 4.42e-07 | 1.83e-01 | 0.1131 |
| 53615 | MBD3 | P10T-E | Human | Esophagus | ESCC | 9.68e-22 | 3.67e-01 | 0.116 |
| 53615 | MBD3 | P11T-E | Human | Esophagus | ESCC | 1.58e-03 | 1.49e-01 | 0.1426 |
| 53615 | MBD3 | P12T-E | Human | Esophagus | ESCC | 2.17e-08 | 3.52e-02 | 0.1122 |
| 53615 | MBD3 | P15T-E | Human | Esophagus | ESCC | 1.09e-02 | -7.29e-03 | 0.1149 |
| 53615 | MBD3 | P16T-E | Human | Esophagus | ESCC | 7.41e-09 | 5.46e-03 | 0.1153 |
| 53615 | MBD3 | P20T-E | Human | Esophagus | ESCC | 2.12e-03 | 6.54e-03 | 0.1124 |
| 53615 | MBD3 | P21T-E | Human | Esophagus | ESCC | 5.23e-12 | 9.22e-02 | 0.1617 |
| 53615 | MBD3 | P22T-E | Human | Esophagus | ESCC | 3.65e-06 | 8.52e-02 | 0.1236 |
| 53615 | MBD3 | P23T-E | Human | Esophagus | ESCC | 2.06e-07 | 1.68e-01 | 0.108 |
| 53615 | MBD3 | P24T-E | Human | Esophagus | ESCC | 1.41e-03 | -3.02e-03 | 0.1287 |
| 53615 | MBD3 | P26T-E | Human | Esophagus | ESCC | 1.85e-10 | 9.47e-02 | 0.1276 |
| Page: 1 2 3 4 5 |
| Tissue | Expression Dynamics | Abbreviation |
| Esophagus | 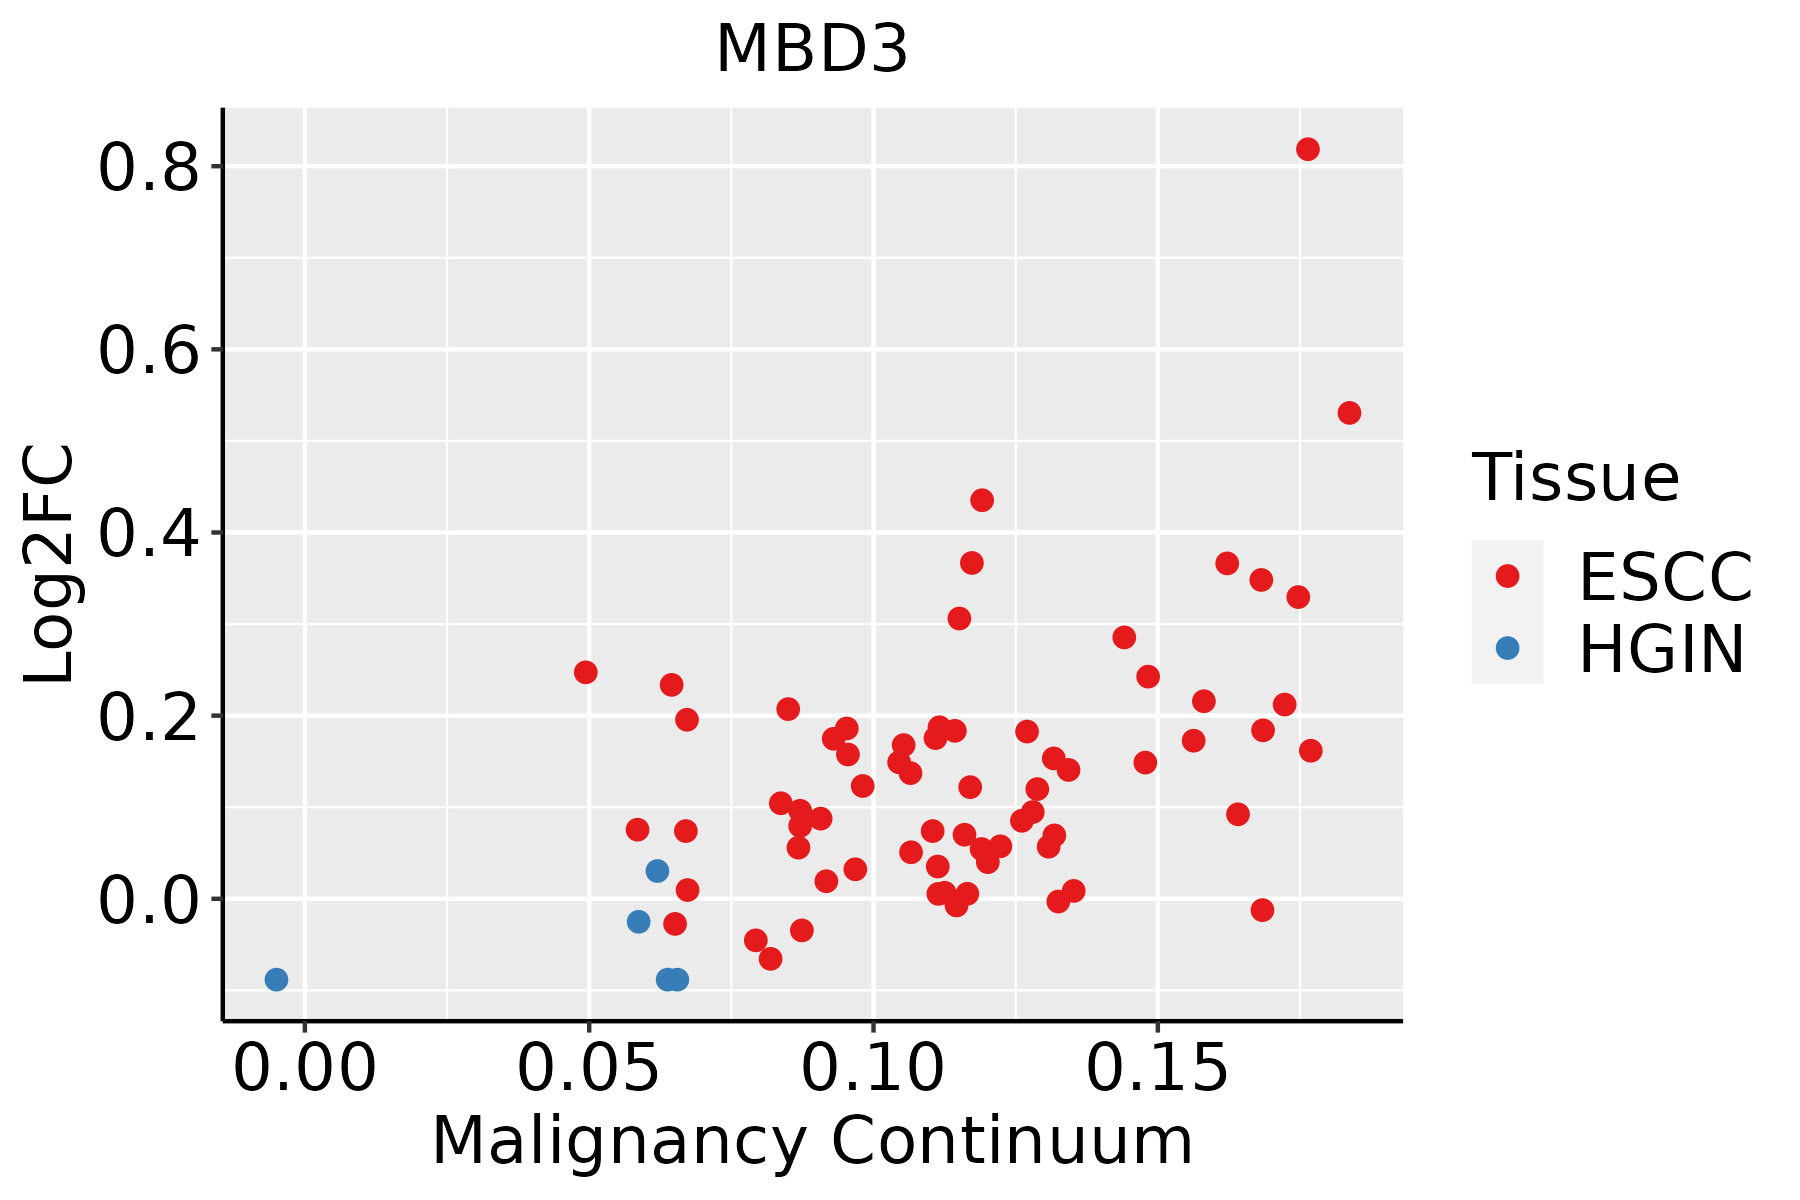 | ESCC: Esophageal squamous cell carcinoma |
| HGIN: High-grade intraepithelial neoplasias | ||
| LGIN: Low-grade intraepithelial neoplasias | ||
| Liver | 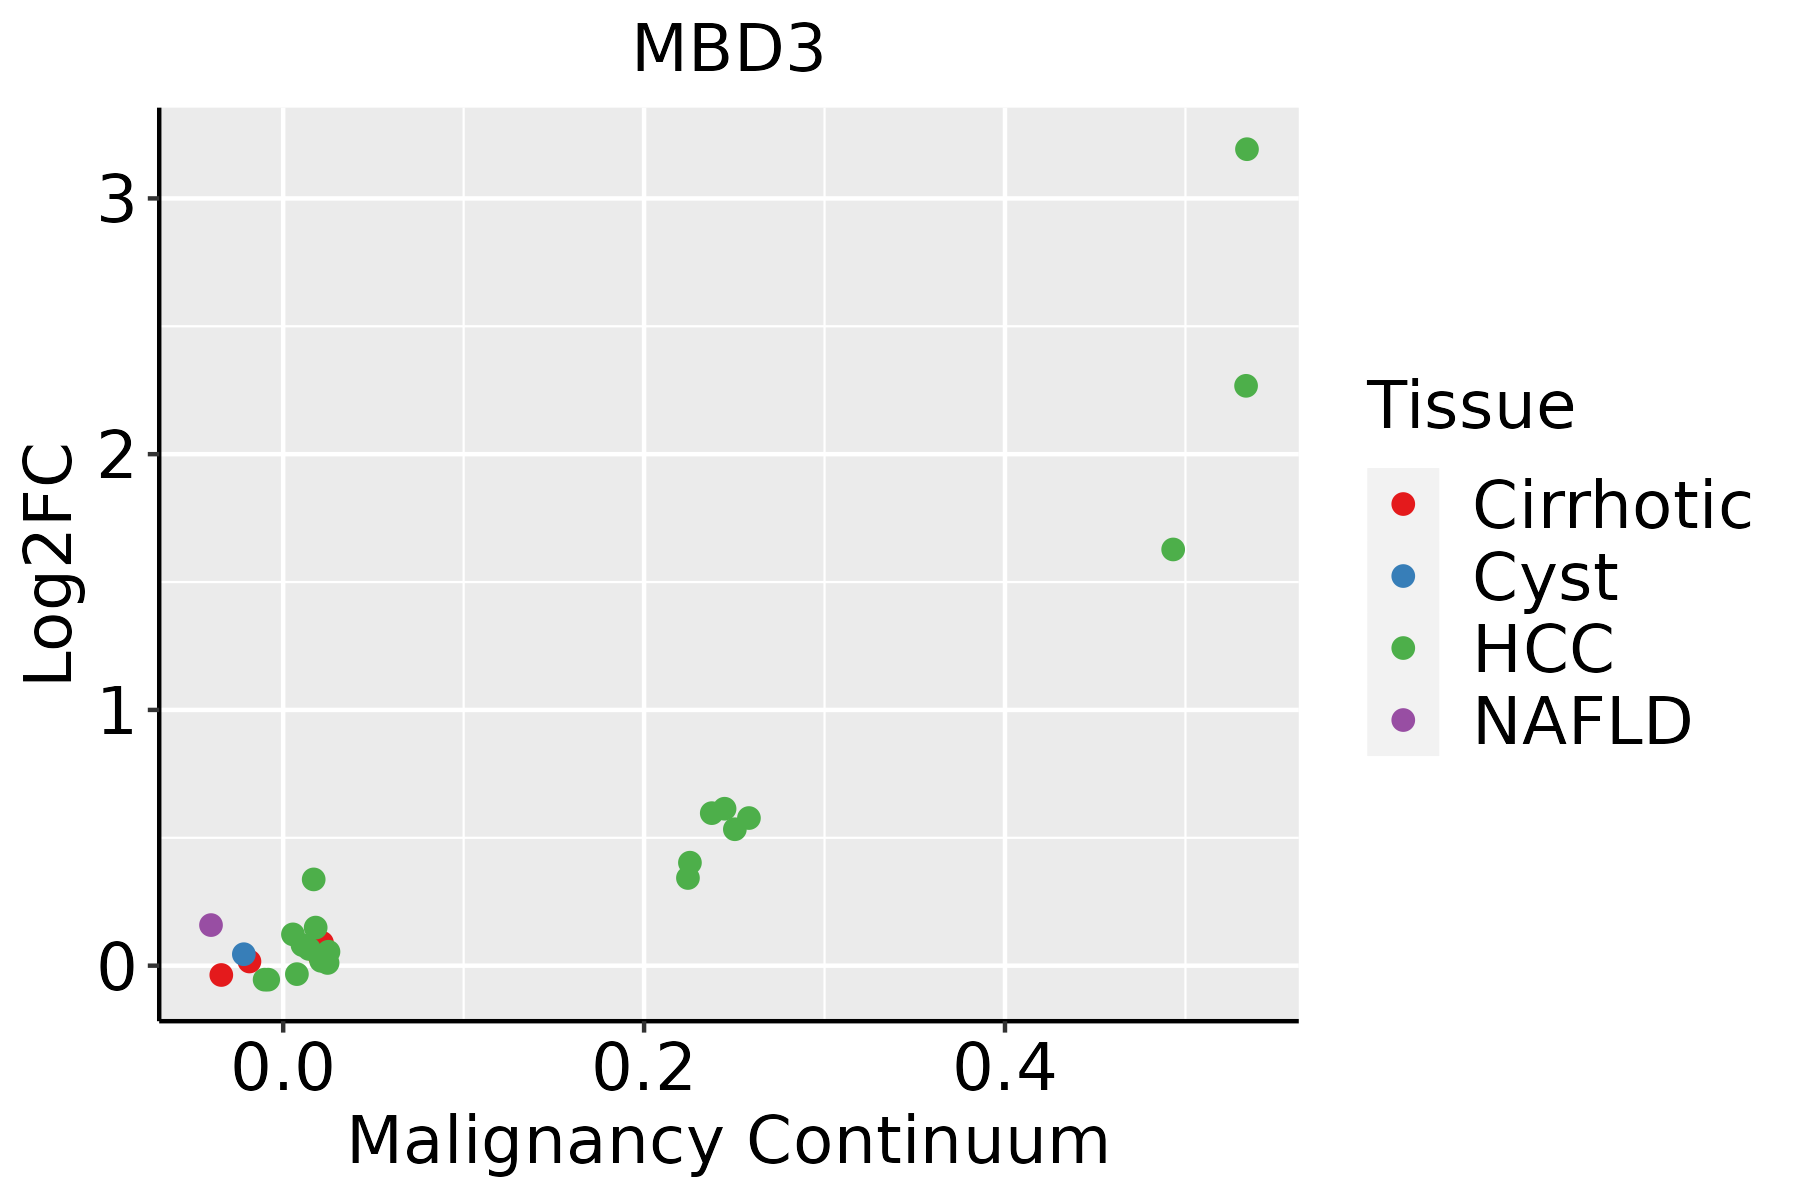 | HCC: Hepatocellular carcinoma |
| NAFLD: Non-alcoholic fatty liver disease | ||
| Oral Cavity |  | EOLP: Erosive Oral lichen planus |
| LP: leukoplakia | ||
| NEOLP: Non-erosive oral lichen planus | ||
| OSCC: Oral squamous cell carcinoma | ||
| Thyroid | 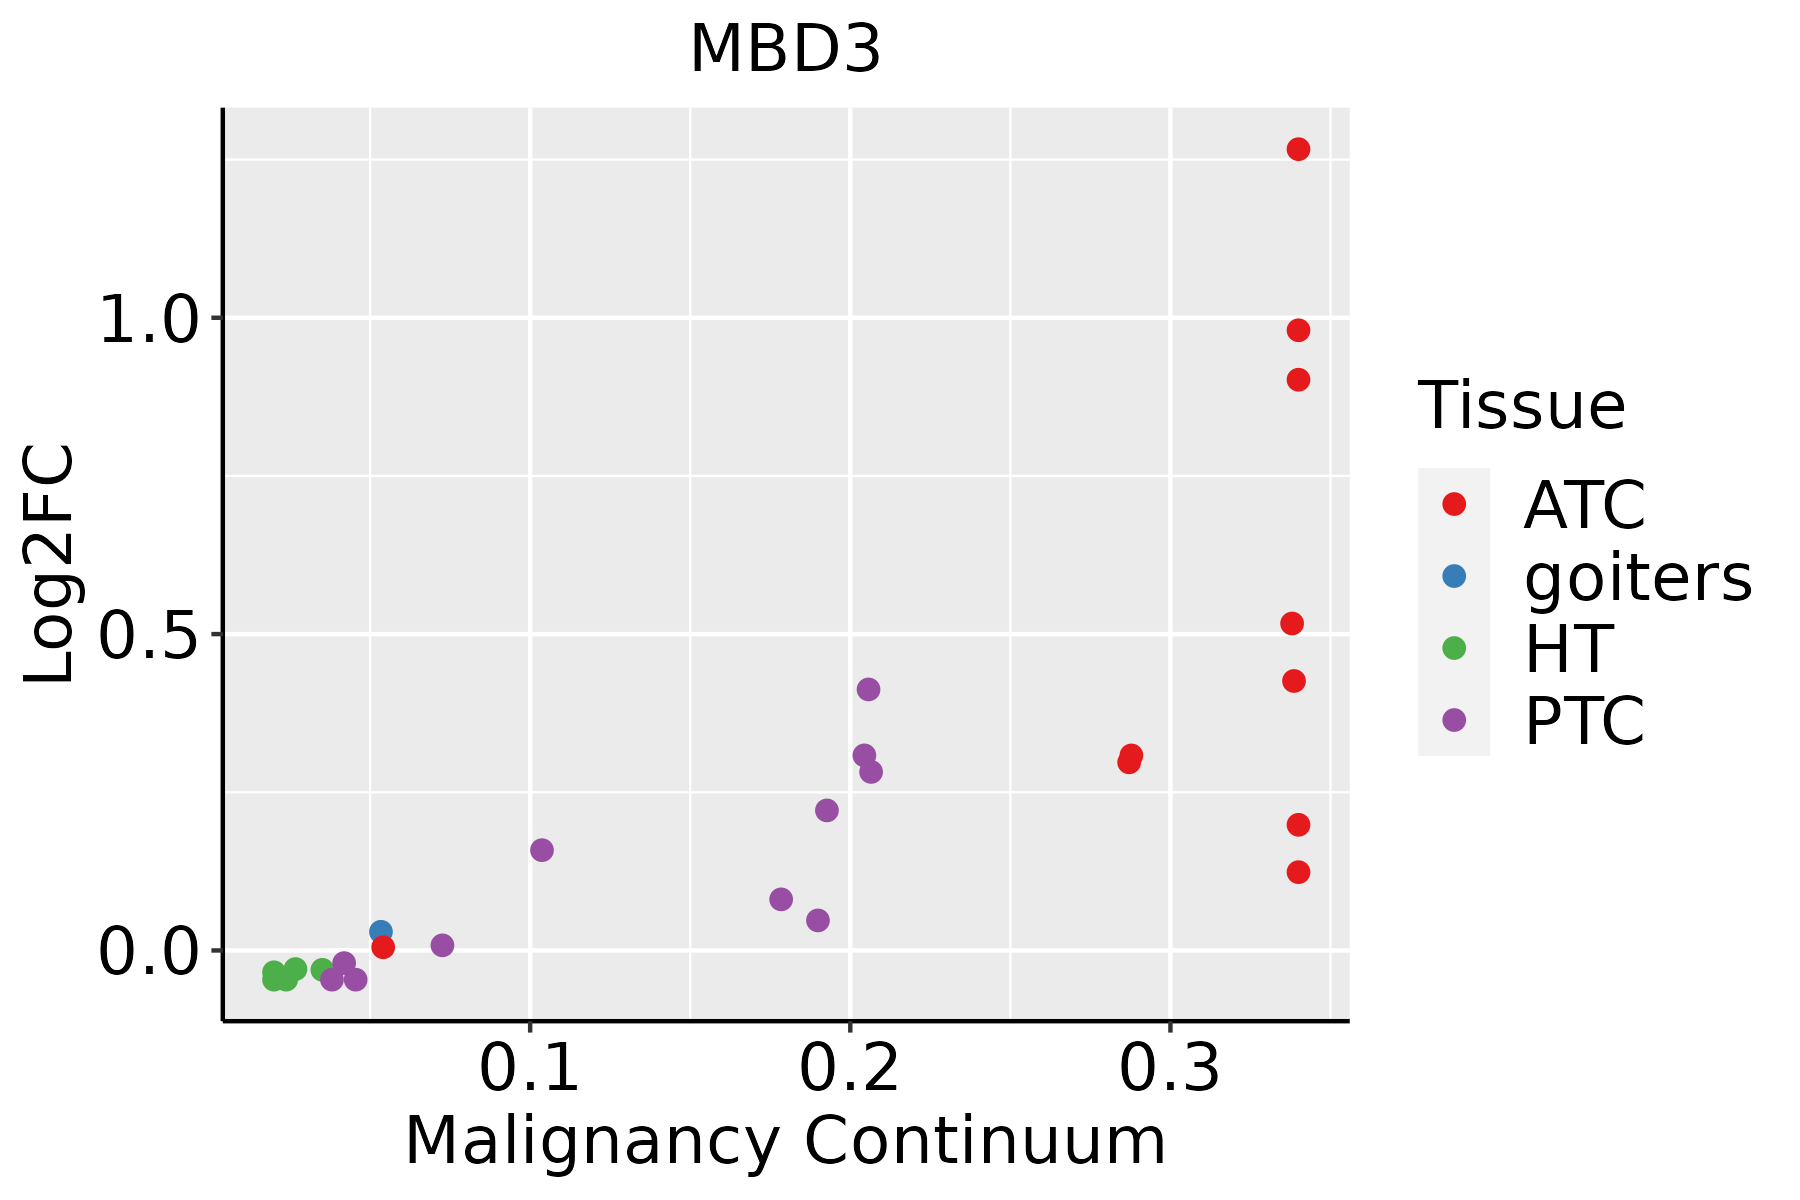 | ATC: Anaplastic thyroid cancer |
| HT: Hashimoto's thyroiditis | ||
| PTC: Papillary thyroid cancer |
| ∗log2FC in expression of this searched gene in stem-like cells from each diseased tissue sample relative to stem-like cells in normal samples in each tissue plotted against the malignancy continuum. Samples are colored based on if they are from different disease stage. |
Top |
Malignant transformation related pathway analysis |
| Find out the enriched GO biological processes and KEGG pathways involved in transition from healthy to precancer to cancer |
| Tissue | Disease Stage | Enriched GO biological Processes |
| Colorectum | AD |  |
| Colorectum | SER |  |
| Colorectum | MSS |  |
| Colorectum | MSI-H |  |
| Colorectum | FAP |  |
| ∗Top 15 enriched GO BP terms are showed in the bar plot of each disease state in each tissue. Each row represents a significant GO biological process which is colored according to the -log10(p.adjust). |
| Page: 1 2 3 4 5 6 7 8 9 |
| GO ID | Tissue | Disease Stage | Description | Gene Ratio | Bg Ratio | pvalue | p.adjust | Count |
| GO:0006325110 | Thyroid | ATC | chromatin organization | 189/6293 | 409/18723 | 6.40e-08 | 1.13e-06 | 189 |
| GO:0031667210 | Thyroid | ATC | response to nutrient levels | 212/6293 | 474/18723 | 2.37e-07 | 3.70e-06 | 212 |
| GO:004002913 | Thyroid | ATC | regulation of gene expression, epigenetic | 57/6293 | 105/18723 | 1.01e-05 | 1.00e-04 | 57 |
| GO:003235519 | Thyroid | ATC | response to estradiol | 72/6293 | 141/18723 | 1.35e-05 | 1.29e-04 | 72 |
| GO:000633813 | Thyroid | ATC | chromatin remodeling | 109/6293 | 255/18723 | 1.38e-03 | 7.15e-03 | 109 |
| GO:004341412 | Thyroid | ATC | macromolecule methylation | 131/6293 | 316/18723 | 2.01e-03 | 9.60e-03 | 131 |
| GO:00485688 | Thyroid | ATC | embryonic organ development | 172/6293 | 427/18723 | 2.08e-03 | 9.84e-03 | 172 |
| GO:00458141 | Thyroid | ATC | negative regulation of gene expression, epigenetic | 27/6293 | 50/18723 | 2.35e-03 | 1.10e-02 | 27 |
| GO:003225911 | Thyroid | ATC | methylation | 148/6293 | 364/18723 | 2.69e-03 | 1.23e-02 | 148 |
| GO:00315071 | Thyroid | ATC | heterochromatin assembly | 22/6293 | 39/18723 | 2.84e-03 | 1.29e-02 | 22 |
| GO:007082811 | Thyroid | ATC | heterochromatin organization | 25/6293 | 46/18723 | 3.00e-03 | 1.36e-02 | 25 |
| Page: 1 2 3 4 5 6 |
| Pathway ID | Tissue | Disease Stage | Description | Gene Ratio | Bg Ratio | pvalue | p.adjust | qvalue | Count |
| Page: 1 |
Top |
Cell-cell communication analysis |
| Identification of potential cell-cell interactions between two cell types and their ligand-receptor pairs for different disease states |
| Ligand | Receptor | LRpair | Pathway | Tissue | Disease Stage |
| Page: 1 |
Top |
Single-cell gene regulatory network inference analysis |
| Find out the significant the regulons (TFs) and the target genes of each regulon across cell types for different disease states |
| TF | Cell Type | Tissue | Disease Stage | Target Gene | RSS | Regulon Activity |
| ∗The dot plots of a searched regulon are shown for all cell subpopulations in each disease state of each tissue based on the regulon specific score inferred using pySCENIC and by calculating the average expression. |
| Page: 1 |
Top |
Somatic mutation of malignant transformation related genes |
| Annotation of somatic variants for genes involved in malignant transformation |
| Hugo Symbol | Variant Class | Variant Classification | dbSNP RS | HGVSc | HGVSp | HGVSp Short | SWISSPROT | BIOTYPE | SIFT | PolyPhen | Tumor Sample Barcode | Tissue | Histology | Sex | Age | Stage | Therapy Types | Drugs | Outcome |
| MBD3 | SNV | Missense_Mutation | c.530N>A | p.Leu177Gln | p.L177Q | O95983 | protein_coding | deleterious(0) | probably_damaging(1) | TCGA-AC-A23H-01 | Breast | breast invasive carcinoma | Female | >=65 | I/II | Unknown | Unknown | PD | |
| MBD3 | SNV | Missense_Mutation | novel | c.335N>A | p.Val112Glu | p.V112E | O95983 | protein_coding | deleterious(0.03) | probably_damaging(0.993) | TCGA-D8-A1XK-01 | Breast | breast invasive carcinoma | Female | <65 | I/II | Chemotherapy | doxorubicine+cyclophosphamide | SD |
| MBD3 | SNV | Missense_Mutation | c.260N>G | p.Asn87Ser | p.N87S | O95983 | protein_coding | tolerated(0.61) | benign(0.009) | TCGA-E2-A15C-01 | Breast | breast invasive carcinoma | Female | <65 | I/II | Hormone Therapy | arimidex | SD | |
| MBD3 | deletion | Frame_Shift_Del | novel | c.640delN | p.Leu214CysfsTer7 | p.L214Cfs*7 | O95983 | protein_coding | TCGA-D8-A27V-01 | Breast | breast invasive carcinoma | Female | <65 | I/II | Hormone Therapy | tamoxiphen | SD | ||
| MBD3 | SNV | Missense_Mutation | novel | c.775N>C | p.Glu259Gln | p.E259Q | O95983 | protein_coding | tolerated_low_confidence(0.06) | benign(0.039) | TCGA-VS-A9UC-01 | Cervix | cervical & endocervical cancer | Female | <65 | I/II | Chemotherapy | cisplatin | SD |
| MBD3 | SNV | Missense_Mutation | novel | c.593N>G | p.Ala198Gly | p.A198G | O95983 | protein_coding | tolerated(0.06) | possibly_damaging(0.643) | TCGA-AA-3930-01 | Colorectum | colon adenocarcinoma | Male | >=65 | III/IV | Chemotherapy | capecitabine | PD |
| MBD3 | SNV | Missense_Mutation | c.193N>A | p.Arg65Ser | p.R65S | O95983 | protein_coding | deleterious(0.02) | possibly_damaging(0.5) | TCGA-DM-A28C-01 | Colorectum | colon adenocarcinoma | Male | >=65 | I/II | Unknown | Unknown | PD | |
| MBD3 | SNV | Missense_Mutation | c.245G>A | p.Arg82His | p.R82H | O95983 | protein_coding | tolerated(0.1) | probably_damaging(0.943) | TCGA-QG-A5YV-01 | Colorectum | colon adenocarcinoma | Female | <65 | III/IV | Chemotherapy | xeloda | CR | |
| MBD3 | SNV | Missense_Mutation | c.19N>A | p.Glu7Lys | p.E7K | O95983 | protein_coding | deleterious(0.01) | benign(0.133) | TCGA-DY-A1DF-01 | Colorectum | rectum adenocarcinoma | Female | >=65 | III/IV | Unknown | Unknown | SD | |
| MBD3 | SNV | Missense_Mutation | novel | c.239N>A | p.Arg80His | p.R80H | O95983 | protein_coding | tolerated(0.06) | possibly_damaging(0.902) | TCGA-A5-A2K3-01 | Endometrium | uterine corpus endometrioid carcinoma | Female | >=65 | I/II | Chemotherapy | carboplatin | SD |
| Page: 1 2 3 4 5 |
Top |
Related drugs of malignant transformation related genes |
| Identification of chemicals and drugs interact with genes involved in malignant transfromation |
| (DGIdb 4.0) |
| Entrez ID | Symbol | Category | Interaction Types | Drug Claim Name | Drug Name | PMIDs |
| Page: 1 |

Copyright 2023-Present -The University of Texas Health Science Center at Houston |