
|
|||||
|
 | |
| |
| |
| |
| |
| |
|
Gene: MARVELD3 |
Gene summary for MARVELD3 |
| Gene information | Species | Human | Gene symbol | MARVELD3 | Gene ID | 91862 |
| Gene name | MARVEL domain containing 3 | |
| Gene Alias | MARVD3 | |
| Cytomap | 16q22.2 | |
| Gene Type | protein-coding | GO ID | GO:0000165 | UniProtAcc | Q96A59 |
Top |
Malignant transformation analysis |
| Identification of the aberrant gene expression in precancerous and cancerous lesions by comparing the gene expression of stem-like cells in diseased tissues with normal stem cells |
| Entrez ID | Symbol | Replicates | Species | Organ | Tissue | Adj P-value | Log2FC | Malignancy |
| 91862 | MARVELD3 | HTA11_2487_2000001011 | Human | Colorectum | SER | 4.17e-08 | 6.34e-01 | -0.1808 |
| 91862 | MARVELD3 | HTA11_78_2000001011 | Human | Colorectum | AD | 3.39e-02 | 3.80e-01 | -0.1088 |
| 91862 | MARVELD3 | HTA11_347_2000001011 | Human | Colorectum | AD | 4.86e-15 | 6.60e-01 | -0.1954 |
| 91862 | MARVELD3 | A002-C-010 | Human | Colorectum | FAP | 3.05e-04 | -1.88e-01 | 0.242 |
| 91862 | MARVELD3 | A001-C-207 | Human | Colorectum | FAP | 7.54e-03 | -2.45e-01 | 0.1278 |
| 91862 | MARVELD3 | A015-C-203 | Human | Colorectum | FAP | 3.23e-10 | -2.12e-01 | -0.1294 |
| 91862 | MARVELD3 | A002-C-201 | Human | Colorectum | FAP | 4.80e-05 | -2.27e-01 | 0.0324 |
| 91862 | MARVELD3 | A002-C-203 | Human | Colorectum | FAP | 1.66e-04 | -1.98e-01 | 0.2786 |
| 91862 | MARVELD3 | A001-C-119 | Human | Colorectum | FAP | 2.73e-06 | -3.56e-01 | -0.1557 |
| 91862 | MARVELD3 | A001-C-108 | Human | Colorectum | FAP | 1.41e-09 | -2.47e-01 | -0.0272 |
| 91862 | MARVELD3 | A002-C-205 | Human | Colorectum | FAP | 7.04e-10 | -3.01e-01 | -0.1236 |
| 91862 | MARVELD3 | A001-C-104 | Human | Colorectum | FAP | 4.77e-06 | -2.47e-01 | 0.0184 |
| 91862 | MARVELD3 | A015-C-006 | Human | Colorectum | FAP | 4.48e-05 | -2.95e-01 | -0.0994 |
| 91862 | MARVELD3 | A015-C-106 | Human | Colorectum | FAP | 1.27e-06 | -2.16e-01 | -0.0511 |
| 91862 | MARVELD3 | A002-C-114 | Human | Colorectum | FAP | 4.58e-07 | -2.90e-01 | -0.1561 |
| 91862 | MARVELD3 | A015-C-104 | Human | Colorectum | FAP | 1.76e-11 | -2.48e-01 | -0.1899 |
| 91862 | MARVELD3 | A001-C-014 | Human | Colorectum | FAP | 8.79e-06 | -2.29e-01 | 0.0135 |
| 91862 | MARVELD3 | A002-C-016 | Human | Colorectum | FAP | 5.18e-10 | -3.00e-01 | 0.0521 |
| 91862 | MARVELD3 | A015-C-002 | Human | Colorectum | FAP | 1.92e-04 | -2.92e-01 | -0.0763 |
| 91862 | MARVELD3 | A001-C-203 | Human | Colorectum | FAP | 4.20e-08 | -2.26e-01 | -0.0481 |
| Page: 1 2 3 4 5 6 |
| Tissue | Expression Dynamics | Abbreviation |
| Colorectum (GSE201348) |  | FAP: Familial adenomatous polyposis |
| CRC: Colorectal cancer | ||
| Colorectum (HTA11) |  | AD: Adenomas |
| SER: Sessile serrated lesions | ||
| MSI-H: Microsatellite-high colorectal cancer | ||
| MSS: Microsatellite stable colorectal cancer | ||
| Esophagus | 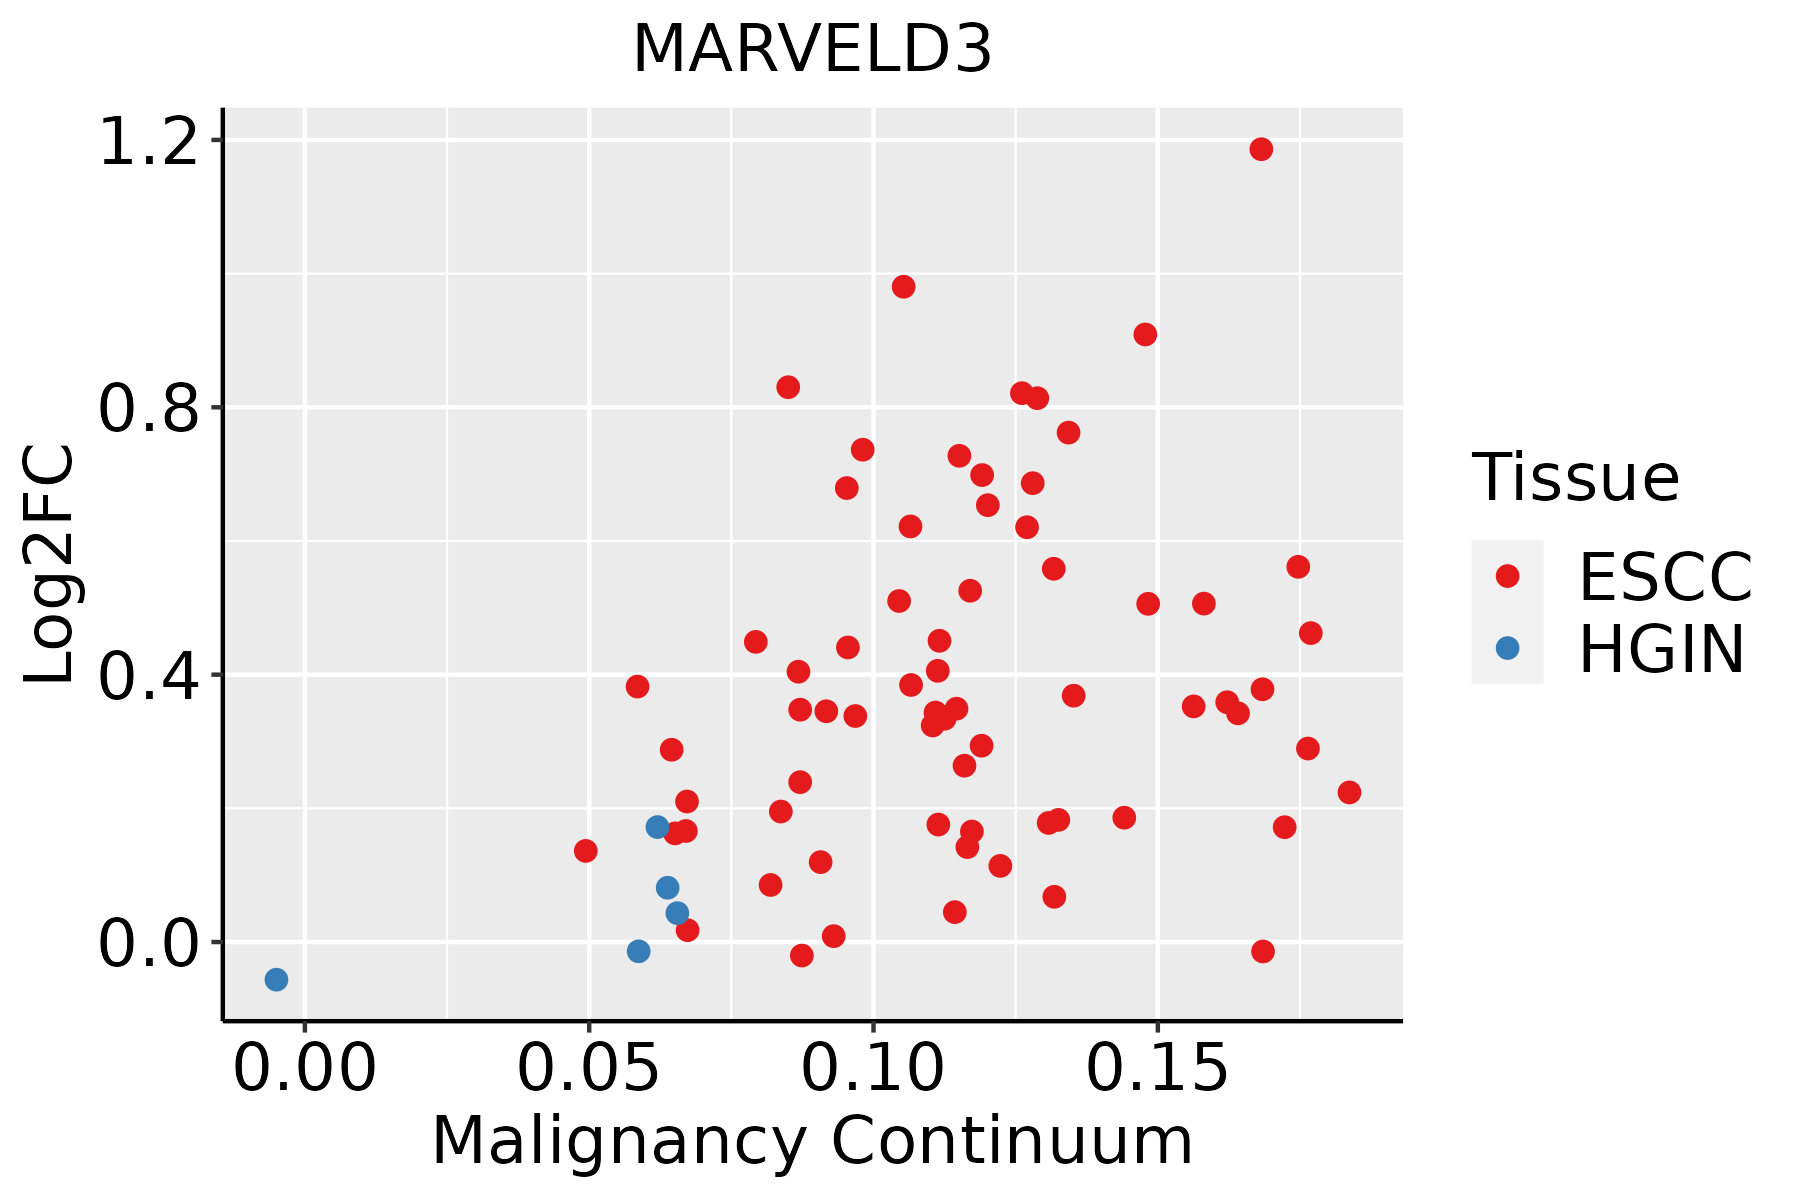 | ESCC: Esophageal squamous cell carcinoma |
| HGIN: High-grade intraepithelial neoplasias | ||
| LGIN: Low-grade intraepithelial neoplasias | ||
| Liver |  | HCC: Hepatocellular carcinoma |
| NAFLD: Non-alcoholic fatty liver disease | ||
| Oral Cavity |  | EOLP: Erosive Oral lichen planus |
| LP: leukoplakia | ||
| NEOLP: Non-erosive oral lichen planus | ||
| OSCC: Oral squamous cell carcinoma |
| ∗log2FC in expression of this searched gene in stem-like cells from each diseased tissue sample relative to stem-like cells in normal samples in each tissue plotted against the malignancy continuum. Samples are colored based on if they are from different disease stage. |
Top |
Malignant transformation related pathway analysis |
| Find out the enriched GO biological processes and KEGG pathways involved in transition from healthy to precancer to cancer |
| Tissue | Disease Stage | Enriched GO biological Processes |
| Colorectum | AD |  |
| Colorectum | SER |  |
| Colorectum | MSS |  |
| Colorectum | MSI-H |  |
| Colorectum | FAP |  |
| ∗Top 15 enriched GO BP terms are showed in the bar plot of each disease state in each tissue. Each row represents a significant GO biological process which is colored according to the -log10(p.adjust). |
| Page: 1 2 3 4 5 6 7 8 9 |
| GO ID | Tissue | Disease Stage | Description | Gene Ratio | Bg Ratio | pvalue | p.adjust | Count |
| GO:009013220 | Esophagus | ESCC | epithelium migration | 188/8552 | 360/18723 | 6.96e-03 | 2.54e-02 | 188 |
| GO:009013020 | Esophagus | ESCC | tissue migration | 190/8552 | 365/18723 | 7.91e-03 | 2.82e-02 | 190 |
| GO:004521612 | Liver | Cirrhotic | cell-cell junction organization | 70/4634 | 200/18723 | 7.23e-04 | 5.36e-03 | 70 |
| GO:003109812 | Liver | Cirrhotic | stress-activated protein kinase signaling cascade | 83/4634 | 247/18723 | 1.04e-03 | 7.28e-03 | 83 |
| GO:000697011 | Liver | Cirrhotic | response to osmotic stress | 34/4634 | 84/18723 | 1.06e-03 | 7.40e-03 | 34 |
| GO:005140312 | Liver | Cirrhotic | stress-activated MAPK cascade | 80/4634 | 239/18723 | 1.43e-03 | 9.54e-03 | 80 |
| GO:000166712 | Liver | Cirrhotic | ameboidal-type cell migration | 145/4634 | 475/18723 | 2.23e-03 | 1.36e-02 | 145 |
| GO:00106327 | Liver | Cirrhotic | regulation of epithelial cell migration | 93/4634 | 292/18723 | 3.46e-03 | 1.92e-02 | 93 |
| GO:00106317 | Liver | Cirrhotic | epithelial cell migration | 110/4634 | 357/18723 | 5.14e-03 | 2.65e-02 | 110 |
| GO:00070437 | Liver | Cirrhotic | cell-cell junction assembly | 50/4634 | 146/18723 | 6.23e-03 | 3.09e-02 | 50 |
| GO:007030212 | Liver | Cirrhotic | regulation of stress-activated protein kinase signaling cascade | 64/4634 | 195/18723 | 6.61e-03 | 3.27e-02 | 64 |
| GO:00901327 | Liver | Cirrhotic | epithelium migration | 110/4634 | 360/18723 | 6.79e-03 | 3.35e-02 | 110 |
| GO:00901307 | Liver | Cirrhotic | tissue migration | 111/4634 | 365/18723 | 7.66e-03 | 3.61e-02 | 111 |
| GO:00432976 | Liver | Cirrhotic | apical junction assembly | 29/4634 | 78/18723 | 9.80e-03 | 4.41e-02 | 29 |
| GO:003287212 | Liver | Cirrhotic | regulation of stress-activated MAPK cascade | 62/4634 | 192/18723 | 1.08e-02 | 4.77e-02 | 62 |
| GO:003109822 | Liver | HCC | stress-activated protein kinase signaling cascade | 138/7958 | 247/18723 | 1.43e-05 | 1.57e-04 | 138 |
| GO:005140322 | Liver | HCC | stress-activated MAPK cascade | 134/7958 | 239/18723 | 1.50e-05 | 1.64e-04 | 134 |
| GO:00069702 | Liver | HCC | response to osmotic stress | 52/7958 | 84/18723 | 2.58e-04 | 1.92e-03 | 52 |
| GO:00434097 | Liver | HCC | negative regulation of MAPK cascade | 98/7958 | 180/18723 | 7.88e-04 | 4.74e-03 | 98 |
| GO:007030222 | Liver | HCC | regulation of stress-activated protein kinase signaling cascade | 105/7958 | 195/18723 | 8.79e-04 | 5.20e-03 | 105 |
| Page: 1 2 3 4 5 6 7 8 |
| Pathway ID | Tissue | Disease Stage | Description | Gene Ratio | Bg Ratio | pvalue | p.adjust | qvalue | Count |
| hsa04530 | Colorectum | AD | Tight junction | 76/2092 | 169/8465 | 5.49e-09 | 9.69e-08 | 6.18e-08 | 76 |
| hsa045301 | Colorectum | AD | Tight junction | 76/2092 | 169/8465 | 5.49e-09 | 9.69e-08 | 6.18e-08 | 76 |
| hsa045302 | Colorectum | SER | Tight junction | 59/1580 | 169/8465 | 3.24e-07 | 5.98e-06 | 4.34e-06 | 59 |
| hsa045303 | Colorectum | SER | Tight junction | 59/1580 | 169/8465 | 3.24e-07 | 5.98e-06 | 4.34e-06 | 59 |
| hsa045308 | Colorectum | FAP | Tight junction | 60/1404 | 169/8465 | 1.40e-09 | 9.33e-08 | 5.67e-08 | 60 |
| hsa045309 | Colorectum | FAP | Tight junction | 60/1404 | 169/8465 | 1.40e-09 | 9.33e-08 | 5.67e-08 | 60 |
| hsa0453010 | Colorectum | CRC | Tight junction | 44/1091 | 169/8465 | 2.51e-06 | 7.61e-05 | 5.16e-05 | 44 |
| hsa0453011 | Colorectum | CRC | Tight junction | 44/1091 | 169/8465 | 2.51e-06 | 7.61e-05 | 5.16e-05 | 44 |
| hsa04530211 | Esophagus | ESCC | Tight junction | 105/4205 | 169/8465 | 6.73e-04 | 2.23e-03 | 1.14e-03 | 105 |
| hsa04530310 | Esophagus | ESCC | Tight junction | 105/4205 | 169/8465 | 6.73e-04 | 2.23e-03 | 1.14e-03 | 105 |
| hsa0453022 | Liver | Cirrhotic | Tight junction | 82/2530 | 169/8465 | 2.14e-07 | 2.85e-06 | 1.76e-06 | 82 |
| hsa0453032 | Liver | Cirrhotic | Tight junction | 82/2530 | 169/8465 | 2.14e-07 | 2.85e-06 | 1.76e-06 | 82 |
| hsa0453042 | Liver | HCC | Tight junction | 110/4020 | 169/8465 | 2.45e-06 | 2.28e-05 | 1.27e-05 | 110 |
| hsa0453052 | Liver | HCC | Tight junction | 110/4020 | 169/8465 | 2.45e-06 | 2.28e-05 | 1.27e-05 | 110 |
| hsa0453030 | Oral cavity | OSCC | Tight junction | 102/3704 | 169/8465 | 8.68e-06 | 3.93e-05 | 2.00e-05 | 102 |
| hsa04530114 | Oral cavity | OSCC | Tight junction | 102/3704 | 169/8465 | 8.68e-06 | 3.93e-05 | 2.00e-05 | 102 |
| Page: 1 |
Top |
Cell-cell communication analysis |
| Identification of potential cell-cell interactions between two cell types and their ligand-receptor pairs for different disease states |
| Ligand | Receptor | LRpair | Pathway | Tissue | Disease Stage |
| Page: 1 |
Top |
Single-cell gene regulatory network inference analysis |
| Find out the significant the regulons (TFs) and the target genes of each regulon across cell types for different disease states |
| TF | Cell Type | Tissue | Disease Stage | Target Gene | RSS | Regulon Activity |
| ∗The dot plots of a searched regulon are shown for all cell subpopulations in each disease state of each tissue based on the regulon specific score inferred using pySCENIC and by calculating the average expression. |
| Page: 1 |
Top |
Somatic mutation of malignant transformation related genes |
| Annotation of somatic variants for genes involved in malignant transformation |
| Hugo Symbol | Variant Class | Variant Classification | dbSNP RS | HGVSc | HGVSp | HGVSp Short | SWISSPROT | BIOTYPE | SIFT | PolyPhen | Tumor Sample Barcode | Tissue | Histology | Sex | Age | Stage | Therapy Types | Drugs | Outcome |
| MARVELD3 | SNV | Missense_Mutation | novel | c.196G>A | p.Asp66Asn | p.D66N | Q96A59 | protein_coding | tolerated(0.35) | benign(0.33) | TCGA-C5-A902-01 | Cervix | cervical & endocervical cancer | Female | <65 | I/II | Chemotherapy | cisplatin | SD |
| MARVELD3 | SNV | Missense_Mutation | rs554767506 | c.994G>A | p.Asp332Asn | p.D332N | Q96A59 | protein_coding | tolerated(0.07) | probably_damaging(0.985) | TCGA-5M-AAT6-01 | Colorectum | colon adenocarcinoma | Female | <65 | III/IV | Unknown | Unknown | PD |
| MARVELD3 | SNV | Missense_Mutation | novel | c.1179A>C | p.Glu393Asp | p.E393D | Q96A59 | protein_coding | deleterious(0.01) | benign(0.21) | TCGA-AA-3681-01 | Colorectum | colon adenocarcinoma | Female | >=65 | III/IV | Unknown | Unknown | SD |
| MARVELD3 | SNV | Missense_Mutation | rs762726448 | c.1160N>A | p.Arg387His | p.R387H | Q96A59 | protein_coding | tolerated(0.43) | benign(0) | TCGA-AA-3854-01 | Colorectum | colon adenocarcinoma | Female | >=65 | I/II | Unknown | Unknown | SD |
| MARVELD3 | SNV | Missense_Mutation | c.737N>A | p.Gly246Asp | p.G246D | Q96A59 | protein_coding | deleterious(0) | probably_damaging(1) | TCGA-AA-3864-01 | Colorectum | colon adenocarcinoma | Male | >=65 | I/II | Unknown | Unknown | SD | |
| MARVELD3 | SNV | Missense_Mutation | novel | c.665N>A | p.Val222Asp | p.V222D | Q96A59 | protein_coding | tolerated(0.08) | probably_damaging(0.982) | TCGA-AA-A010-01 | Colorectum | colon adenocarcinoma | Female | <65 | I/II | Chemotherapy | folinic | CR |
| MARVELD3 | SNV | Missense_Mutation | c.545N>T | p.Ala182Val | p.A182V | Q96A59 | protein_coding | deleterious(0) | possibly_damaging(0.714) | TCGA-AA-A02R-01 | Colorectum | colon adenocarcinoma | Female | >=65 | I/II | Unknown | Unknown | PD | |
| MARVELD3 | SNV | Missense_Mutation | novel | c.1060N>A | p.Ala354Thr | p.A354T | Q96A59 | protein_coding | tolerated(0.43) | benign(0.091) | TCGA-AD-6899-01 | Colorectum | colon adenocarcinoma | Male | >=65 | III/IV | Unknown | Unknown | SD |
| MARVELD3 | SNV | Missense_Mutation | novel | c.257N>G | p.Asp86Gly | p.D86G | Q96A59 | protein_coding | deleterious(0.03) | benign(0.006) | TCGA-DM-A28F-01 | Colorectum | colon adenocarcinoma | Male | >=65 | III/IV | Unknown | Unknown | SD |
| MARVELD3 | SNV | Missense_Mutation | rs780239821 | c.479N>T | p.Ser160Leu | p.S160L | Q96A59 | protein_coding | deleterious(0.04) | benign(0.039) | TCGA-AG-A002-01 | Colorectum | rectum adenocarcinoma | Male | <65 | I/II | Unknown | Unknown | SD |
| Page: 1 2 3 4 |
Top |
Related drugs of malignant transformation related genes |
| Identification of chemicals and drugs interact with genes involved in malignant transfromation |
| (DGIdb 4.0) |
| Entrez ID | Symbol | Category | Interaction Types | Drug Claim Name | Drug Name | PMIDs |
| Page: 1 |

Copyright 2023-Present -The University of Texas Health Science Center at Houston |