
|
|||||
|
 | |
| |
| |
| |
| |
| |
|
Gene: MAPKAPK5 |
Gene summary for MAPKAPK5 |
| Gene information | Species | Human | Gene symbol | MAPKAPK5 | Gene ID | 8550 |
| Gene name | MAPK activated protein kinase 5 | |
| Gene Alias | MAPKAP-K5 | |
| Cytomap | 12q24.12-q24.13 | |
| Gene Type | protein-coding | GO ID | GO:0000165 | UniProtAcc | Q8IW41 |
Top |
Malignant transformation analysis |
| Identification of the aberrant gene expression in precancerous and cancerous lesions by comparing the gene expression of stem-like cells in diseased tissues with normal stem cells |
| Entrez ID | Symbol | Replicates | Species | Organ | Tissue | Adj P-value | Log2FC | Malignancy |
| 8550 | MAPKAPK5 | LZE4T | Human | Esophagus | ESCC | 1.37e-07 | 9.07e-02 | 0.0811 |
| 8550 | MAPKAPK5 | LZE7T | Human | Esophagus | ESCC | 8.64e-04 | 1.42e-01 | 0.0667 |
| 8550 | MAPKAPK5 | LZE22T | Human | Esophagus | ESCC | 2.44e-03 | 3.94e-01 | 0.068 |
| 8550 | MAPKAPK5 | LZE24T | Human | Esophagus | ESCC | 8.80e-12 | 3.38e-01 | 0.0596 |
| 8550 | MAPKAPK5 | LZE21T | Human | Esophagus | ESCC | 2.45e-03 | 2.72e-01 | 0.0655 |
| 8550 | MAPKAPK5 | P1T-E | Human | Esophagus | ESCC | 2.08e-08 | 3.92e-01 | 0.0875 |
| 8550 | MAPKAPK5 | P2T-E | Human | Esophagus | ESCC | 5.40e-48 | 8.80e-01 | 0.1177 |
| 8550 | MAPKAPK5 | P4T-E | Human | Esophagus | ESCC | 1.02e-21 | 4.78e-01 | 0.1323 |
| 8550 | MAPKAPK5 | P5T-E | Human | Esophagus | ESCC | 2.64e-10 | 2.51e-01 | 0.1327 |
| 8550 | MAPKAPK5 | P8T-E | Human | Esophagus | ESCC | 3.50e-23 | 4.02e-01 | 0.0889 |
| 8550 | MAPKAPK5 | P9T-E | Human | Esophagus | ESCC | 2.85e-13 | 1.17e-01 | 0.1131 |
| 8550 | MAPKAPK5 | P10T-E | Human | Esophagus | ESCC | 2.11e-22 | 3.80e-01 | 0.116 |
| 8550 | MAPKAPK5 | P11T-E | Human | Esophagus | ESCC | 1.67e-10 | 4.19e-01 | 0.1426 |
| 8550 | MAPKAPK5 | P12T-E | Human | Esophagus | ESCC | 1.02e-16 | 2.77e-01 | 0.1122 |
| 8550 | MAPKAPK5 | P15T-E | Human | Esophagus | ESCC | 3.44e-16 | 3.81e-01 | 0.1149 |
| 8550 | MAPKAPK5 | P16T-E | Human | Esophagus | ESCC | 4.71e-24 | 4.22e-01 | 0.1153 |
| 8550 | MAPKAPK5 | P17T-E | Human | Esophagus | ESCC | 2.52e-09 | 3.30e-01 | 0.1278 |
| 8550 | MAPKAPK5 | P19T-E | Human | Esophagus | ESCC | 1.62e-04 | 3.63e-01 | 0.1662 |
| 8550 | MAPKAPK5 | P20T-E | Human | Esophagus | ESCC | 5.32e-21 | 4.22e-01 | 0.1124 |
| 8550 | MAPKAPK5 | P21T-E | Human | Esophagus | ESCC | 6.31e-29 | 5.63e-01 | 0.1617 |
| Page: 1 2 3 4 5 |
| Tissue | Expression Dynamics | Abbreviation |
| Esophagus |  | ESCC: Esophageal squamous cell carcinoma |
| HGIN: High-grade intraepithelial neoplasias | ||
| LGIN: Low-grade intraepithelial neoplasias | ||
| Liver | 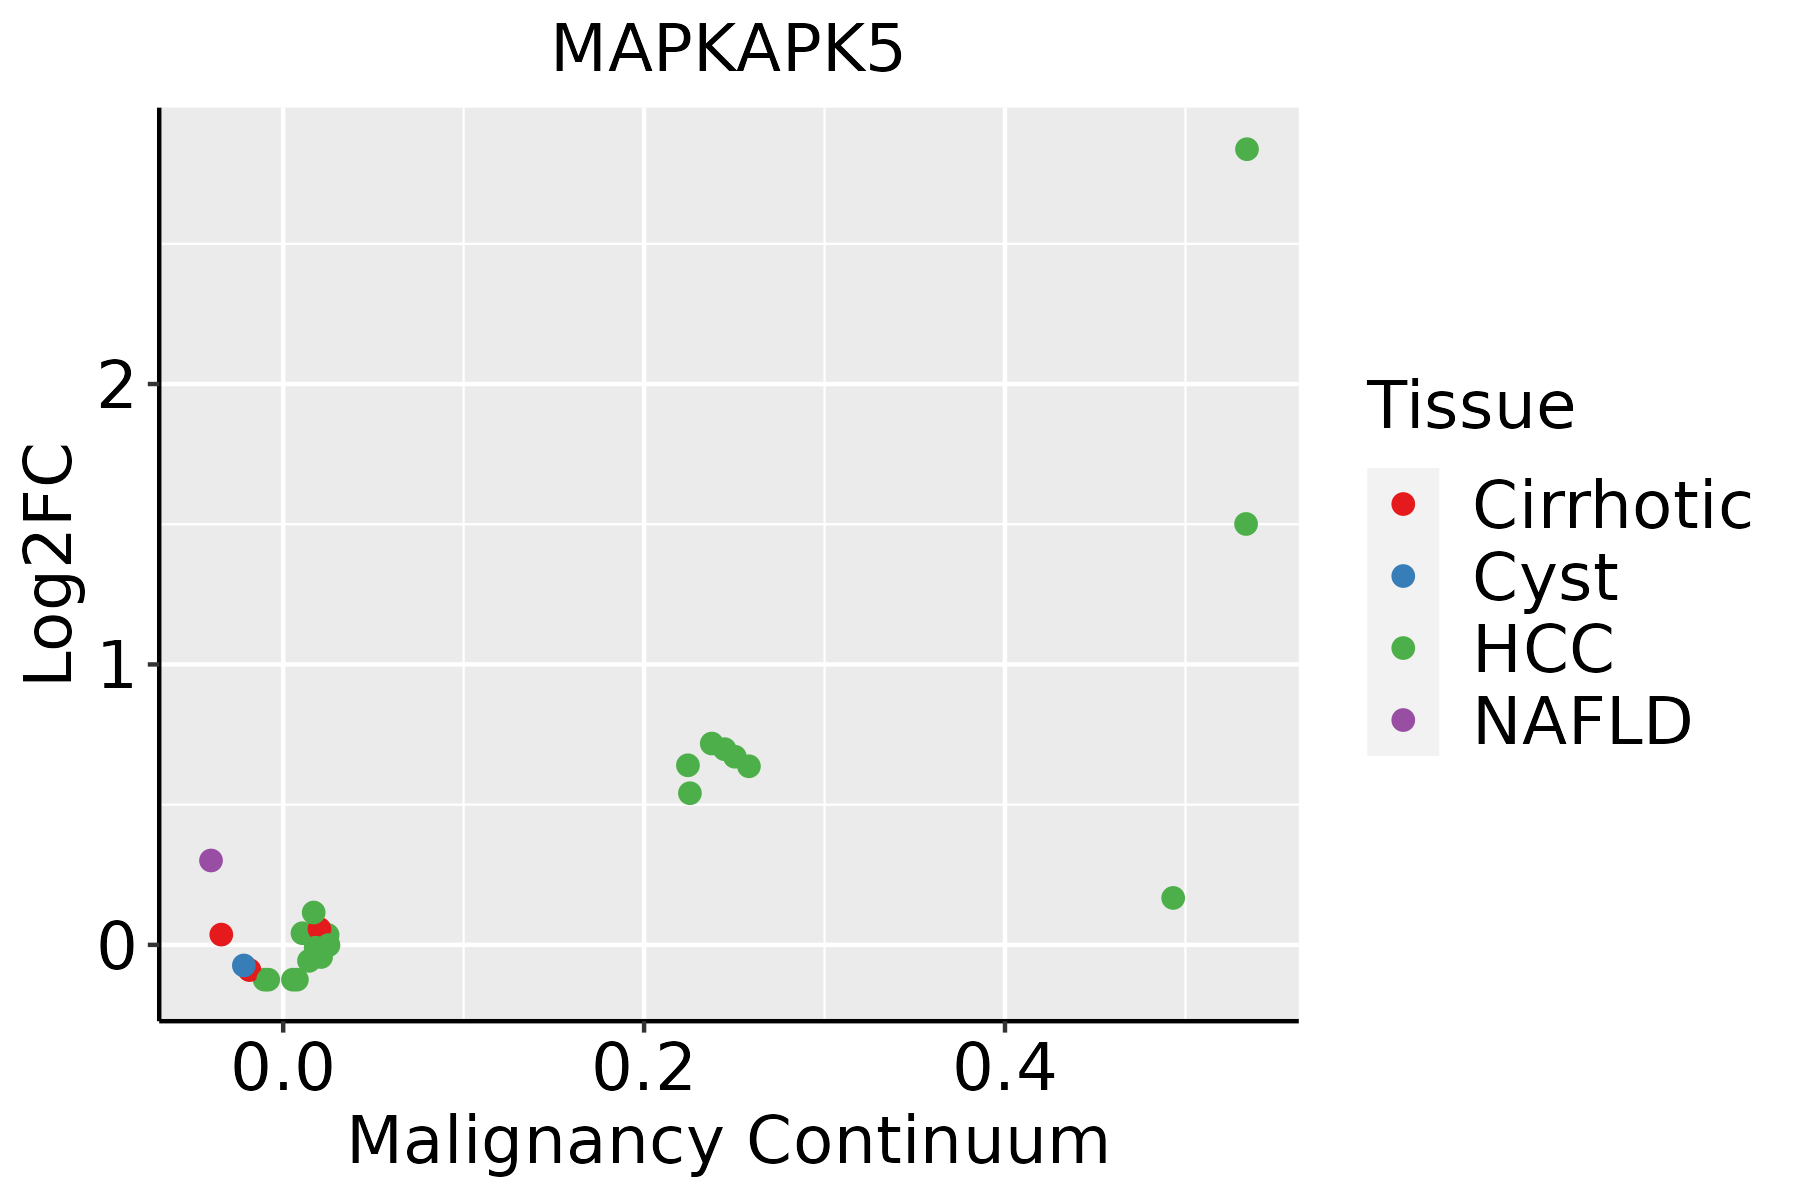 | HCC: Hepatocellular carcinoma |
| NAFLD: Non-alcoholic fatty liver disease | ||
| Oral Cavity | 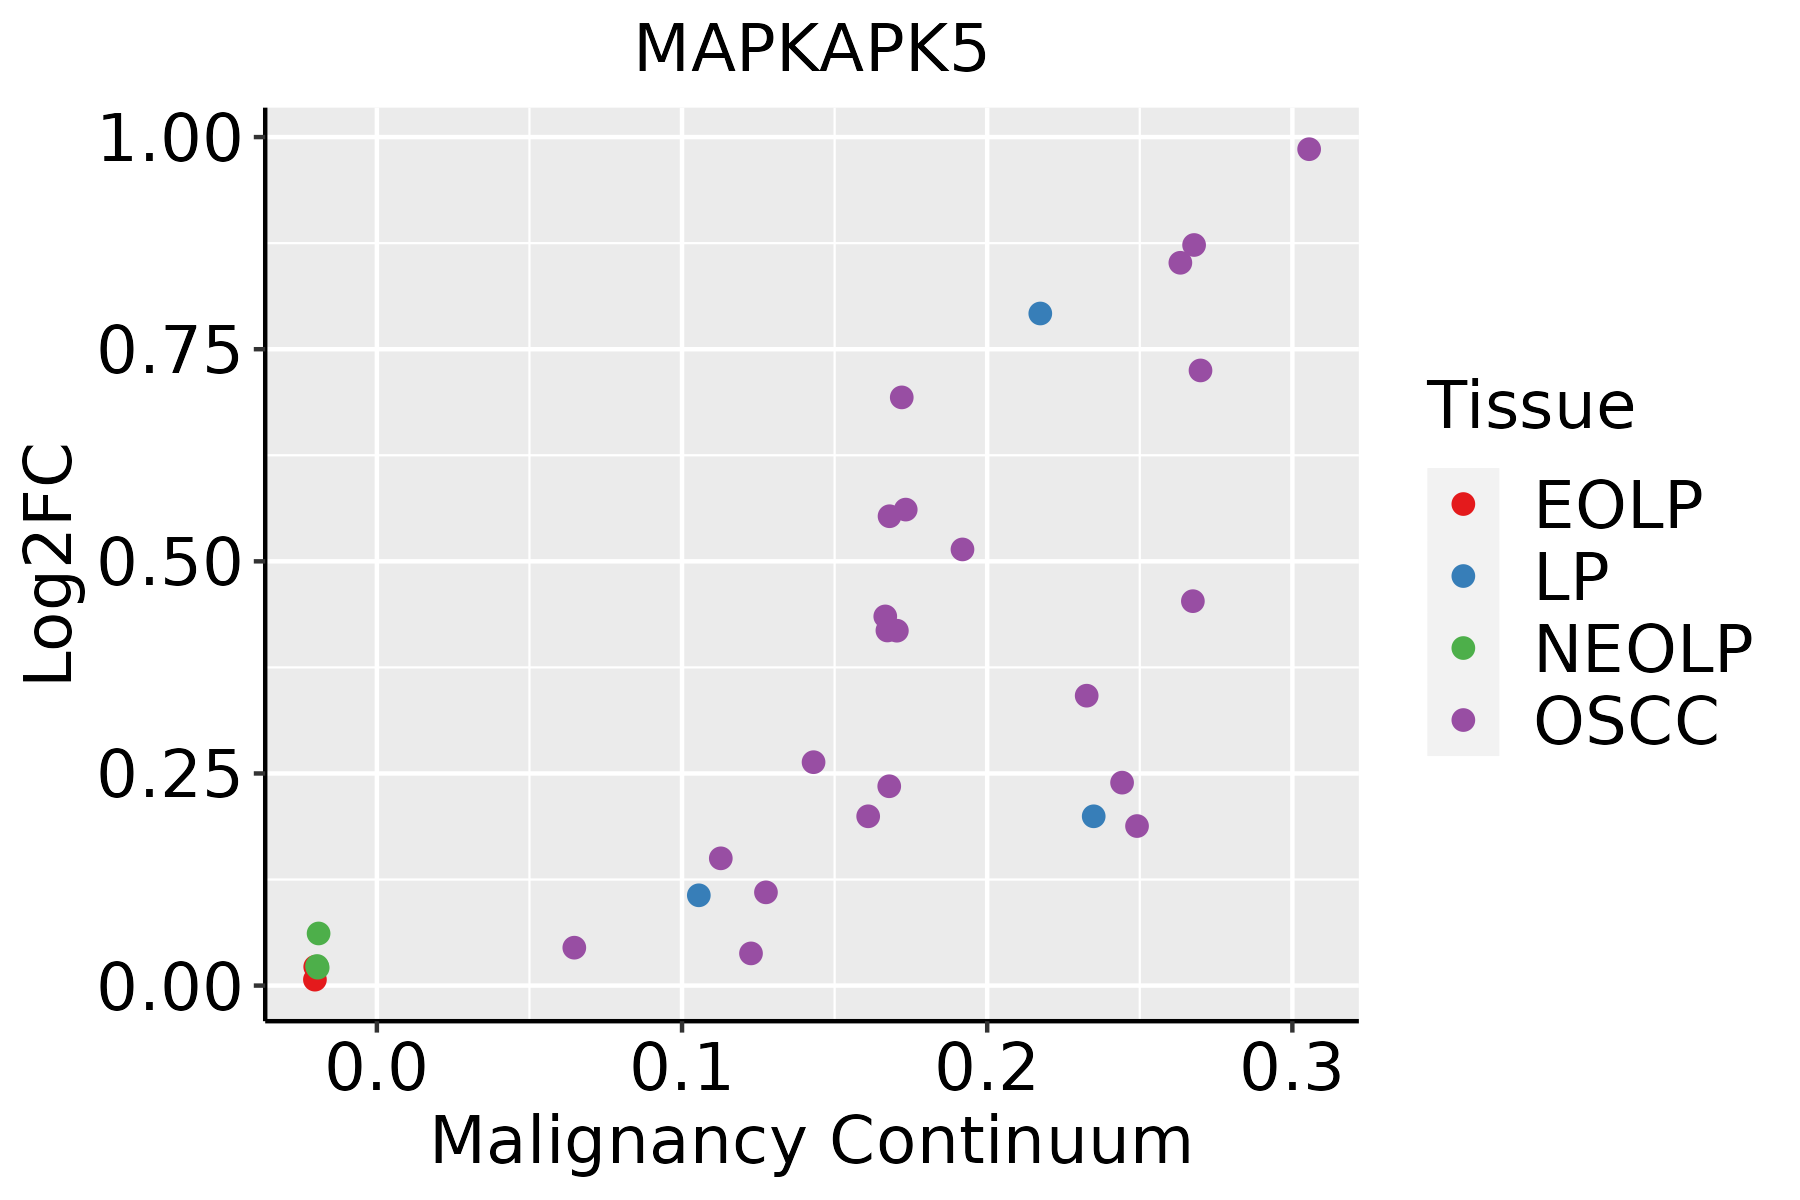 | EOLP: Erosive Oral lichen planus |
| LP: leukoplakia | ||
| NEOLP: Non-erosive oral lichen planus | ||
| OSCC: Oral squamous cell carcinoma | ||
| Skin | 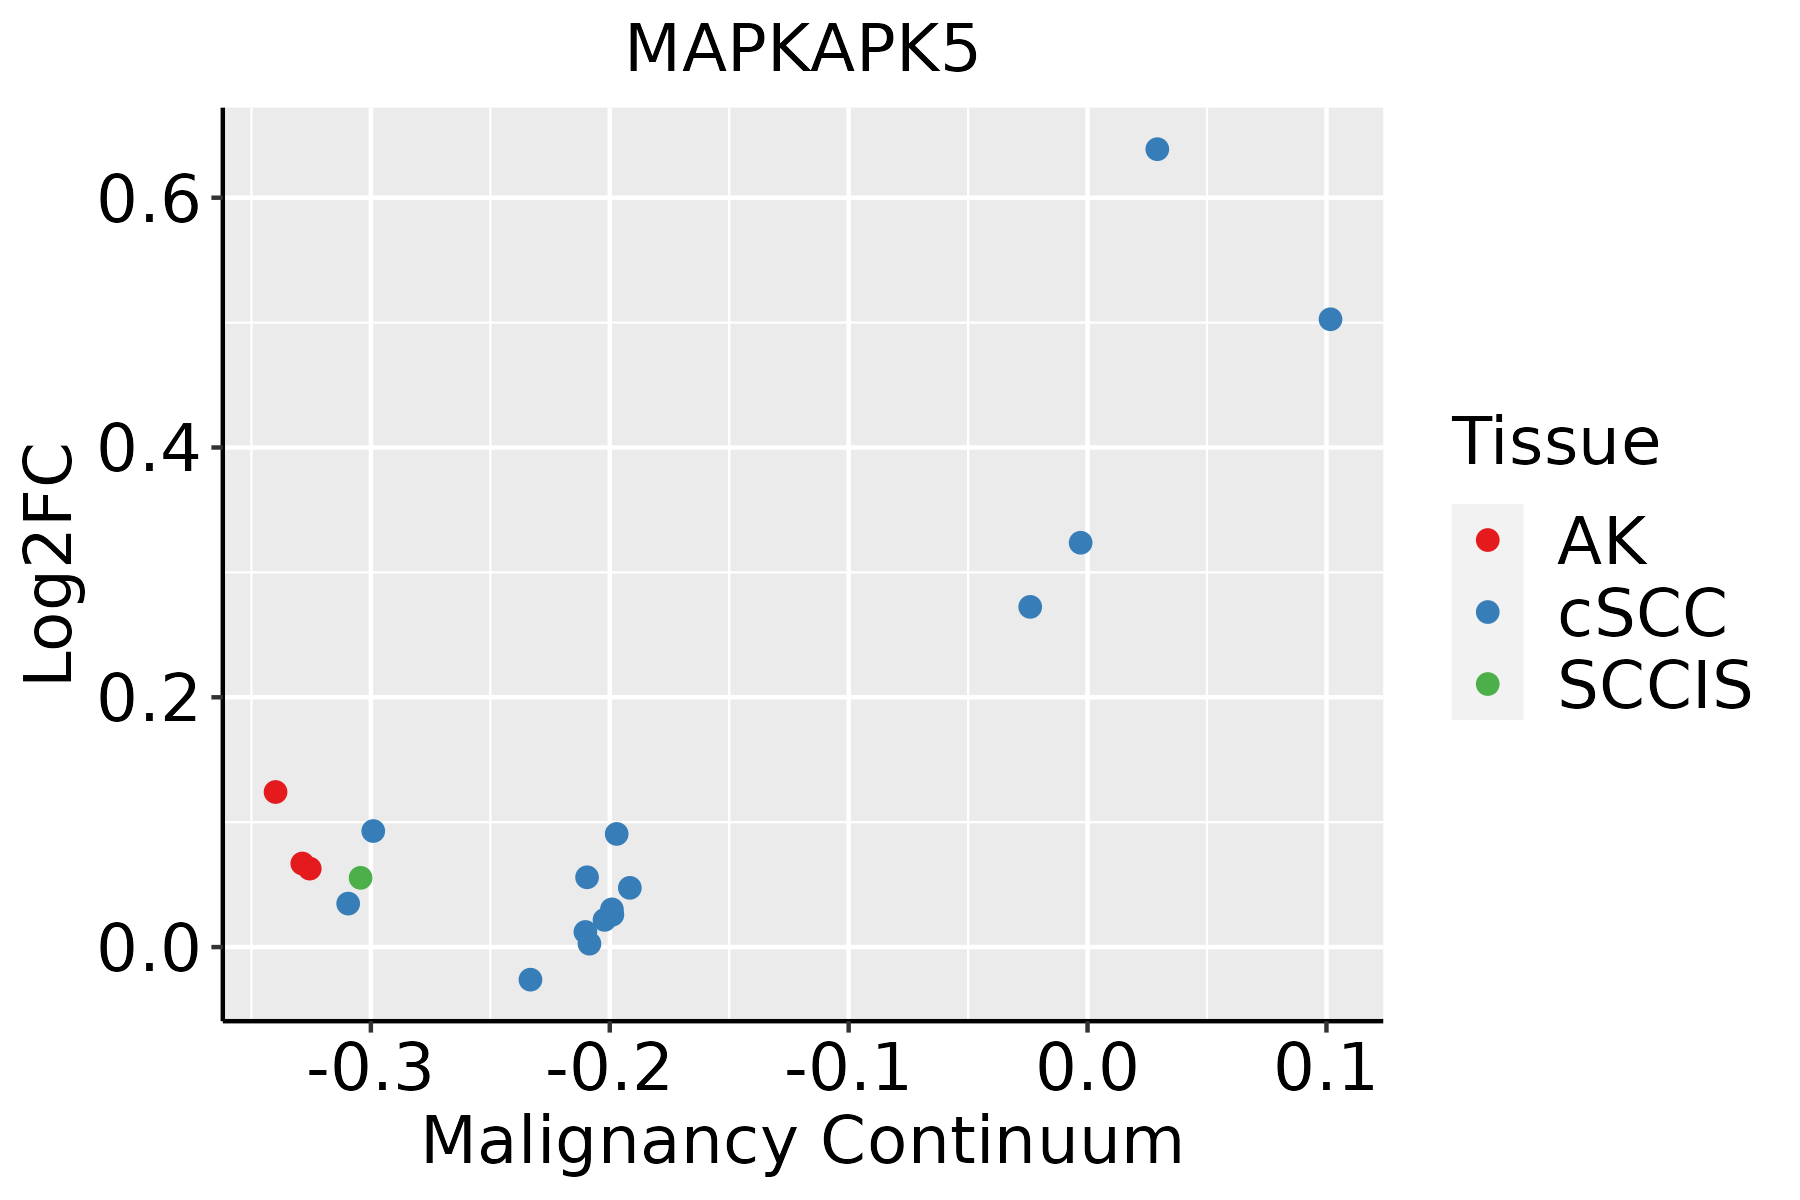 | AK: Actinic keratosis |
| cSCC: Cutaneous squamous cell carcinoma | ||
| SCCIS:squamous cell carcinoma in situ |
| ∗log2FC in expression of this searched gene in stem-like cells from each diseased tissue sample relative to stem-like cells in normal samples in each tissue plotted against the malignancy continuum. Samples are colored based on if they are from different disease stage. |
Top |
Malignant transformation related pathway analysis |
| Find out the enriched GO biological processes and KEGG pathways involved in transition from healthy to precancer to cancer |
| Tissue | Disease Stage | Enriched GO biological Processes |
| Colorectum | AD |  |
| Colorectum | SER |  |
| Colorectum | MSS |  |
| Colorectum | MSI-H |  |
| Colorectum | FAP |  |
| ∗Top 15 enriched GO BP terms are showed in the bar plot of each disease state in each tissue. Each row represents a significant GO biological process which is colored according to the -log10(p.adjust). |
| Page: 1 2 3 4 5 6 7 8 9 |
| GO ID | Tissue | Disease Stage | Description | Gene Ratio | Bg Ratio | pvalue | p.adjust | Count |
| GO:000756819 | Oral cavity | LP | aging | 125/4623 | 339/18723 | 3.29e-07 | 9.62e-06 | 125 |
| GO:007189715 | Oral cavity | LP | DNA biosynthetic process | 71/4623 | 180/18723 | 8.04e-06 | 1.52e-04 | 71 |
| GO:005105213 | Oral cavity | LP | regulation of DNA metabolic process | 125/4623 | 359/18723 | 9.43e-06 | 1.75e-04 | 125 |
| GO:005105415 | Oral cavity | LP | positive regulation of DNA metabolic process | 77/4623 | 201/18723 | 1.20e-05 | 2.15e-04 | 77 |
| GO:1901796110 | Oral cavity | LP | regulation of signal transduction by p53 class mediator | 42/4623 | 93/18723 | 1.31e-05 | 2.33e-04 | 42 |
| GO:200027818 | Oral cavity | LP | regulation of DNA biosynthetic process | 45/4623 | 106/18723 | 4.42e-05 | 6.30e-04 | 45 |
| GO:003220415 | Oral cavity | LP | regulation of telomere maintenance | 36/4623 | 80/18723 | 5.80e-05 | 7.94e-04 | 36 |
| GO:003304415 | Oral cavity | LP | regulation of chromosome organization | 70/4623 | 187/18723 | 6.89e-05 | 9.22e-04 | 70 |
| GO:000700416 | Oral cavity | LP | telomere maintenance via telomerase | 32/4623 | 69/18723 | 7.20e-05 | 9.49e-04 | 32 |
| GO:001083317 | Oral cavity | LP | telomere maintenance via telomere lengthening | 36/4623 | 81/18723 | 7.97e-05 | 1.03e-03 | 36 |
| GO:200125217 | Oral cavity | LP | positive regulation of chromosome organization | 36/4623 | 82/18723 | 1.09e-04 | 1.31e-03 | 36 |
| GO:003220013 | Oral cavity | LP | telomere organization | 59/4623 | 159/18723 | 3.21e-04 | 3.25e-03 | 59 |
| GO:000627815 | Oral cavity | LP | RNA-dependent DNA biosynthetic process | 32/4623 | 75/18723 | 4.78e-04 | 4.49e-03 | 32 |
| GO:003220616 | Oral cavity | LP | positive regulation of telomere maintenance | 24/4623 | 52/18723 | 6.09e-04 | 5.57e-03 | 24 |
| GO:000726515 | Oral cavity | LP | Ras protein signal transduction | 109/4623 | 337/18723 | 8.44e-04 | 7.36e-03 | 109 |
| GO:200057317 | Oral cavity | LP | positive regulation of DNA biosynthetic process | 28/4623 | 66/18723 | 1.17e-03 | 9.52e-03 | 28 |
| GO:005197216 | Oral cavity | LP | regulation of telomerase activity | 21/4623 | 47/18723 | 2.17e-03 | 1.58e-02 | 21 |
| GO:190435615 | Oral cavity | LP | regulation of telomere maintenance via telomere lengthening | 25/4623 | 61/18723 | 3.68e-03 | 2.44e-02 | 25 |
| GO:003221015 | Oral cavity | LP | regulation of telomere maintenance via telomerase | 22/4623 | 53/18723 | 5.20e-03 | 3.19e-02 | 22 |
| GO:000756914 | Oral cavity | LP | cell aging | 46/4623 | 132/18723 | 5.64e-03 | 3.40e-02 | 46 |
| Page: 1 2 3 4 5 6 7 8 |
| Pathway ID | Tissue | Disease Stage | Description | Gene Ratio | Bg Ratio | pvalue | p.adjust | qvalue | Count |
| hsa0401014 | Oral cavity | OSCC | MAPK signaling pathway | 165/3704 | 302/8465 | 7.11e-05 | 2.74e-04 | 1.40e-04 | 165 |
| hsa0401015 | Oral cavity | OSCC | MAPK signaling pathway | 165/3704 | 302/8465 | 7.11e-05 | 2.74e-04 | 1.40e-04 | 165 |
| Page: 1 |
Top |
Cell-cell communication analysis |
| Identification of potential cell-cell interactions between two cell types and their ligand-receptor pairs for different disease states |
| Ligand | Receptor | LRpair | Pathway | Tissue | Disease Stage |
| Page: 1 |
Top |
Single-cell gene regulatory network inference analysis |
| Find out the significant the regulons (TFs) and the target genes of each regulon across cell types for different disease states |
| TF | Cell Type | Tissue | Disease Stage | Target Gene | RSS | Regulon Activity |
| ∗The dot plots of a searched regulon are shown for all cell subpopulations in each disease state of each tissue based on the regulon specific score inferred using pySCENIC and by calculating the average expression. |
| Page: 1 |
Top |
Somatic mutation of malignant transformation related genes |
| Annotation of somatic variants for genes involved in malignant transformation |
| Hugo Symbol | Variant Class | Variant Classification | dbSNP RS | HGVSc | HGVSp | HGVSp Short | SWISSPROT | BIOTYPE | SIFT | PolyPhen | Tumor Sample Barcode | Tissue | Histology | Sex | Age | Stage | Therapy Types | Drugs | Outcome |
| MAPKAPK5 | SNV | Missense_Mutation | novel | c.338G>T | p.Arg113Ile | p.R113I | Q8IW41 | protein_coding | deleterious(0) | possibly_damaging(0.882) | TCGA-5L-AAT1-01 | Breast | breast invasive carcinoma | Female | <65 | III/IV | Hormone Therapy | letrozol | SD |
| MAPKAPK5 | insertion | In_Frame_Ins | novel | c.271_272insTCTTTTTGAGAC | p.Glu91delinsValPheLeuArgGln | p.E91delinsVFLRQ | Q8IW41 | protein_coding | TCGA-A2-A04Y-01 | Breast | breast invasive carcinoma | Female | <65 | I/II | Chemotherapy | cytoxan | SD | ||
| MAPKAPK5 | SNV | Missense_Mutation | c.1300N>C | p.Asp434His | p.D434H | Q8IW41 | protein_coding | deleterious(0.02) | benign(0.264) | TCGA-EA-A3QE-01 | Cervix | cervical & endocervical cancer | Female | <65 | I/II | Unknown | Unknown | SD | |
| MAPKAPK5 | SNV | Missense_Mutation | novel | c.544N>C | p.Thr182Pro | p.T182P | Q8IW41 | protein_coding | deleterious(0) | probably_damaging(0.999) | TCGA-ZJ-AB0I-01 | Cervix | cervical & endocervical cancer | Female | <65 | I/II | Unknown | Unknown | SD |
| MAPKAPK5 | SNV | Missense_Mutation | rs745405567 | c.743N>A | p.Arg248Gln | p.R248Q | Q8IW41 | protein_coding | tolerated(0.4) | benign(0.051) | TCGA-A6-6649-01 | Colorectum | colon adenocarcinoma | Male | >=65 | III/IV | Chemotherapy | fluorouracil | SD |
| MAPKAPK5 | SNV | Missense_Mutation | novel | c.490N>T | p.Pro164Ser | p.P164S | Q8IW41 | protein_coding | tolerated(0.06) | possibly_damaging(0.549) | TCGA-A6-6653-01 | Colorectum | colon adenocarcinoma | Male | >=65 | I/II | Unknown | Unknown | SD |
| MAPKAPK5 | SNV | Missense_Mutation | novel | c.73A>C | p.Thr25Pro | p.T25P | Q8IW41 | protein_coding | tolerated(0.11) | possibly_damaging(0.581) | TCGA-AA-3814-01 | Colorectum | colon adenocarcinoma | Female | >=65 | I/II | Unknown | Unknown | SD |
| MAPKAPK5 | SNV | Missense_Mutation | rs773408629 | c.23A>G | p.Asp8Gly | p.D8G | Q8IW41 | protein_coding | deleterious_low_confidence(0.03) | benign(0.025) | TCGA-AA-3845-01 | Colorectum | colon adenocarcinoma | Female | >=65 | I/II | Unknown | Unknown | PD |
| MAPKAPK5 | SNV | Missense_Mutation | novel | c.409C>T | p.Arg137Trp | p.R137W | Q8IW41 | protein_coding | deleterious(0.04) | benign(0.018) | TCGA-AA-3976-01 | Colorectum | colon adenocarcinoma | Male | >=65 | III/IV | Chemotherapy | folinic | CR |
| MAPKAPK5 | SNV | Missense_Mutation | rs753238884 | c.1279N>T | p.Arg427Trp | p.R427W | Q8IW41 | protein_coding | deleterious(0.02) | possibly_damaging(0.646) | TCGA-CM-6171-01 | Colorectum | colon adenocarcinoma | Female | >=65 | I/II | Unknown | Unknown | SD |
| Page: 1 2 3 4 5 6 |
Top |
Related drugs of malignant transformation related genes |
| Identification of chemicals and drugs interact with genes involved in malignant transfromation |
| (DGIdb 4.0) |
| Entrez ID | Symbol | Category | Interaction Types | Drug Claim Name | Drug Name | PMIDs |
| 8550 | MAPKAPK5 | KINASE, ENZYME, DRUGGABLE GENOME, SERINE THREONINE KINASE | inhibitor | 363894142 | ||
| 8550 | MAPKAPK5 | KINASE, ENZYME, DRUGGABLE GENOME, SERINE THREONINE KINASE | inhibitor | 249565858 | ||
| 8550 | MAPKAPK5 | KINASE, ENZYME, DRUGGABLE GENOME, SERINE THREONINE KINASE | GW843682X | GW843682X | ||
| 8550 | MAPKAPK5 | KINASE, ENZYME, DRUGGABLE GENOME, SERINE THREONINE KINASE | inhibitor | CHEMBL3545338 | GLPG-0259 | |
| 8550 | MAPKAPK5 | KINASE, ENZYME, DRUGGABLE GENOME, SERINE THREONINE KINASE | GLPG0259 | GLPG-0259 | ||
| 8550 | MAPKAPK5 | KINASE, ENZYME, DRUGGABLE GENOME, SERINE THREONINE KINASE | inhibitor | 249565857 |
| Page: 1 |

Copyright 2023-Present -The University of Texas Health Science Center at Houston |