
|
|||||
|
 | |
| |
| |
| |
| |
| |
|
Gene: LTBP3 |
Gene summary for LTBP3 |
| Gene information | Species | Human | Gene symbol | LTBP3 | Gene ID | 4054 |
| Gene name | latent transforming growth factor beta binding protein 3 | |
| Gene Alias | DASS | |
| Cytomap | 11q13.1 | |
| Gene Type | protein-coding | GO ID | GO:0001501 | UniProtAcc | Q8WYU6 |
Top |
Malignant transformation analysis |
| Identification of the aberrant gene expression in precancerous and cancerous lesions by comparing the gene expression of stem-like cells in diseased tissues with normal stem cells |
| Entrez ID | Symbol | Replicates | Species | Organ | Tissue | Adj P-value | Log2FC | Malignancy |
| 4054 | LTBP3 | LZE2T | Human | Esophagus | ESCC | 3.36e-02 | 2.69e-01 | 0.082 |
| 4054 | LTBP3 | LZE4T | Human | Esophagus | ESCC | 1.18e-12 | 1.92e-01 | 0.0811 |
| 4054 | LTBP3 | LZE20T | Human | Esophagus | ESCC | 2.28e-13 | 6.39e-01 | 0.0662 |
| 4054 | LTBP3 | LZE22T | Human | Esophagus | ESCC | 1.96e-08 | 5.19e-01 | 0.068 |
| 4054 | LTBP3 | LZE24T | Human | Esophagus | ESCC | 1.18e-10 | 3.80e-01 | 0.0596 |
| 4054 | LTBP3 | P1T-E | Human | Esophagus | ESCC | 4.58e-15 | 8.46e-01 | 0.0875 |
| 4054 | LTBP3 | P2T-E | Human | Esophagus | ESCC | 2.14e-14 | 2.41e-01 | 0.1177 |
| 4054 | LTBP3 | P4T-E | Human | Esophagus | ESCC | 3.10e-42 | 1.09e+00 | 0.1323 |
| 4054 | LTBP3 | P5T-E | Human | Esophagus | ESCC | 2.41e-72 | 1.73e+00 | 0.1327 |
| 4054 | LTBP3 | P8T-E | Human | Esophagus | ESCC | 9.44e-68 | 1.21e+00 | 0.0889 |
| 4054 | LTBP3 | P9T-E | Human | Esophagus | ESCC | 4.73e-21 | 4.68e-01 | 0.1131 |
| 4054 | LTBP3 | P10T-E | Human | Esophagus | ESCC | 4.51e-55 | 1.17e+00 | 0.116 |
| 4054 | LTBP3 | P11T-E | Human | Esophagus | ESCC | 5.38e-11 | 8.03e-01 | 0.1426 |
| 4054 | LTBP3 | P12T-E | Human | Esophagus | ESCC | 5.31e-38 | 6.64e-01 | 0.1122 |
| 4054 | LTBP3 | P15T-E | Human | Esophagus | ESCC | 2.98e-34 | 8.06e-01 | 0.1149 |
| 4054 | LTBP3 | P16T-E | Human | Esophagus | ESCC | 9.95e-19 | 3.55e-01 | 0.1153 |
| 4054 | LTBP3 | P17T-E | Human | Esophagus | ESCC | 4.65e-15 | 5.62e-01 | 0.1278 |
| 4054 | LTBP3 | P19T-E | Human | Esophagus | ESCC | 2.29e-06 | 7.83e-01 | 0.1662 |
| 4054 | LTBP3 | P20T-E | Human | Esophagus | ESCC | 1.41e-28 | 6.20e-01 | 0.1124 |
| 4054 | LTBP3 | P21T-E | Human | Esophagus | ESCC | 1.42e-61 | 1.48e+00 | 0.1617 |
| Page: 1 2 3 4 5 6 |
| Tissue | Expression Dynamics | Abbreviation |
| Esophagus | 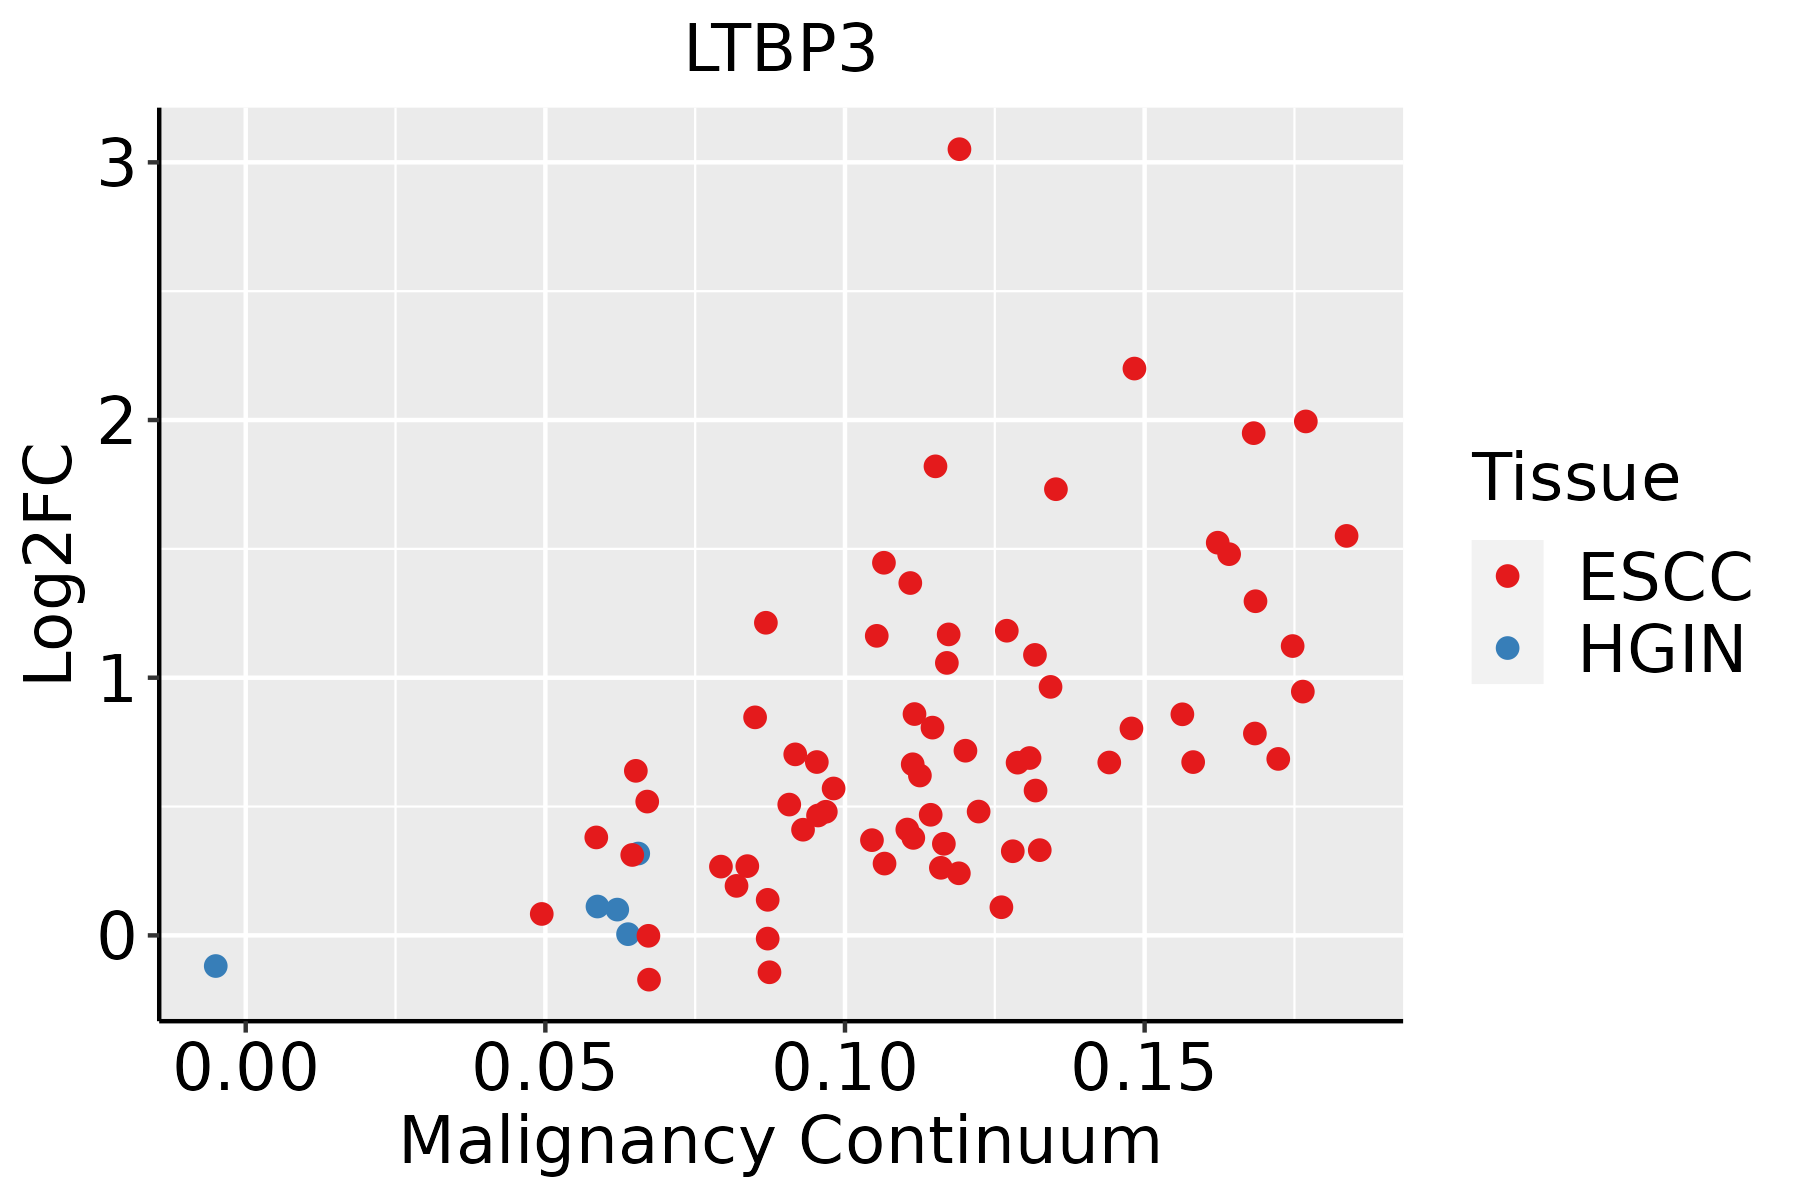 | ESCC: Esophageal squamous cell carcinoma |
| HGIN: High-grade intraepithelial neoplasias | ||
| LGIN: Low-grade intraepithelial neoplasias | ||
| Liver | 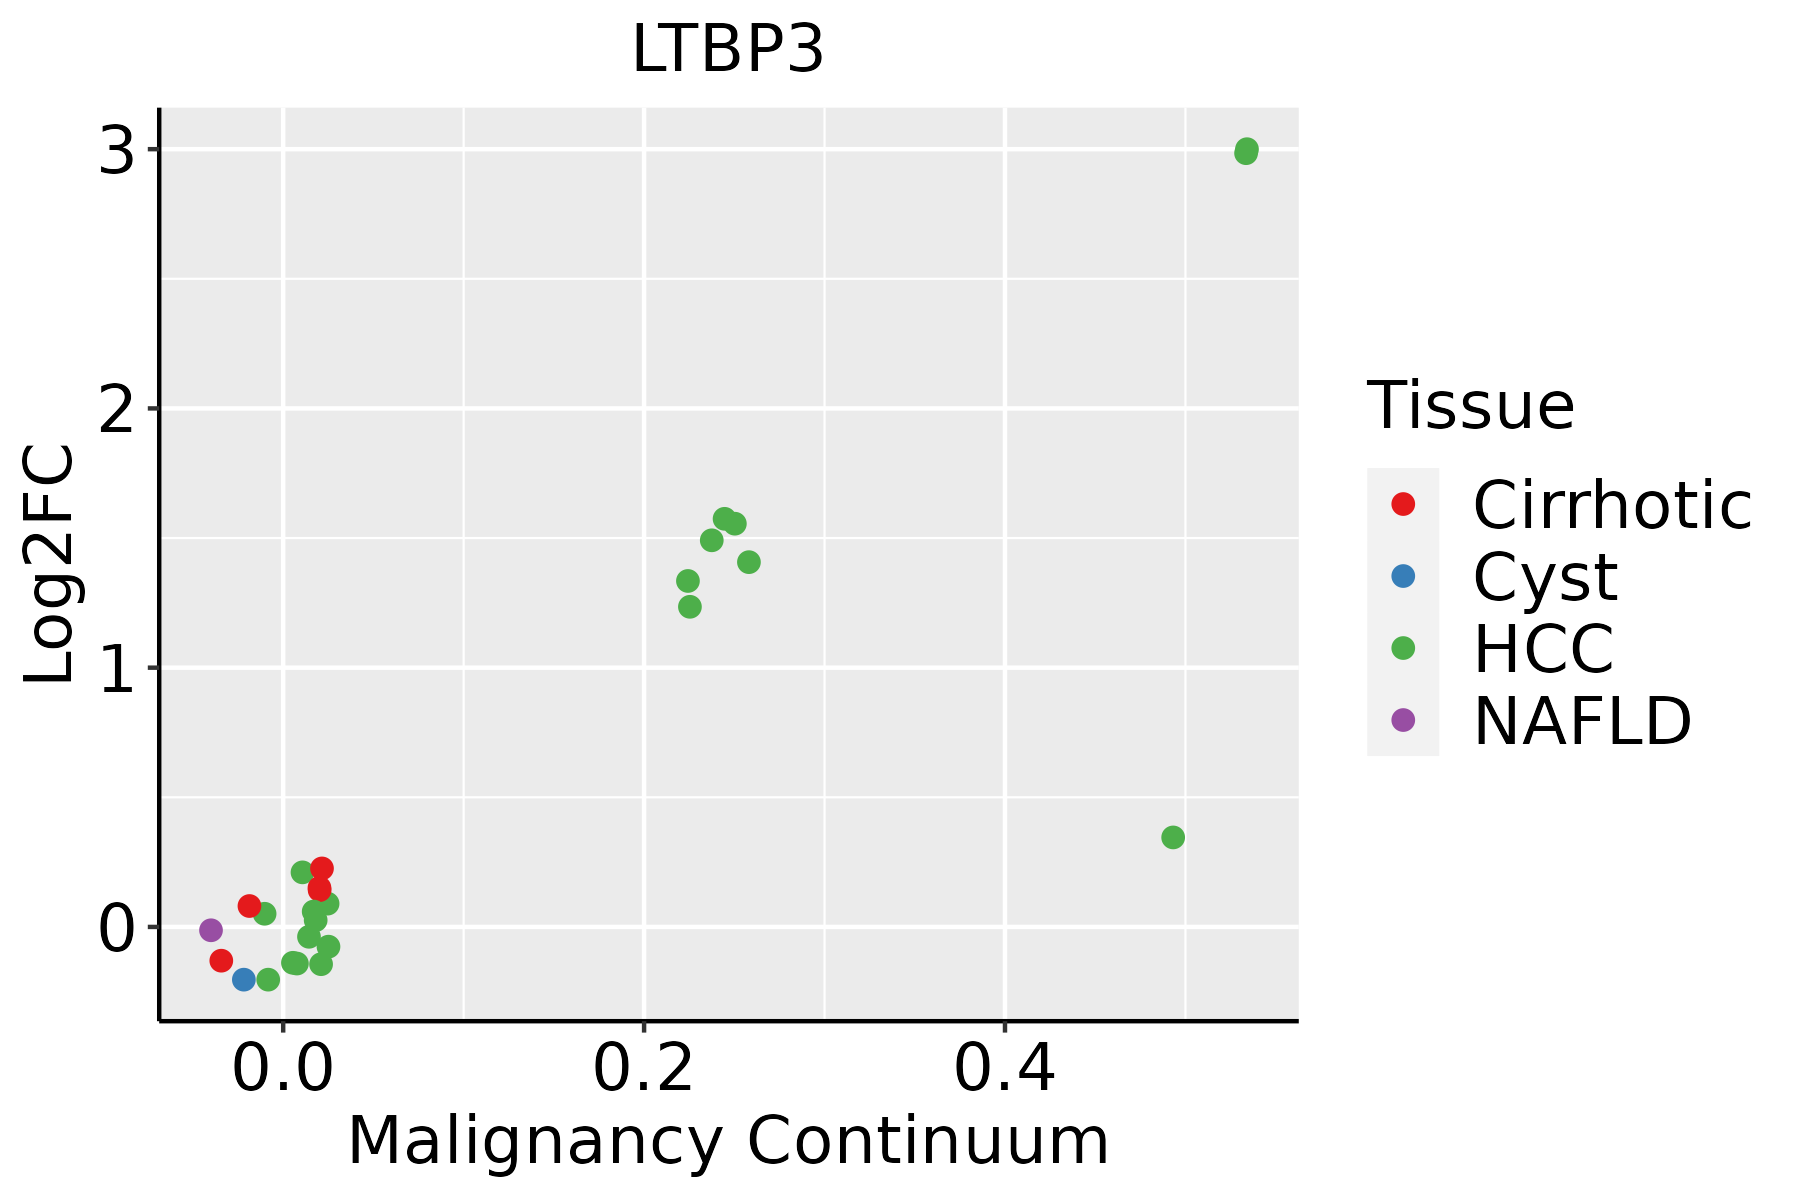 | HCC: Hepatocellular carcinoma |
| NAFLD: Non-alcoholic fatty liver disease | ||
| Oral Cavity | 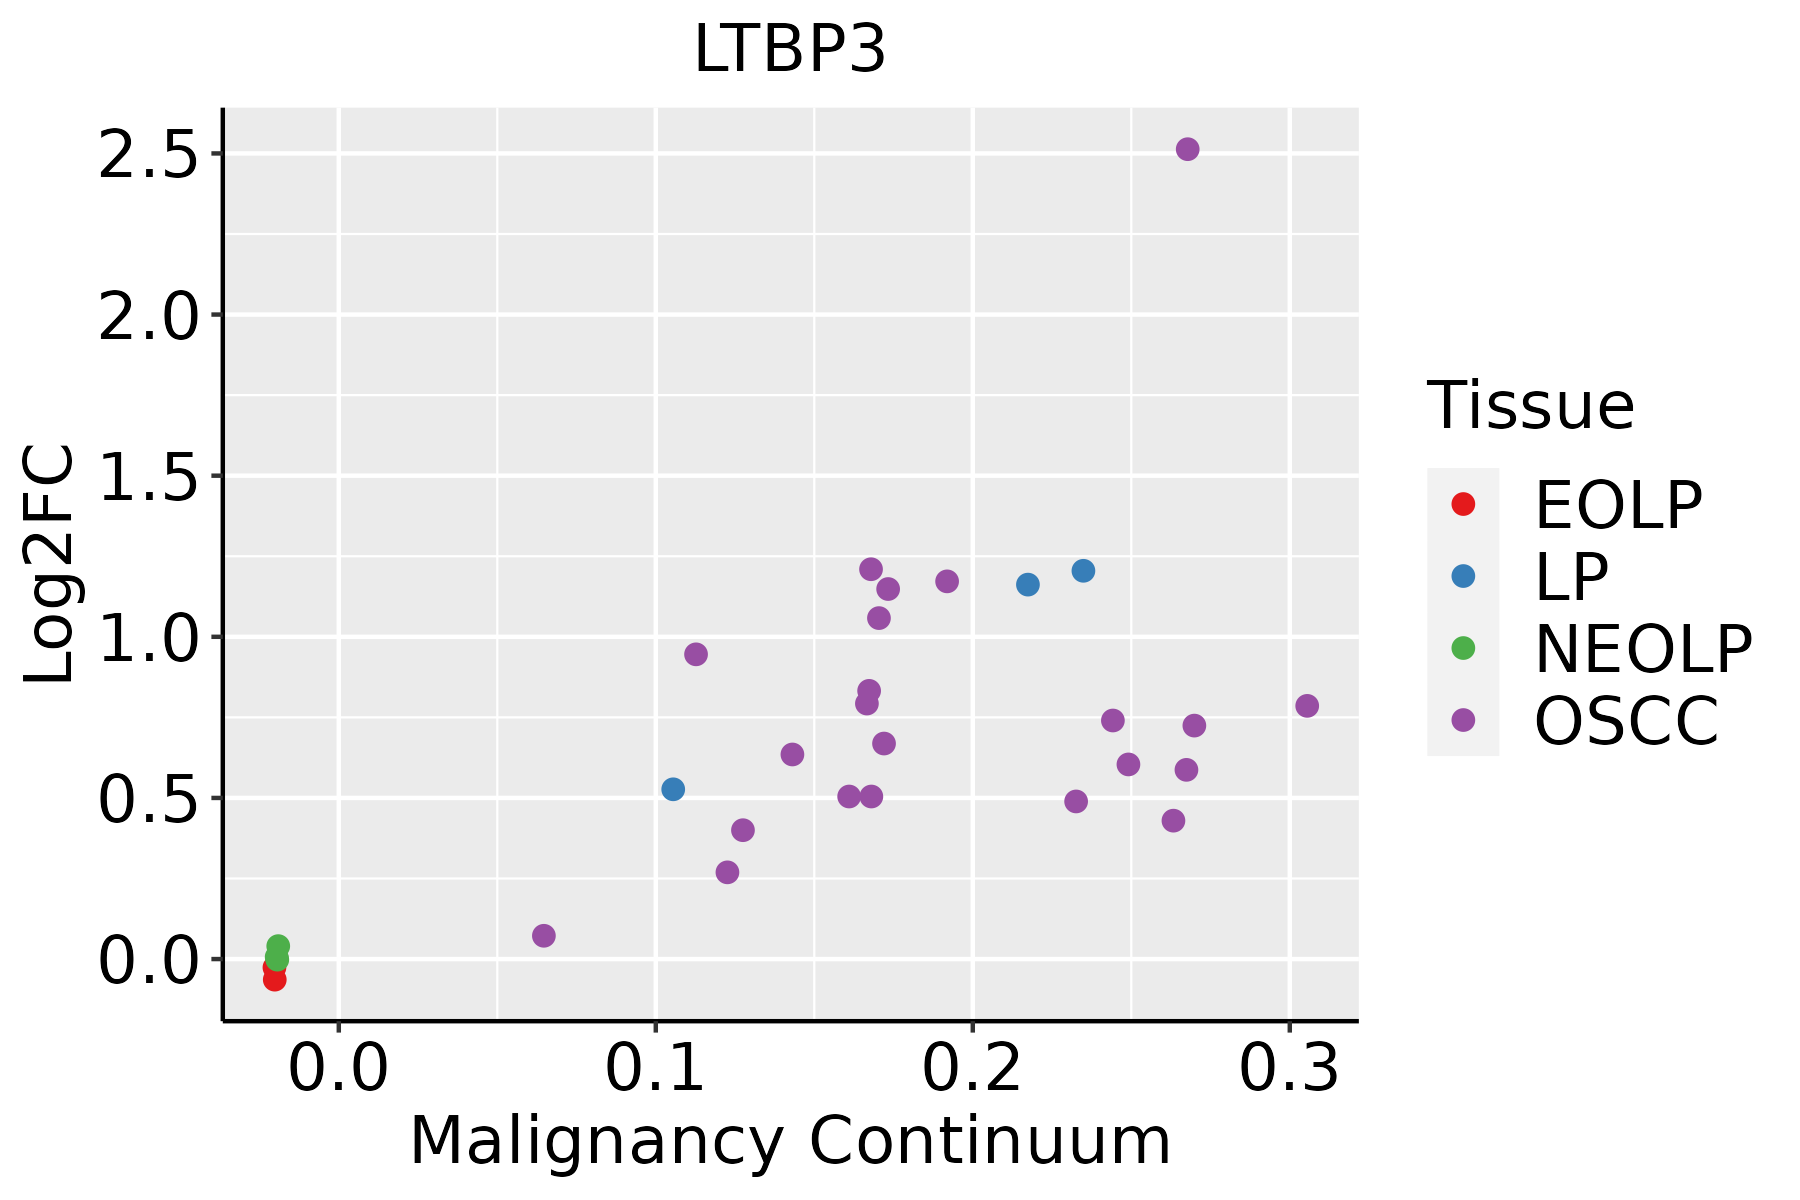 | EOLP: Erosive Oral lichen planus |
| LP: leukoplakia | ||
| NEOLP: Non-erosive oral lichen planus | ||
| OSCC: Oral squamous cell carcinoma | ||
| Skin | 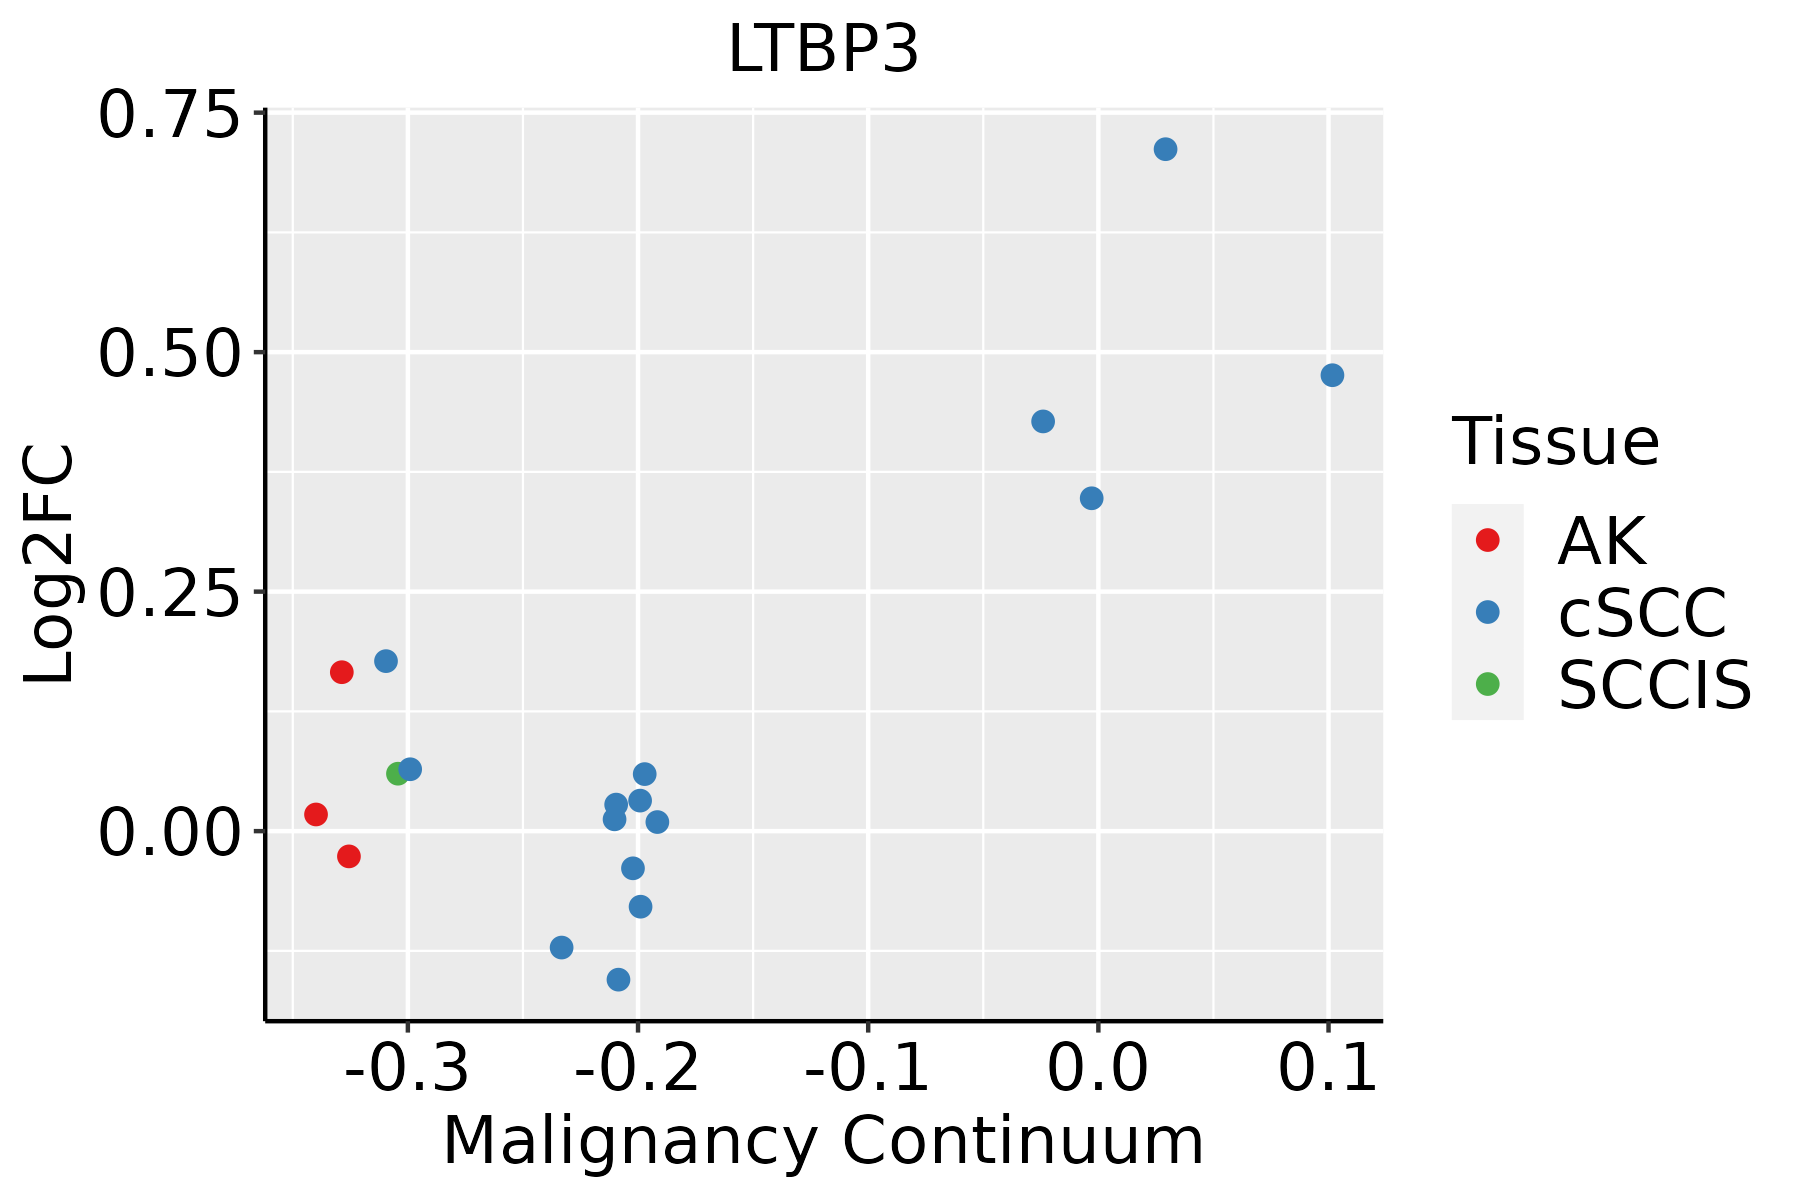 | AK: Actinic keratosis |
| cSCC: Cutaneous squamous cell carcinoma | ||
| SCCIS:squamous cell carcinoma in situ | ||
| Thyroid |  | ATC: Anaplastic thyroid cancer |
| HT: Hashimoto's thyroiditis | ||
| PTC: Papillary thyroid cancer |
| ∗log2FC in expression of this searched gene in stem-like cells from each diseased tissue sample relative to stem-like cells in normal samples in each tissue plotted against the malignancy continuum. Samples are colored based on if they are from different disease stage. |
Top |
Malignant transformation related pathway analysis |
| Find out the enriched GO biological processes and KEGG pathways involved in transition from healthy to precancer to cancer |
| Tissue | Disease Stage | Enriched GO biological Processes |
| Colorectum | AD |  |
| Colorectum | SER |  |
| Colorectum | MSS |  |
| Colorectum | MSI-H |  |
| Colorectum | FAP |  |
| ∗Top 15 enriched GO BP terms are showed in the bar plot of each disease state in each tissue. Each row represents a significant GO biological process which is colored according to the -log10(p.adjust). |
| Page: 1 2 3 4 5 6 7 8 9 |
| GO ID | Tissue | Disease Stage | Description | Gene Ratio | Bg Ratio | pvalue | p.adjust | Count |
| GO:004886321 | Thyroid | ATC | stem cell differentiation | 97/6293 | 206/18723 | 3.88e-05 | 3.15e-04 | 97 |
| GO:0060349 | Thyroid | ATC | bone morphogenesis | 50/6293 | 93/18723 | 4.87e-05 | 3.88e-04 | 50 |
| GO:008502911 | Thyroid | ATC | extracellular matrix assembly | 28/6293 | 45/18723 | 7.91e-05 | 5.95e-04 | 28 |
| GO:00487053 | Thyroid | ATC | skeletal system morphogenesis | 101/6293 | 220/18723 | 9.48e-05 | 6.93e-04 | 101 |
| GO:00020624 | Thyroid | ATC | chondrocyte differentiation | 54/6293 | 106/18723 | 1.67e-04 | 1.14e-03 | 54 |
| GO:00614484 | Thyroid | ATC | connective tissue development | 112/6293 | 252/18723 | 2.08e-04 | 1.38e-03 | 112 |
| GO:200073616 | Thyroid | ATC | regulation of stem cell differentiation | 33/6293 | 58/18723 | 2.25e-04 | 1.46e-03 | 33 |
| GO:007160422 | Thyroid | ATC | transforming growth factor beta production | 25/6293 | 43/18723 | 8.24e-04 | 4.53e-03 | 25 |
| GO:00487715 | Thyroid | ATC | tissue remodeling | 78/6293 | 175/18723 | 1.60e-03 | 8.04e-03 | 78 |
| GO:00363631 | Thyroid | ATC | transforming growth factor beta activation | 8/6293 | 10/18723 | 3.60e-03 | 1.58e-02 | 8 |
| GO:00512163 | Thyroid | ATC | cartilage development | 81/6293 | 190/18723 | 5.70e-03 | 2.30e-02 | 81 |
| GO:01101492 | Thyroid | ATC | regulation of biomineralization | 45/6293 | 99/18723 | 9.34e-03 | 3.44e-02 | 45 |
| GO:00701672 | Thyroid | ATC | regulation of biomineral tissue development | 44/6293 | 97/18723 | 1.05e-02 | 3.81e-02 | 44 |
| GO:00468491 | Thyroid | ATC | bone remodeling | 41/6293 | 90/18723 | 1.21e-02 | 4.30e-02 | 41 |
| GO:0030500 | Thyroid | ATC | regulation of bone mineralization | 36/6293 | 78/18723 | 1.43e-02 | 4.92e-02 | 36 |
| Page: 1 2 3 4 5 6 |
| Pathway ID | Tissue | Disease Stage | Description | Gene Ratio | Bg Ratio | pvalue | p.adjust | qvalue | Count |
| Page: 1 |
Top |
Cell-cell communication analysis |
| Identification of potential cell-cell interactions between two cell types and their ligand-receptor pairs for different disease states |
| Ligand | Receptor | LRpair | Pathway | Tissue | Disease Stage |
| Page: 1 |
Top |
Single-cell gene regulatory network inference analysis |
| Find out the significant the regulons (TFs) and the target genes of each regulon across cell types for different disease states |
| TF | Cell Type | Tissue | Disease Stage | Target Gene | RSS | Regulon Activity |
| ∗The dot plots of a searched regulon are shown for all cell subpopulations in each disease state of each tissue based on the regulon specific score inferred using pySCENIC and by calculating the average expression. |
| Page: 1 |
Top |
Somatic mutation of malignant transformation related genes |
| Annotation of somatic variants for genes involved in malignant transformation |
| Hugo Symbol | Variant Class | Variant Classification | dbSNP RS | HGVSc | HGVSp | HGVSp Short | SWISSPROT | BIOTYPE | SIFT | PolyPhen | Tumor Sample Barcode | Tissue | Histology | Sex | Age | Stage | Therapy Types | Drugs | Outcome |
| LTBP3 | SNV | Missense_Mutation | rs761955225 | c.1534G>T | p.Val512Leu | p.V512L | Q9NS15 | protein_coding | tolerated(0.16) | benign(0) | TCGA-AC-A23H-01 | Breast | breast invasive carcinoma | Female | >=65 | I/II | Unknown | Unknown | PD |
| LTBP3 | SNV | Missense_Mutation | novel | c.2171G>A | p.Ser724Asn | p.S724N | Q9NS15 | protein_coding | deleterious(0) | benign(0.149) | TCGA-C8-A12V-01 | Breast | breast invasive carcinoma | Female | <65 | I/II | Unknown | Unknown | SD |
| LTBP3 | insertion | Frame_Shift_Ins | novel | c.1998_1999insGGAGCTTCAAGTGCAT | p.Pro667GlyfsTer129 | p.P667Gfs*129 | Q9NS15 | protein_coding | TCGA-A8-A08S-01 | Breast | breast invasive carcinoma | Female | >=65 | I/II | Hormone Therapy | anastrozole | SD | ||
| LTBP3 | deletion | Frame_Shift_Del | rs752375653 | c.2216delN | p.Gly739AlafsTer7 | p.G739Afs*7 | Q9NS15 | protein_coding | TCGA-BH-A18G-01 | Breast | breast invasive carcinoma | Female | >=65 | I/II | Unknown | Unknown | SD | ||
| LTBP3 | SNV | Missense_Mutation | novel | c.1133N>A | p.Arg378His | p.R378H | Q9NS15 | protein_coding | deleterious(0) | probably_damaging(0.966) | TCGA-2W-A8YY-01 | Cervix | cervical & endocervical cancer | Female | <65 | I/II | Chemotherapy | cisplatin | CR |
| LTBP3 | SNV | Missense_Mutation | c.3115N>C | p.Glu1039Gln | p.E1039Q | Q9NS15 | protein_coding | deleterious(0) | probably_damaging(0.998) | TCGA-EK-A2PG-01 | Cervix | cervical & endocervical cancer | Female | >=65 | I/II | Unknown | Unknown | SD | |
| LTBP3 | SNV | Missense_Mutation | c.2896N>A | p.Glu966Lys | p.E966K | Q9NS15 | protein_coding | deleterious(0) | benign(0.153) | TCGA-EK-A3GK-01 | Cervix | cervical & endocervical cancer | Female | <65 | I/II | Unknown | Unknown | SD | |
| LTBP3 | SNV | Missense_Mutation | novel | c.1598N>A | p.Thr533Lys | p.T533K | Q9NS15 | protein_coding | deleterious(0.01) | benign(0.224) | TCGA-EX-A69M-01 | Cervix | cervical & endocervical cancer | Female | <65 | I/II | Unknown | Unknown | PD |
| LTBP3 | SNV | Missense_Mutation | novel | c.3643G>C | p.Glu1215Gln | p.E1215Q | Q9NS15 | protein_coding | deleterious(0.01) | probably_damaging(0.994) | TCGA-VS-A9UR-01 | Cervix | cervical & endocervical cancer | Female | <65 | I/II | Chemotherapy | cisplatin | PD |
| LTBP3 | SNV | Missense_Mutation | novel | c.1297G>A | p.Gly433Ser | p.G433S | Q9NS15 | protein_coding | deleterious(0) | probably_damaging(1) | TCGA-VS-A9V0-01 | Cervix | cervical & endocervical cancer | Female | <65 | I/II | Chemotherapy | cisplatin | PD |
| Page: 1 2 3 4 5 6 7 8 9 10 |
Top |
Related drugs of malignant transformation related genes |
| Identification of chemicals and drugs interact with genes involved in malignant transfromation |
| (DGIdb 4.0) |
| Entrez ID | Symbol | Category | Interaction Types | Drug Claim Name | Drug Name | PMIDs |
| Page: 1 |

Copyright 2023-Present -The University of Texas Health Science Center at Houston |