
|
|||||
|
 | |
| |
| |
| |
| |
| |
|
Gene: LSM14A |
Gene summary for LSM14A |
| Gene information | Species | Human | Gene symbol | LSM14A | Gene ID | 26065 |
| Gene name | LSM14A mRNA processing body assembly factor | |
| Gene Alias | C19orf13 | |
| Cytomap | 19q13.11 | |
| Gene Type | protein-coding | GO ID | GO:0000226 | UniProtAcc | Q8ND56 |
Top |
Malignant transformation analysis |
| Identification of the aberrant gene expression in precancerous and cancerous lesions by comparing the gene expression of stem-like cells in diseased tissues with normal stem cells |
| Entrez ID | Symbol | Replicates | Species | Organ | Tissue | Adj P-value | Log2FC | Malignancy |
| 26065 | LSM14A | CA_HPV_3 | Human | Cervix | CC | 1.29e-02 | 1.01e-01 | 0.0414 |
| 26065 | LSM14A | CCI_1 | Human | Cervix | CC | 1.72e-02 | 4.84e-01 | 0.528 |
| 26065 | LSM14A | CCI_2 | Human | Cervix | CC | 2.28e-06 | 7.43e-01 | 0.5249 |
| 26065 | LSM14A | CCI_3 | Human | Cervix | CC | 2.90e-04 | 6.28e-01 | 0.516 |
| 26065 | LSM14A | HTA11_3410_2000001011 | Human | Colorectum | AD | 3.75e-09 | -4.16e-01 | 0.0155 |
| 26065 | LSM14A | HTA11_99999965104_69814 | Human | Colorectum | MSS | 3.83e-02 | 4.43e-01 | 0.281 |
| 26065 | LSM14A | A001-C-207 | Human | Colorectum | FAP | 1.10e-03 | -2.48e-01 | 0.1278 |
| 26065 | LSM14A | A015-C-203 | Human | Colorectum | FAP | 1.51e-26 | -4.68e-01 | -0.1294 |
| 26065 | LSM14A | A015-C-204 | Human | Colorectum | FAP | 3.00e-08 | -2.24e-01 | -0.0228 |
| 26065 | LSM14A | A014-C-040 | Human | Colorectum | FAP | 8.16e-07 | -5.55e-01 | -0.1184 |
| 26065 | LSM14A | A002-C-201 | Human | Colorectum | FAP | 4.07e-16 | -3.64e-01 | 0.0324 |
| 26065 | LSM14A | A002-C-203 | Human | Colorectum | FAP | 1.04e-05 | -1.76e-01 | 0.2786 |
| 26065 | LSM14A | A001-C-119 | Human | Colorectum | FAP | 2.04e-08 | -3.36e-01 | -0.1557 |
| 26065 | LSM14A | A001-C-108 | Human | Colorectum | FAP | 4.55e-19 | -3.33e-01 | -0.0272 |
| 26065 | LSM14A | A002-C-205 | Human | Colorectum | FAP | 2.57e-26 | -4.64e-01 | -0.1236 |
| 26065 | LSM14A | A014-C-108 | Human | Colorectum | FAP | 2.75e-03 | -4.01e-01 | -0.124 |
| 26065 | LSM14A | A001-C-104 | Human | Colorectum | FAP | 2.27e-09 | -3.63e-01 | 0.0184 |
| 26065 | LSM14A | A015-C-005 | Human | Colorectum | FAP | 2.26e-07 | -3.65e-01 | -0.0336 |
| 26065 | LSM14A | A015-C-006 | Human | Colorectum | FAP | 4.76e-18 | -4.91e-01 | -0.0994 |
| 26065 | LSM14A | A015-C-106 | Human | Colorectum | FAP | 3.04e-11 | -2.80e-01 | -0.0511 |
| Page: 1 2 3 4 5 6 7 8 9 |
| Tissue | Expression Dynamics | Abbreviation |
| Cervix | 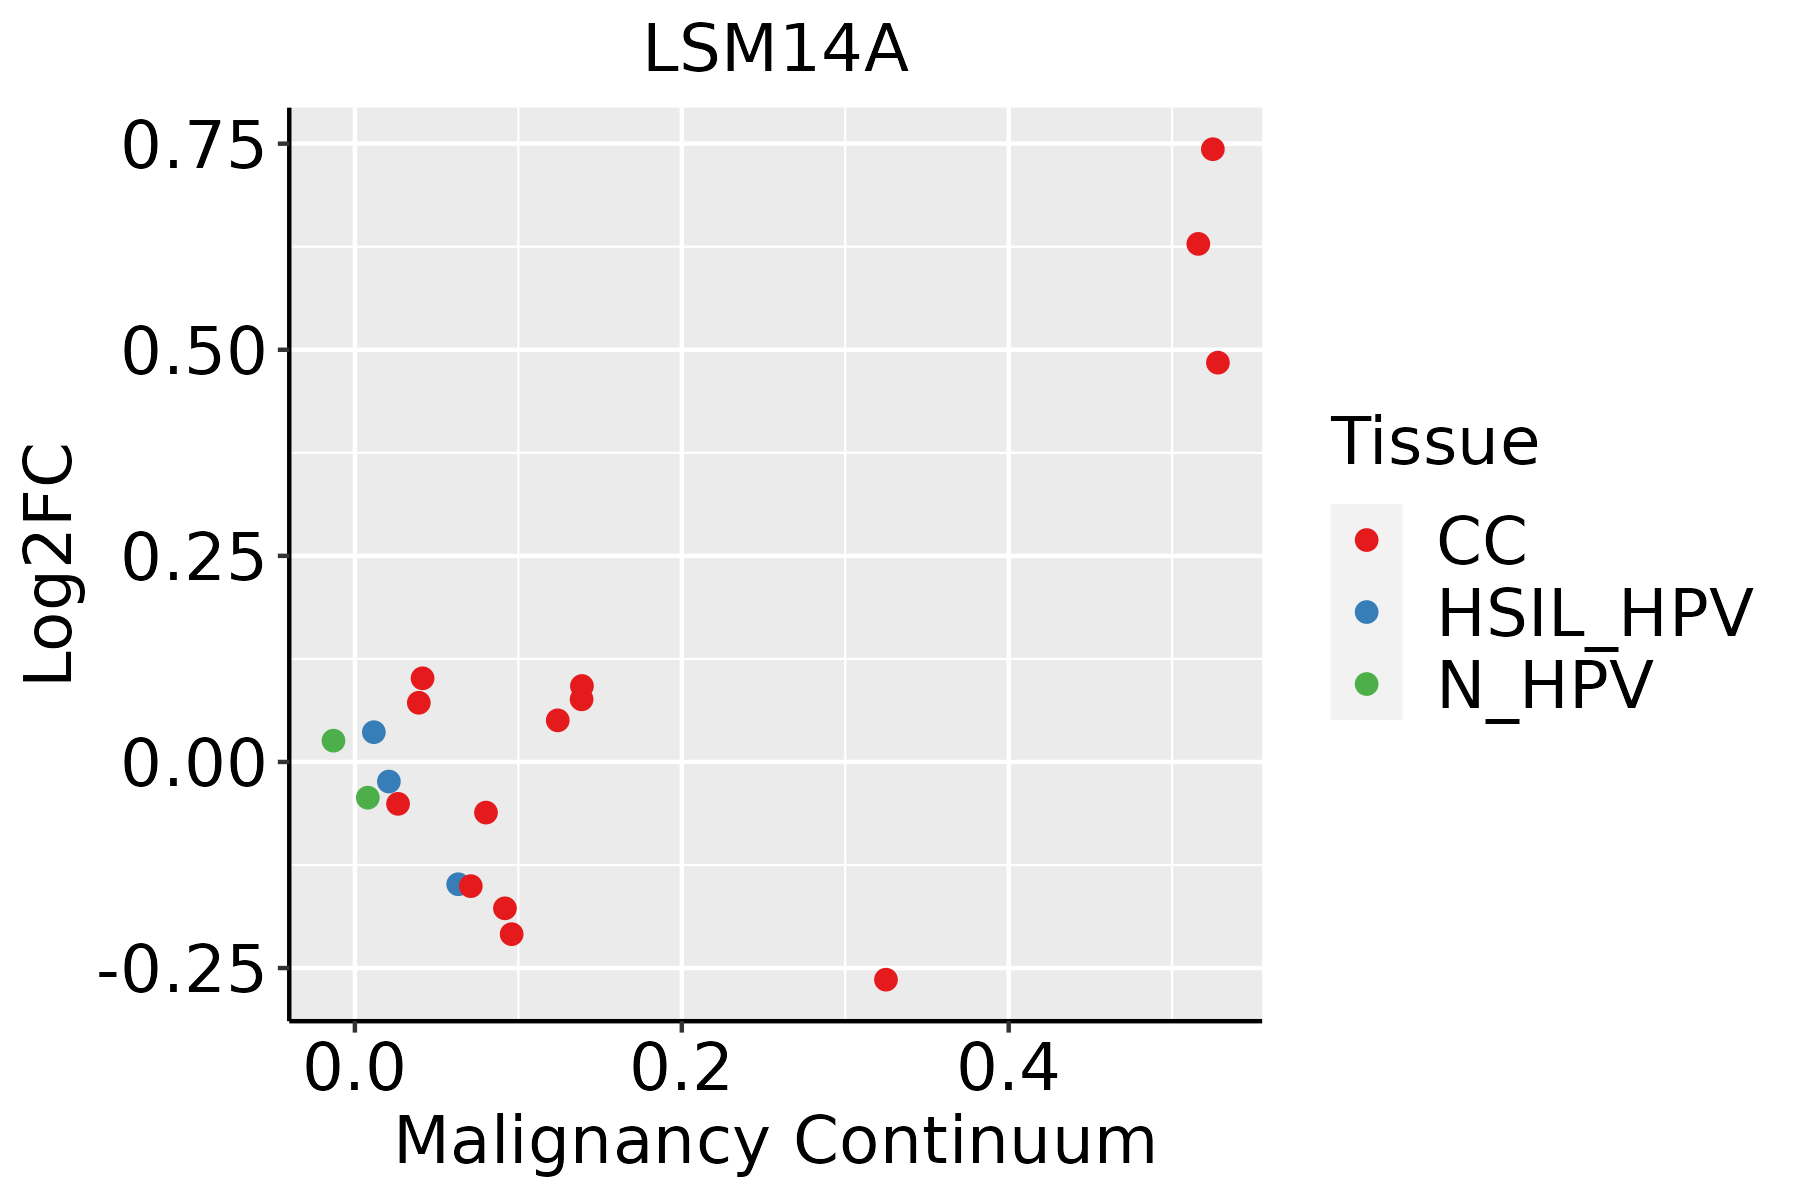 | CC: Cervix cancer |
| HSIL_HPV: HPV-infected high-grade squamous intraepithelial lesions | ||
| N_HPV: HPV-infected normal cervix | ||
| Colorectum (GSE201348) | 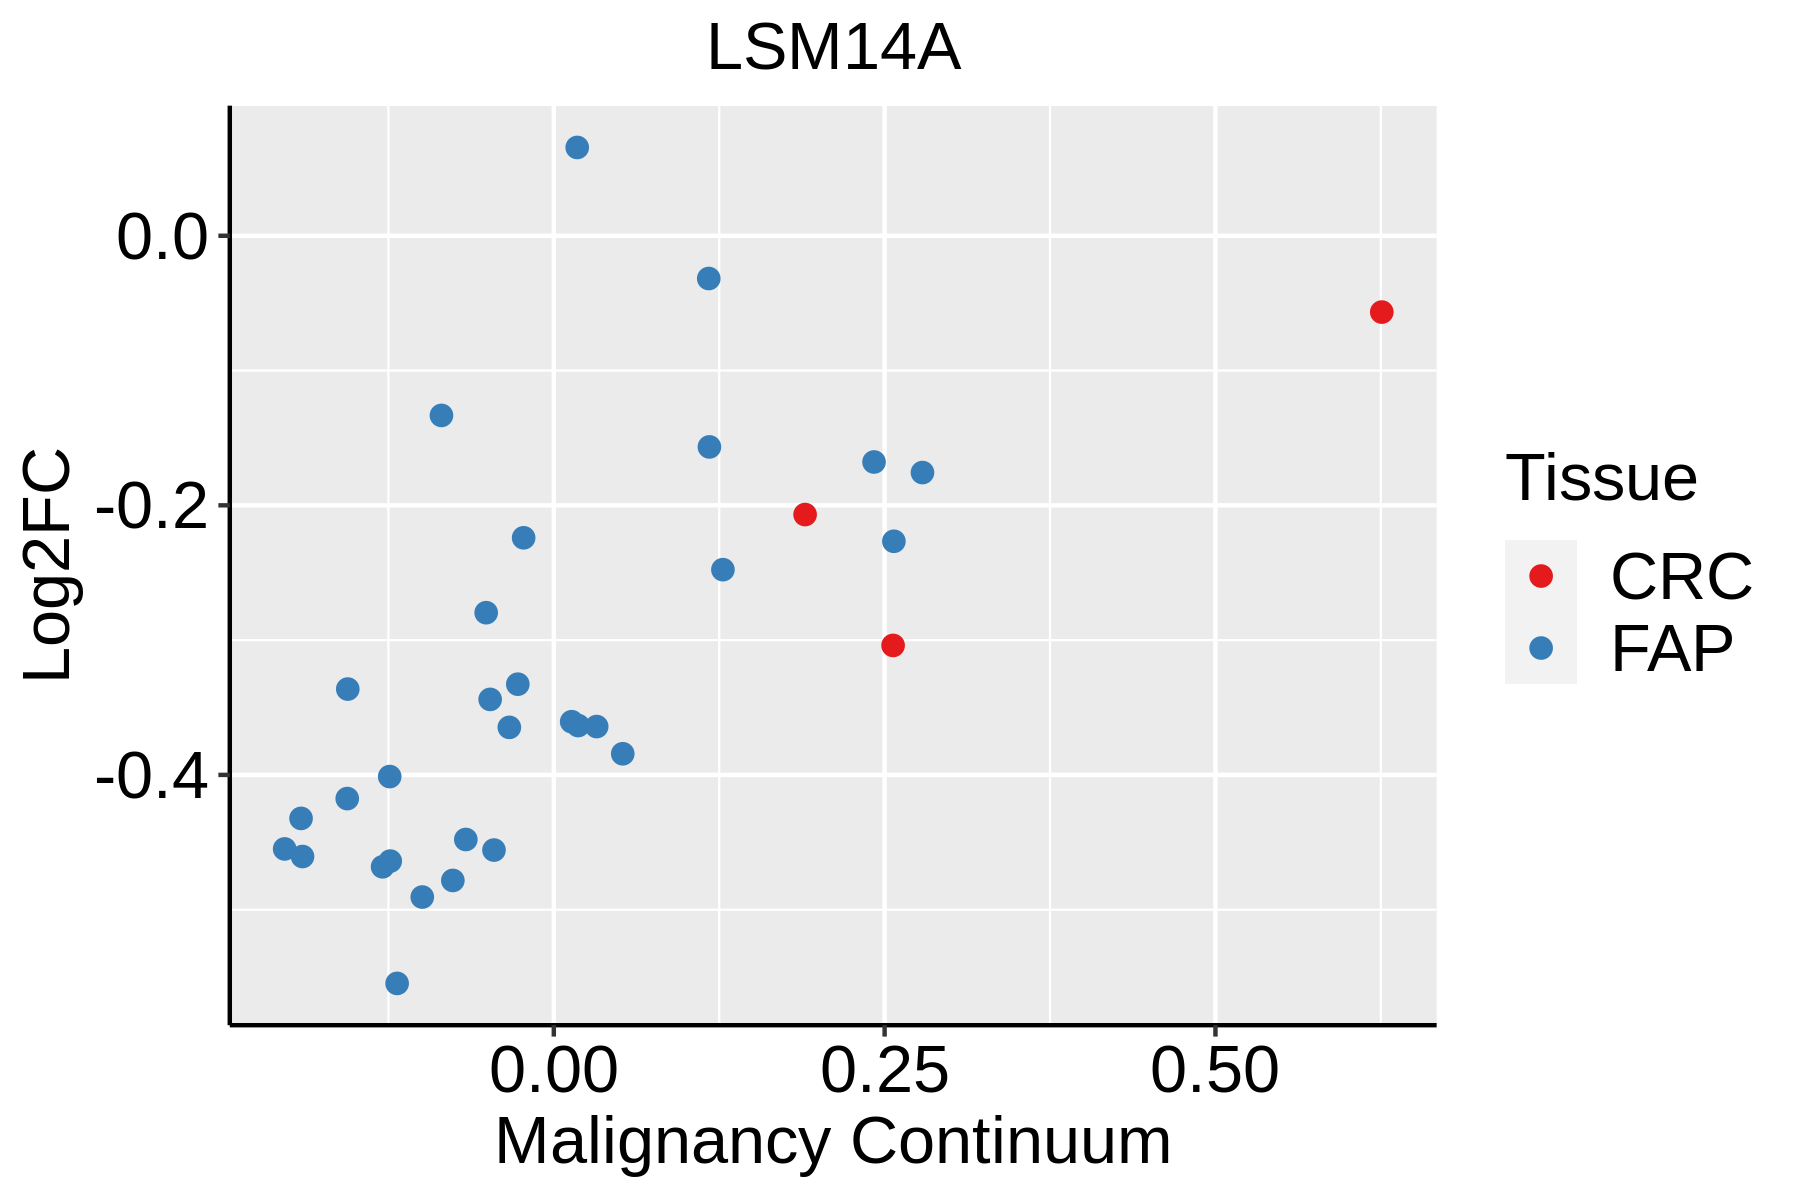 | FAP: Familial adenomatous polyposis |
| CRC: Colorectal cancer | ||
| Colorectum (HTA11) |  | AD: Adenomas |
| SER: Sessile serrated lesions | ||
| MSI-H: Microsatellite-high colorectal cancer | ||
| MSS: Microsatellite stable colorectal cancer | ||
| Esophagus | 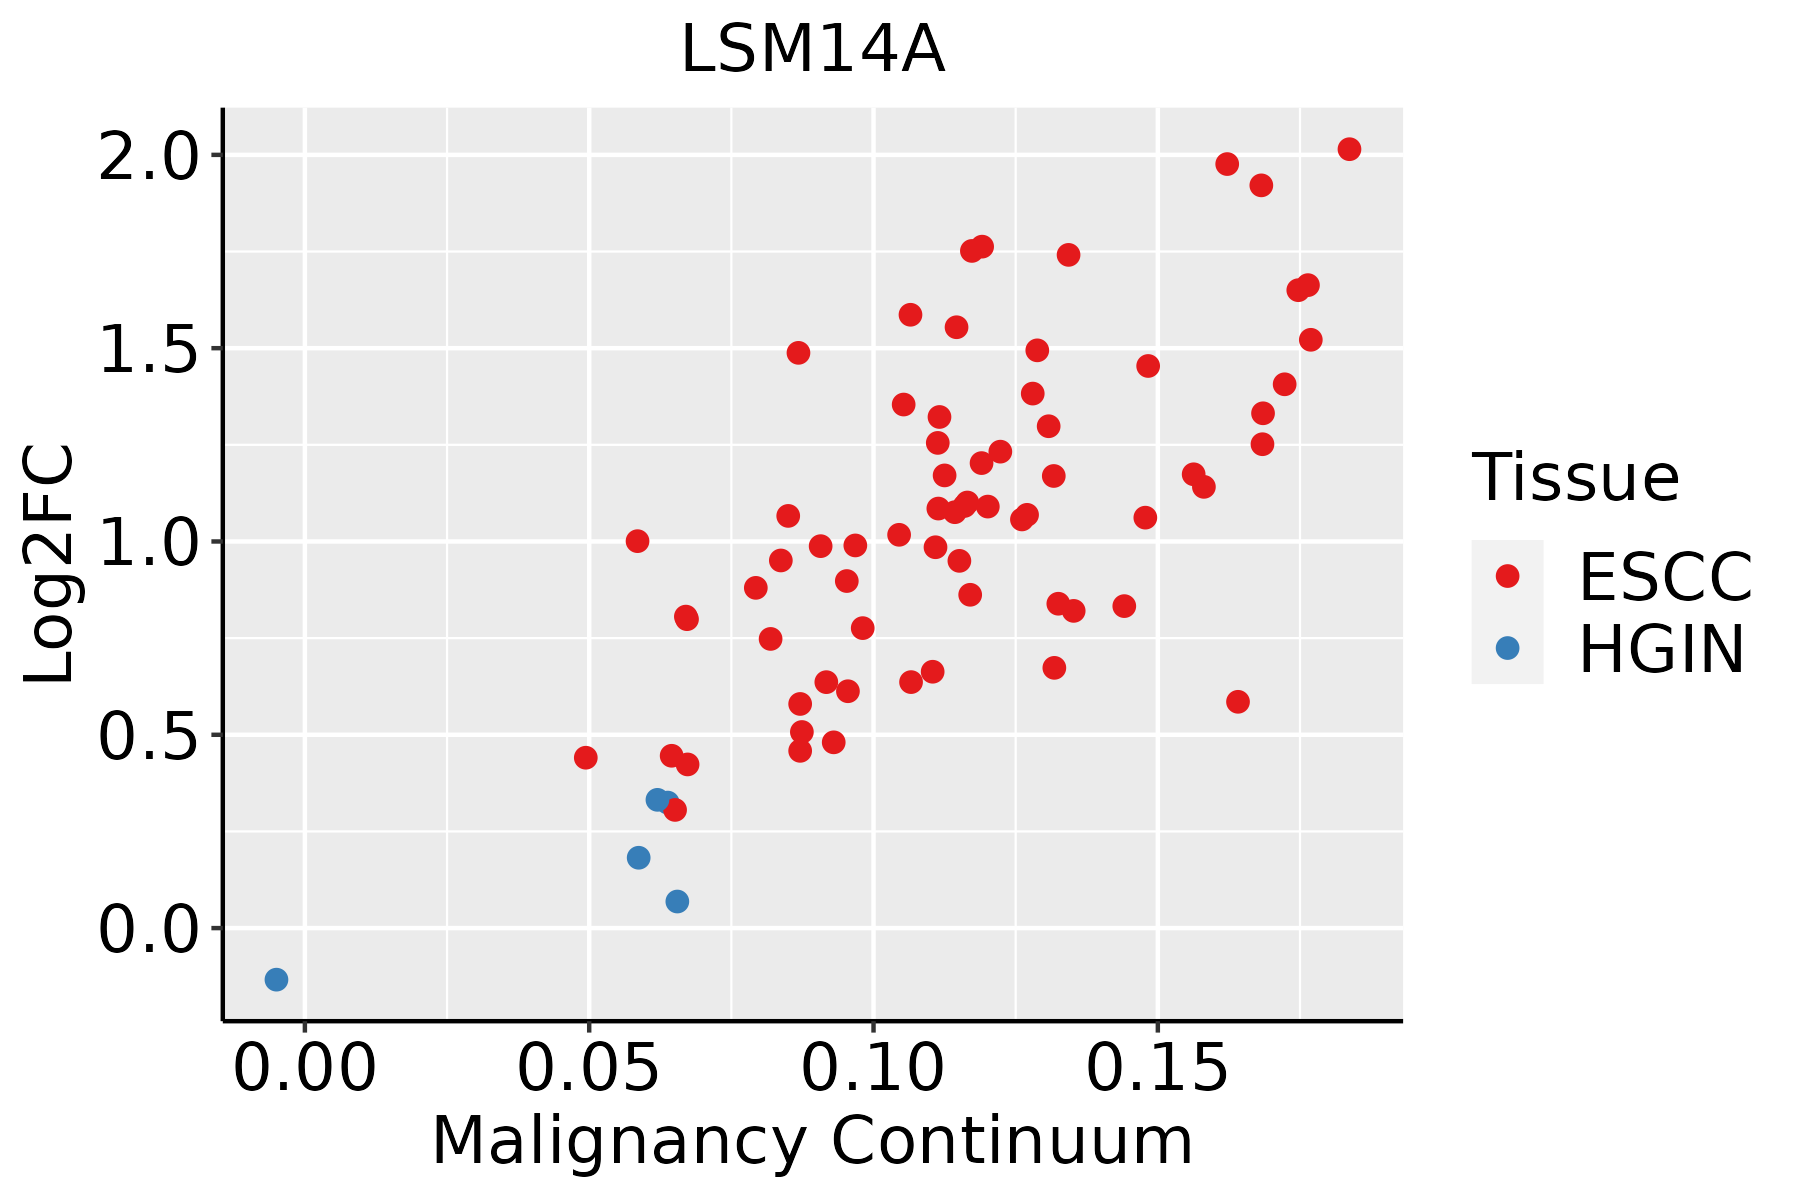 | ESCC: Esophageal squamous cell carcinoma |
| HGIN: High-grade intraepithelial neoplasias | ||
| LGIN: Low-grade intraepithelial neoplasias | ||
| Liver | 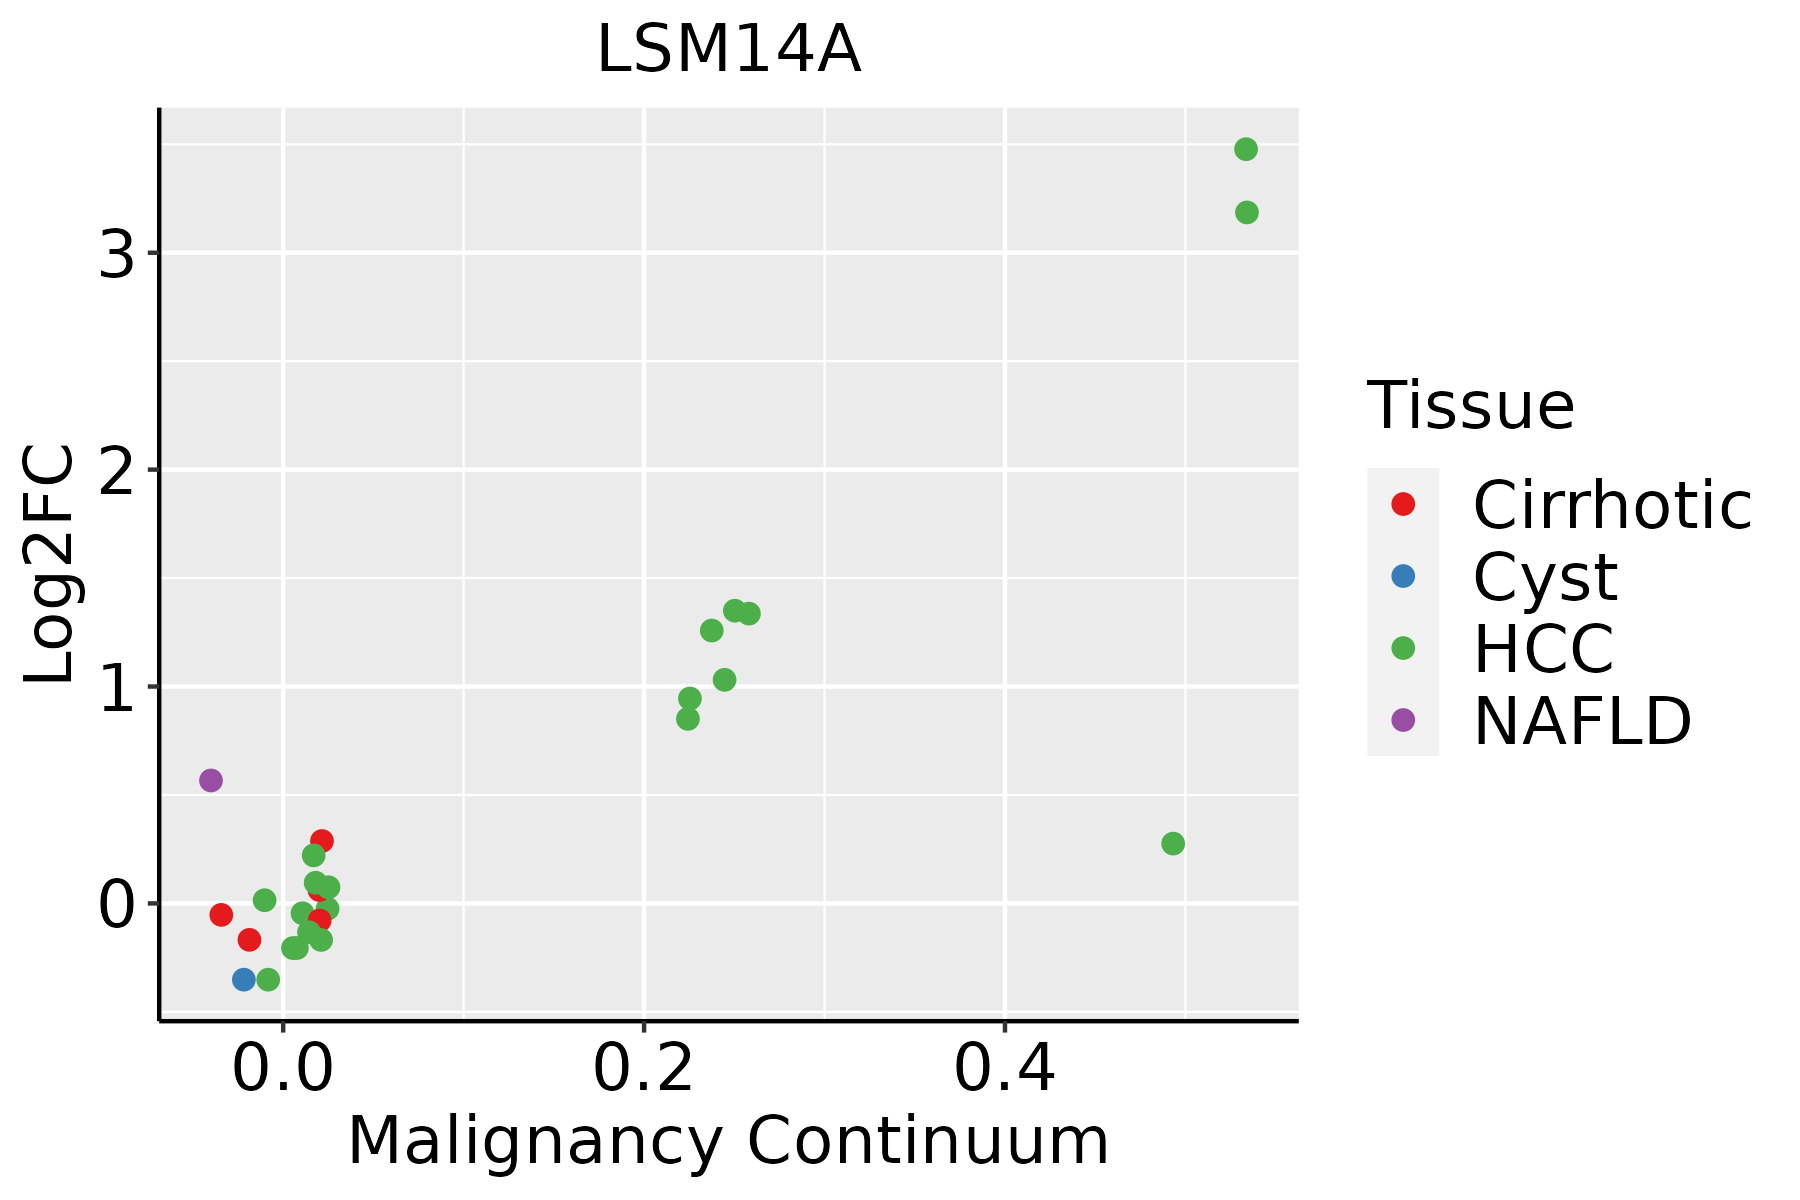 | HCC: Hepatocellular carcinoma |
| NAFLD: Non-alcoholic fatty liver disease | ||
| Oral Cavity |  | EOLP: Erosive Oral lichen planus |
| LP: leukoplakia | ||
| NEOLP: Non-erosive oral lichen planus | ||
| OSCC: Oral squamous cell carcinoma | ||
| Skin | 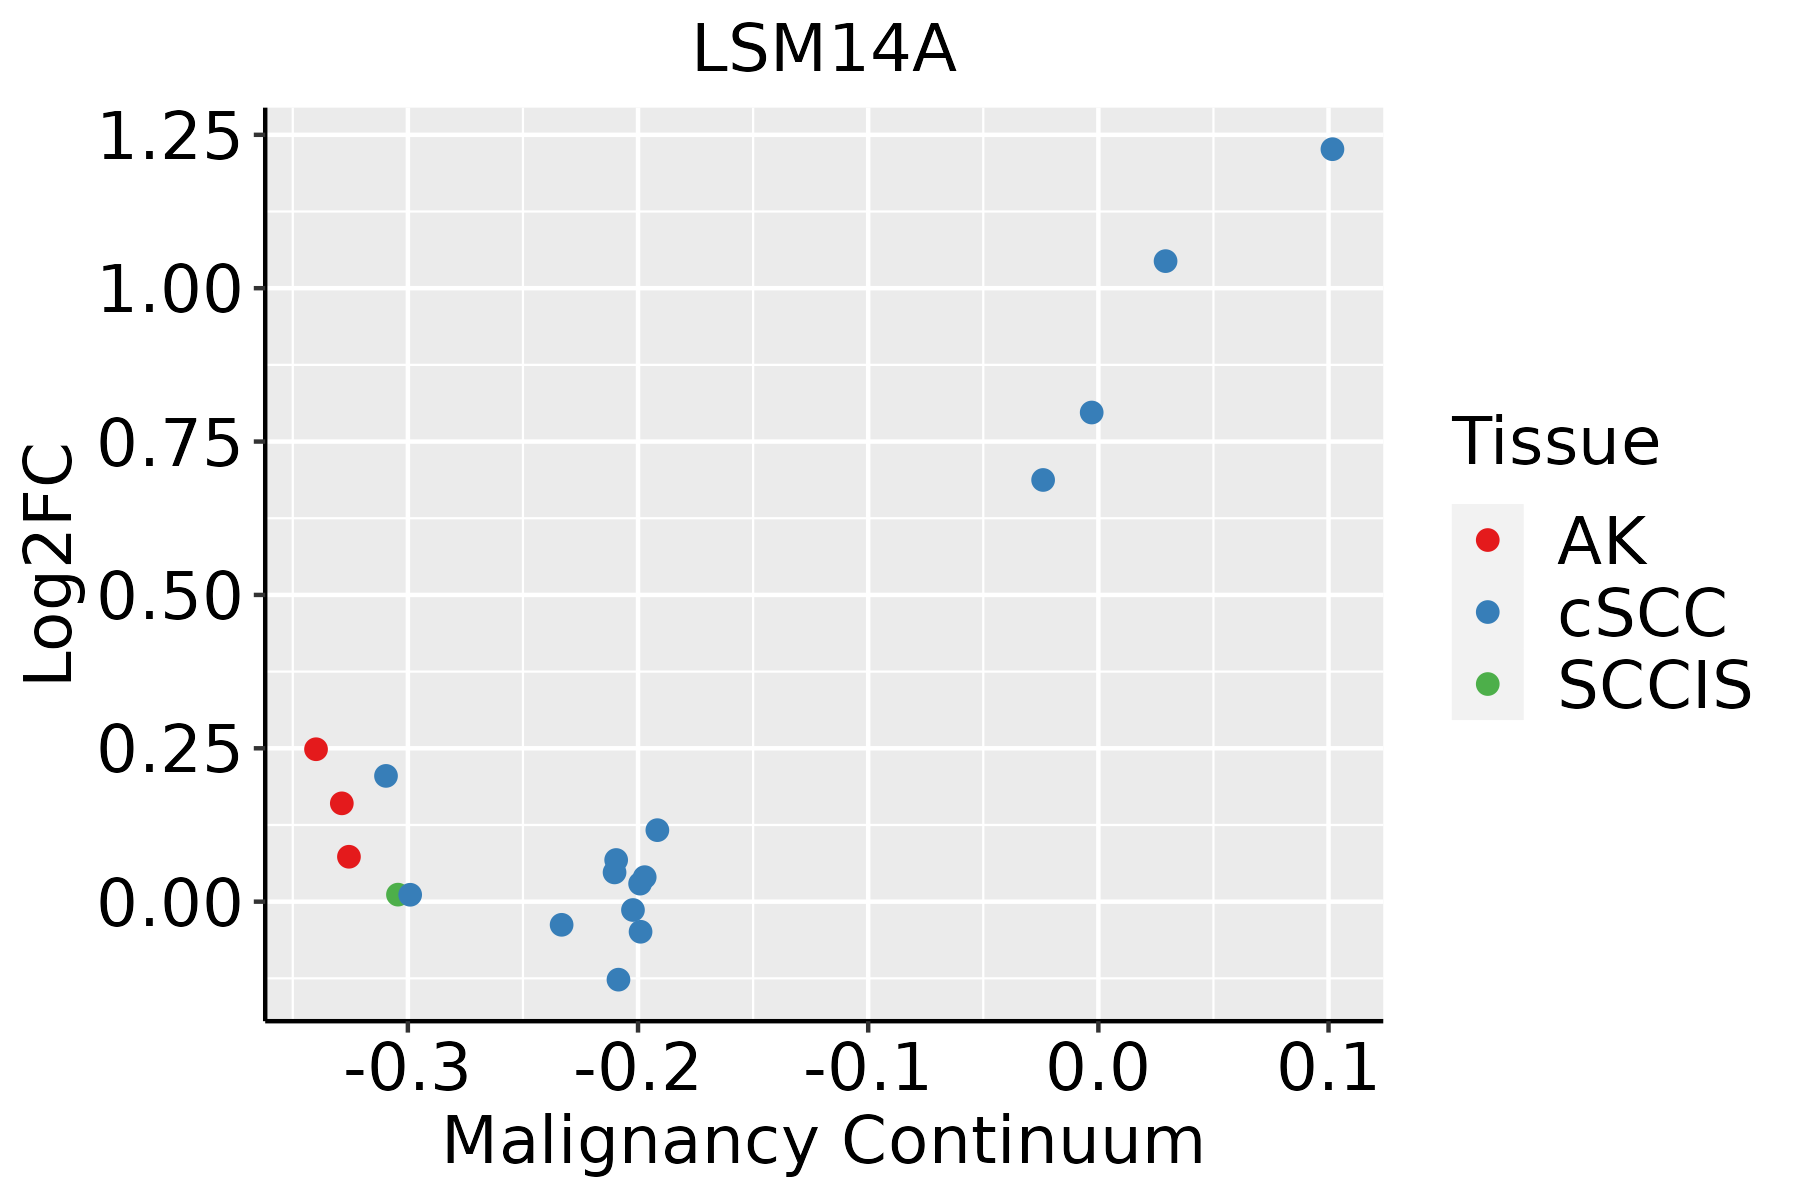 | AK: Actinic keratosis |
| cSCC: Cutaneous squamous cell carcinoma | ||
| SCCIS:squamous cell carcinoma in situ | ||
| Thyroid | 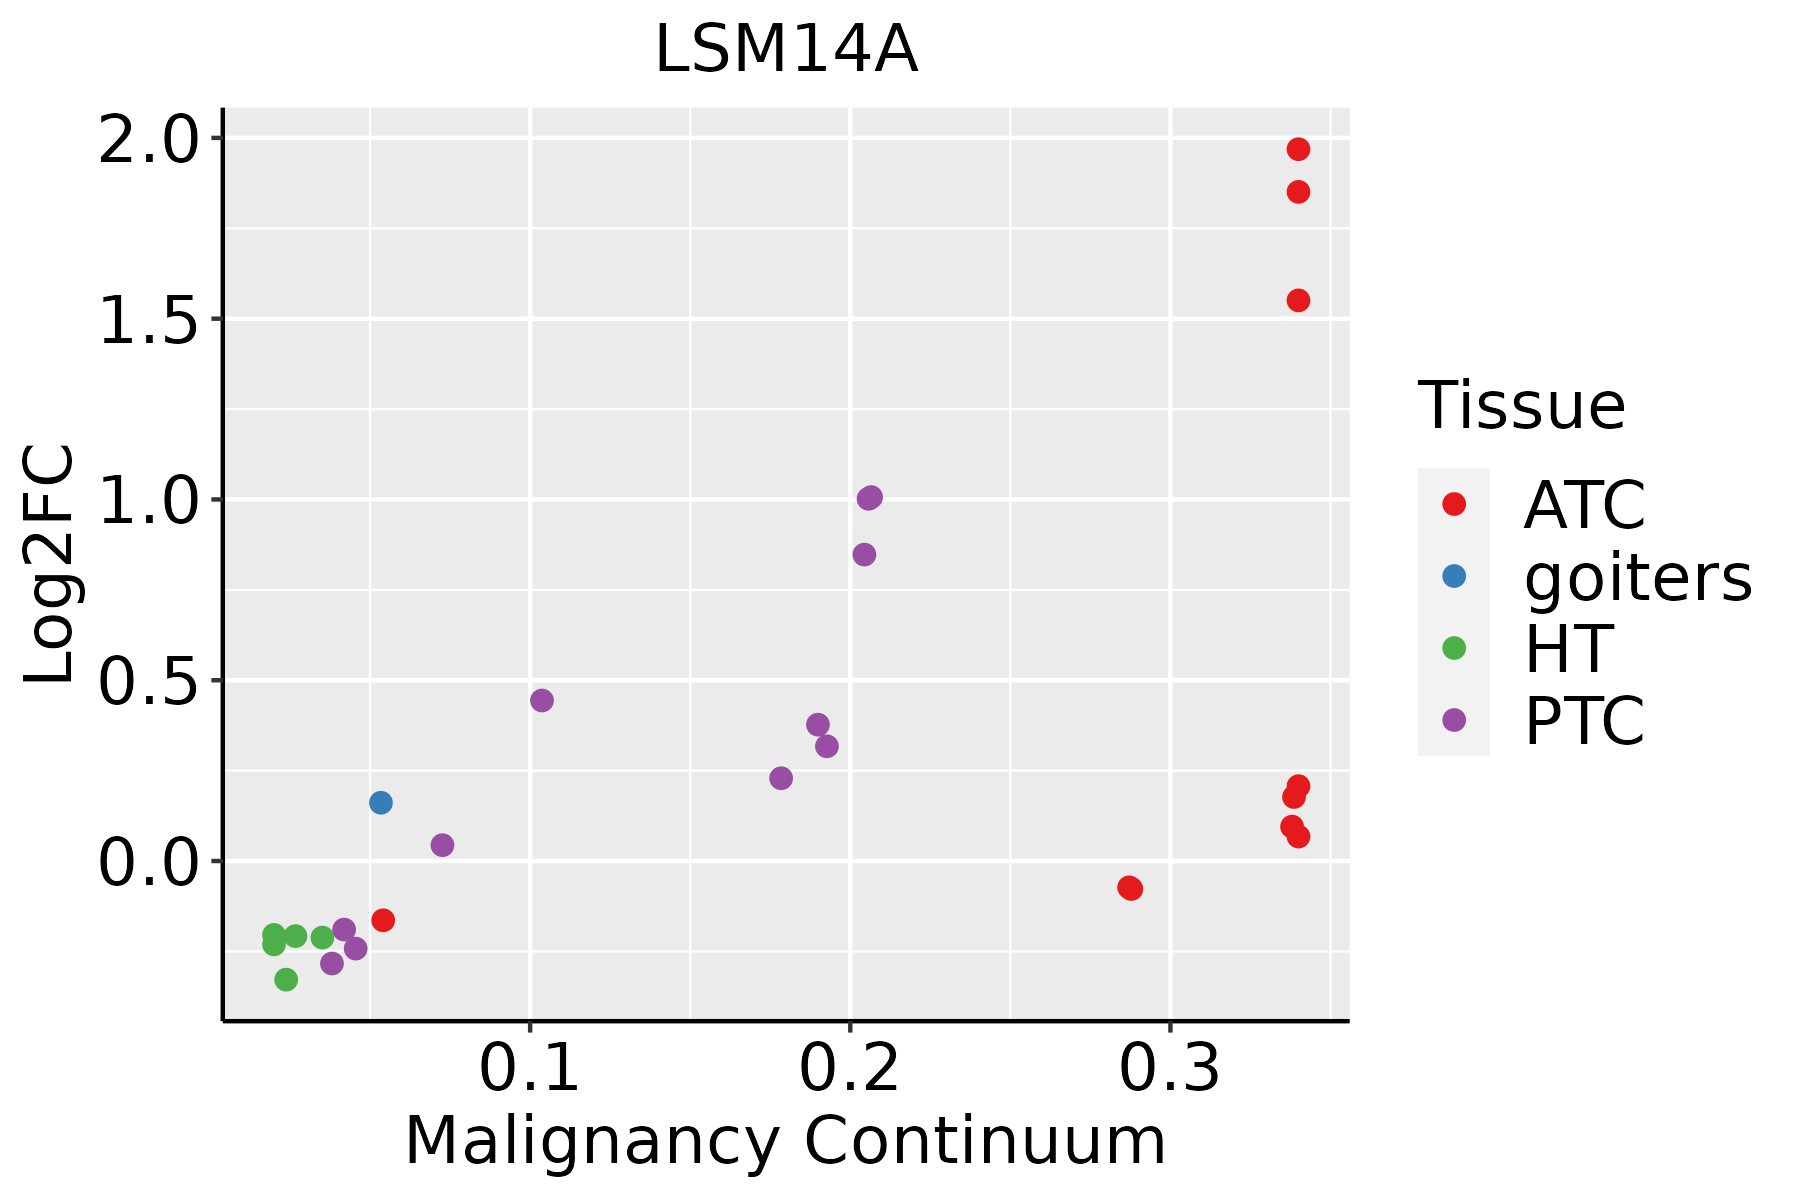 | ATC: Anaplastic thyroid cancer |
| HT: Hashimoto's thyroiditis | ||
| PTC: Papillary thyroid cancer |
| ∗log2FC in expression of this searched gene in stem-like cells from each diseased tissue sample relative to stem-like cells in normal samples in each tissue plotted against the malignancy continuum. Samples are colored based on if they are from different disease stage. |
Top |
Malignant transformation related pathway analysis |
| Find out the enriched GO biological processes and KEGG pathways involved in transition from healthy to precancer to cancer |
| Tissue | Disease Stage | Enriched GO biological Processes |
| Colorectum | AD |  |
| Colorectum | SER |  |
| Colorectum | MSS |  |
| Colorectum | MSI-H |  |
| Colorectum | FAP |  |
| ∗Top 15 enriched GO BP terms are showed in the bar plot of each disease state in each tissue. Each row represents a significant GO biological process which is colored according to the -log10(p.adjust). |
| Page: 1 2 3 4 5 6 7 8 9 |
| GO ID | Tissue | Disease Stage | Description | Gene Ratio | Bg Ratio | pvalue | p.adjust | Count |
| GO:003952813 | Esophagus | ESCC | cytoplasmic pattern recognition receptor signaling pathway in response to virus | 28/8552 | 34/18723 | 1.21e-05 | 1.12e-04 | 28 |
| GO:00603385 | Esophagus | ESCC | regulation of type I interferon-mediated signaling pathway | 29/8552 | 36/18723 | 1.91e-05 | 1.67e-04 | 29 |
| GO:009858613 | Esophagus | ESCC | cellular response to virus | 56/8552 | 84/18723 | 8.20e-05 | 6.01e-04 | 56 |
| GO:003952913 | Esophagus | ESCC | RIG-I signaling pathway | 22/8552 | 27/18723 | 1.49e-04 | 9.92e-04 | 22 |
| GO:000275313 | Esophagus | ESCC | cytoplasmic pattern recognition receptor signaling pathway | 41/8552 | 60/18723 | 3.25e-04 | 1.91e-03 | 41 |
| GO:00450885 | Esophagus | ESCC | regulation of innate immune response | 125/8552 | 218/18723 | 3.34e-04 | 1.96e-03 | 125 |
| GO:00019615 | Esophagus | ESCC | positive regulation of cytokine-mediated signaling pathway | 35/8552 | 50/18723 | 4.33e-04 | 2.44e-03 | 35 |
| GO:00607605 | Esophagus | ESCC | positive regulation of response to cytokine stimulus | 39/8552 | 57/18723 | 4.34e-04 | 2.44e-03 | 39 |
| GO:003396214 | Esophagus | ESCC | P-body assembly | 16/8552 | 21/18723 | 4.47e-03 | 1.76e-02 | 16 |
| GO:003424914 | Esophagus | ESCC | negative regulation of cellular amide metabolic process | 144/8552 | 273/18723 | 1.08e-02 | 3.67e-02 | 144 |
| GO:00064177 | Liver | NAFLD | regulation of translation | 85/1882 | 468/18723 | 4.58e-08 | 4.54e-06 | 85 |
| GO:00305226 | Liver | NAFLD | intracellular receptor signaling pathway | 55/1882 | 265/18723 | 1.39e-07 | 1.03e-05 | 55 |
| GO:00171483 | Liver | NAFLD | negative regulation of translation | 43/1882 | 245/18723 | 2.05e-04 | 3.56e-03 | 43 |
| GO:00342493 | Liver | NAFLD | negative regulation of cellular amide metabolic process | 46/1882 | 273/18723 | 3.27e-04 | 5.04e-03 | 46 |
| GO:00340633 | Liver | NAFLD | stress granule assembly | 9/1882 | 26/18723 | 6.56e-04 | 8.50e-03 | 9 |
| GO:00028313 | Liver | NAFLD | regulation of response to biotic stimulus | 49/1882 | 327/18723 | 2.94e-03 | 2.66e-02 | 49 |
| GO:0039529 | Liver | NAFLD | RIG-I signaling pathway | 8/1882 | 27/18723 | 3.97e-03 | 3.34e-02 | 8 |
| GO:0045088 | Liver | NAFLD | regulation of innate immune response | 34/1882 | 218/18723 | 6.47e-03 | 4.69e-02 | 34 |
| GO:000641712 | Liver | Cirrhotic | regulation of translation | 194/4634 | 468/18723 | 7.28e-16 | 8.79e-14 | 194 |
| GO:003052212 | Liver | Cirrhotic | intracellular receptor signaling pathway | 105/4634 | 265/18723 | 5.44e-08 | 1.69e-06 | 105 |
| Page: 1 2 3 4 5 6 7 8 9 10 11 12 13 14 15 16 17 18 |
| Pathway ID | Tissue | Disease Stage | Description | Gene Ratio | Bg Ratio | pvalue | p.adjust | qvalue | Count |
| Page: 1 |
Top |
Cell-cell communication analysis |
| Identification of potential cell-cell interactions between two cell types and their ligand-receptor pairs for different disease states |
| Ligand | Receptor | LRpair | Pathway | Tissue | Disease Stage |
| Page: 1 |
Top |
Single-cell gene regulatory network inference analysis |
| Find out the significant the regulons (TFs) and the target genes of each regulon across cell types for different disease states |
| TF | Cell Type | Tissue | Disease Stage | Target Gene | RSS | Regulon Activity |
| ∗The dot plots of a searched regulon are shown for all cell subpopulations in each disease state of each tissue based on the regulon specific score inferred using pySCENIC and by calculating the average expression. |
| Page: 1 |
Top |
Somatic mutation of malignant transformation related genes |
| Annotation of somatic variants for genes involved in malignant transformation |
| Hugo Symbol | Variant Class | Variant Classification | dbSNP RS | HGVSc | HGVSp | HGVSp Short | SWISSPROT | BIOTYPE | SIFT | PolyPhen | Tumor Sample Barcode | Tissue | Histology | Sex | Age | Stage | Therapy Types | Drugs | Outcome |
| LSM14A | SNV | Missense_Mutation | c.1180N>A | p.Glu394Lys | p.E394K | Q8ND56 | protein_coding | deleterious(0) | probably_damaging(0.998) | TCGA-AC-A23H-01 | Breast | breast invasive carcinoma | Female | >=65 | I/II | Unknown | Unknown | PD | |
| LSM14A | deletion | In_Frame_Del | novel | c.104_118delCCGTAGCCCTTGCCA | p.Thr35_Ala39del | p.T35_A39del | Q8ND56 | protein_coding | TCGA-S3-AA10-01 | Breast | breast invasive carcinoma | Female | >=65 | I/II | Chemotherapy | cytoxan | CR | ||
| LSM14A | SNV | Missense_Mutation | novel | c.1345N>C | p.Glu449Gln | p.E449Q | Q8ND56 | protein_coding | deleterious_low_confidence(0.03) | possibly_damaging(0.584) | TCGA-C5-A3HL-01 | Cervix | cervical & endocervical cancer | Female | >=65 | I/II | Unknown | Unknown | SD |
| LSM14A | SNV | Missense_Mutation | c.814C>T | p.Arg272Cys | p.R272C | Q8ND56 | protein_coding | tolerated(0.06) | benign(0.051) | TCGA-5M-AAT6-01 | Colorectum | colon adenocarcinoma | Female | <65 | III/IV | Unknown | Unknown | PD | |
| LSM14A | SNV | Missense_Mutation | c.814C>T | p.Arg272Cys | p.R272C | Q8ND56 | protein_coding | tolerated(0.06) | benign(0.051) | TCGA-AA-3864-01 | Colorectum | colon adenocarcinoma | Male | >=65 | I/II | Unknown | Unknown | SD | |
| LSM14A | SNV | Missense_Mutation | novel | c.1312C>T | p.Arg438Cys | p.R438C | Q8ND56 | protein_coding | tolerated_low_confidence(0.09) | possibly_damaging(0.648) | TCGA-AA-3984-01 | Colorectum | colon adenocarcinoma | Female | <65 | I/II | Unknown | Unknown | SD |
| LSM14A | SNV | Missense_Mutation | c.580N>G | p.Thr194Ala | p.T194A | Q8ND56 | protein_coding | tolerated(0.1) | benign(0.083) | TCGA-AA-A01R-01 | Colorectum | colon adenocarcinoma | Male | <65 | III/IV | Chemotherapy | 5-fluorouracil | PD | |
| LSM14A | SNV | Missense_Mutation | c.814C>T | p.Arg272Cys | p.R272C | Q8ND56 | protein_coding | tolerated(0.06) | benign(0.051) | TCGA-D5-6930-01 | Colorectum | colon adenocarcinoma | Male | >=65 | I/II | Unknown | Unknown | SD | |
| LSM14A | SNV | Missense_Mutation | rs377088182 | c.158N>A | p.Arg53His | p.R53H | Q8ND56 | protein_coding | tolerated(0.05) | possibly_damaging(0.76) | TCGA-F4-6856-01 | Colorectum | colon adenocarcinoma | Male | <65 | I/II | Ancillary | leucovorin | CR |
| LSM14A | SNV | Missense_Mutation | c.526C>A | p.Gln176Lys | p.Q176K | Q8ND56 | protein_coding | tolerated(0.06) | benign(0.392) | TCGA-F5-6864-01 | Colorectum | rectum adenocarcinoma | Female | >=65 | III/IV | Chemotherapy | 5-fluorouracil | CR |
| Page: 1 2 3 4 5 |
Top |
Related drugs of malignant transformation related genes |
| Identification of chemicals and drugs interact with genes involved in malignant transfromation |
| (DGIdb 4.0) |
| Entrez ID | Symbol | Category | Interaction Types | Drug Claim Name | Drug Name | PMIDs |
| Page: 1 |

Copyright 2023-Present -The University of Texas Health Science Center at Houston |