
|
|||||
|
 | |
| |
| |
| |
| |
| |
|
Gene: LPL |
Gene summary for LPL |
| Gene information | Species | Human | Gene symbol | LPL | Gene ID | 4023 |
| Gene name | lipoprotein lipase | |
| Gene Alias | HDLCQ11 | |
| Cytomap | 8p21.3 | |
| Gene Type | protein-coding | GO ID | GO:0001816 | UniProtAcc | A0A1B1RVA9 |
Top |
Malignant transformation analysis |
| Identification of the aberrant gene expression in precancerous and cancerous lesions by comparing the gene expression of stem-like cells in diseased tissues with normal stem cells |
| Entrez ID | Symbol | Replicates | Species | Organ | Tissue | Adj P-value | Log2FC | Malignancy |
| 4023 | LPL | RNA-P25T1-P25T1-1 | Human | Lung | AIS | 2.29e-03 | 4.08e-02 | -0.2116 |
| 4023 | LPL | RNA-P6T2-P6T2-1 | Human | Lung | IAC | 2.36e-05 | -5.78e-01 | -0.0166 |
| 4023 | LPL | RNA-P6T2-P6T2-2 | Human | Lung | IAC | 1.37e-03 | -5.63e-01 | -0.0132 |
| 4023 | LPL | RNA-P6T2-P6T2-3 | Human | Lung | IAC | 5.69e-03 | -5.50e-01 | -0.013 |
| 4023 | LPL | RNA-P6T2-P6T2-4 | Human | Lung | IAC | 1.36e-05 | -5.78e-01 | -0.0121 |
| 4023 | LPL | male-WTA | Human | Thyroid | PTC | 3.77e-15 | 2.04e-01 | 0.1037 |
| 4023 | LPL | PTC01 | Human | Thyroid | PTC | 2.66e-05 | 1.47e-01 | 0.1899 |
| 4023 | LPL | PTC04 | Human | Thyroid | PTC | 1.25e-05 | 2.52e-01 | 0.1927 |
| 4023 | LPL | PTC06 | Human | Thyroid | PTC | 1.81e-25 | 8.61e-01 | 0.2057 |
| 4023 | LPL | PTC07 | Human | Thyroid | PTC | 3.77e-15 | 5.29e-01 | 0.2044 |
| Page: 1 |
| Tissue | Expression Dynamics | Abbreviation |
| Lung | 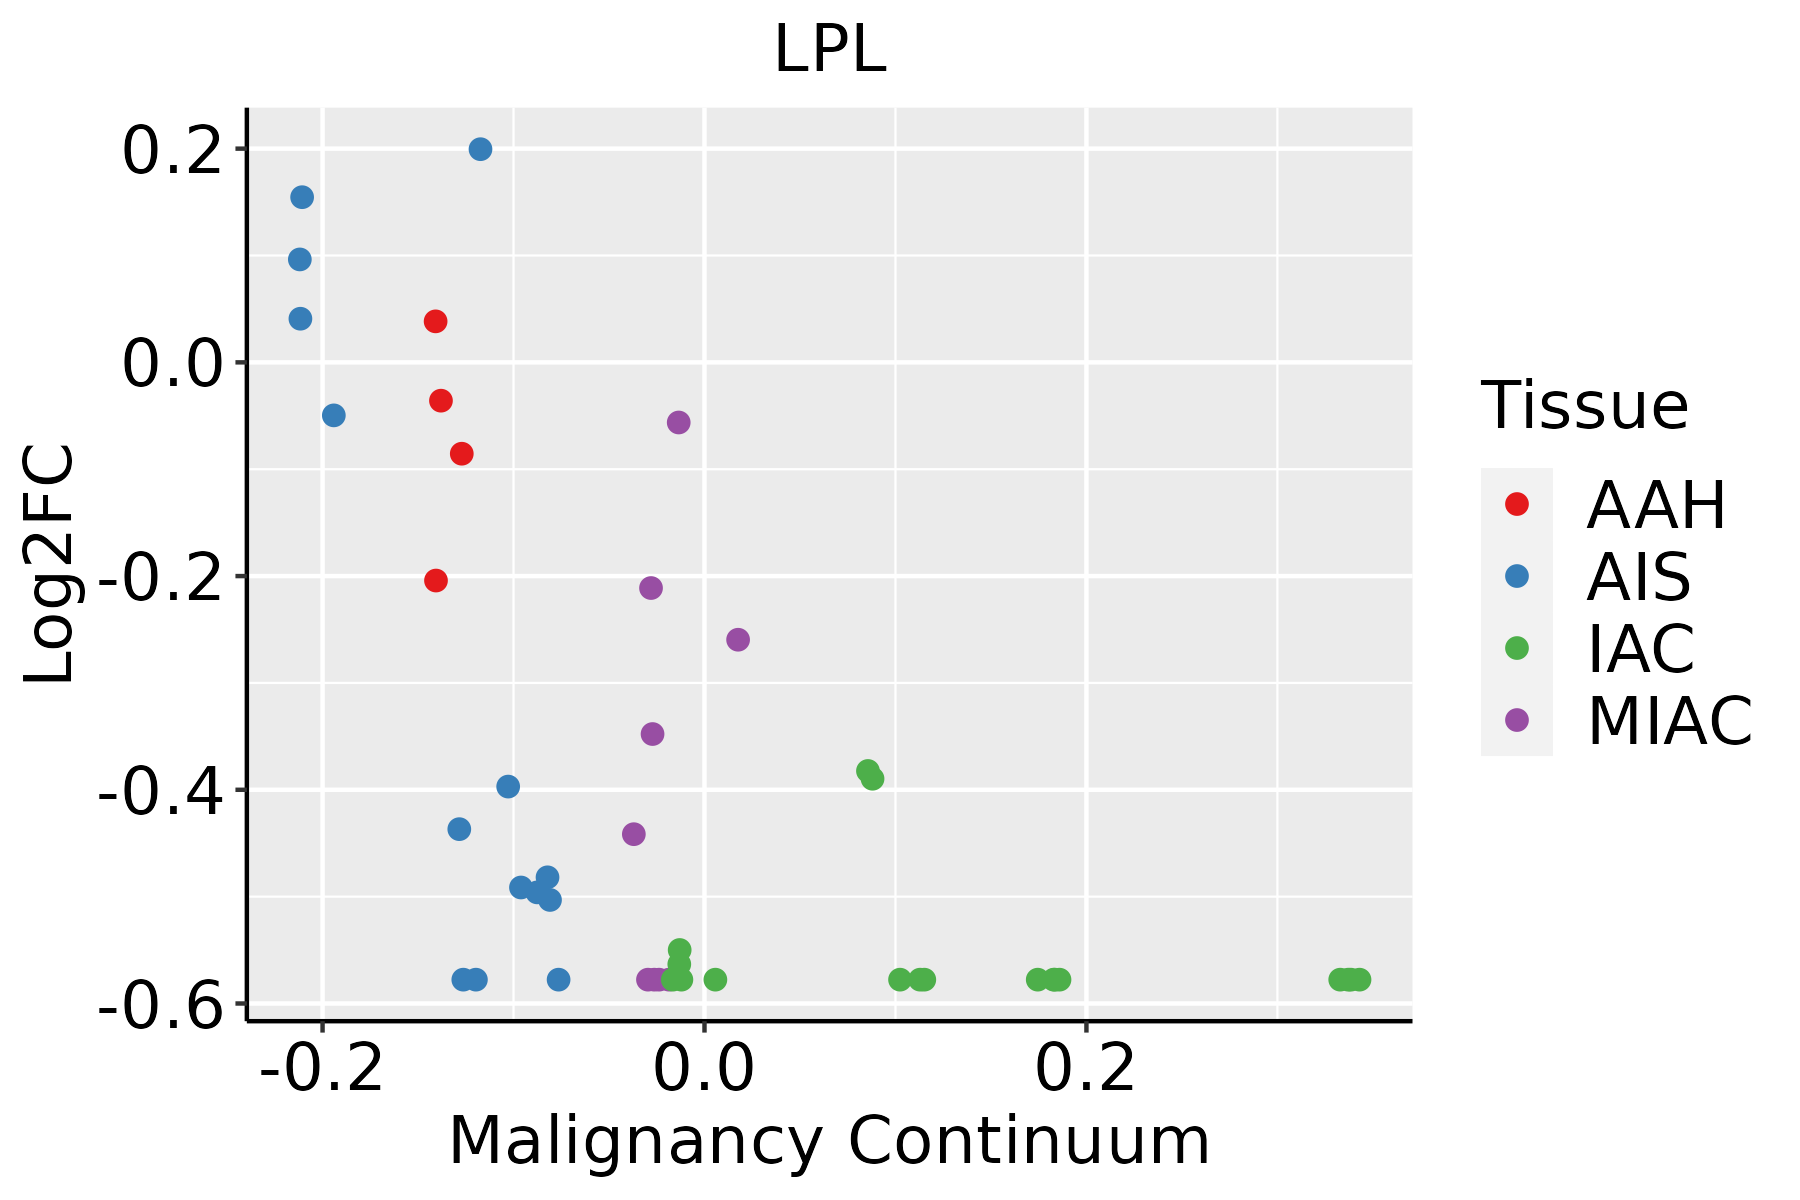 | AAH: Atypical adenomatous hyperplasia |
| AIS: Adenocarcinoma in situ | ||
| IAC: Invasive lung adenocarcinoma | ||
| MIA: Minimally invasive adenocarcinoma | ||
| Thyroid | 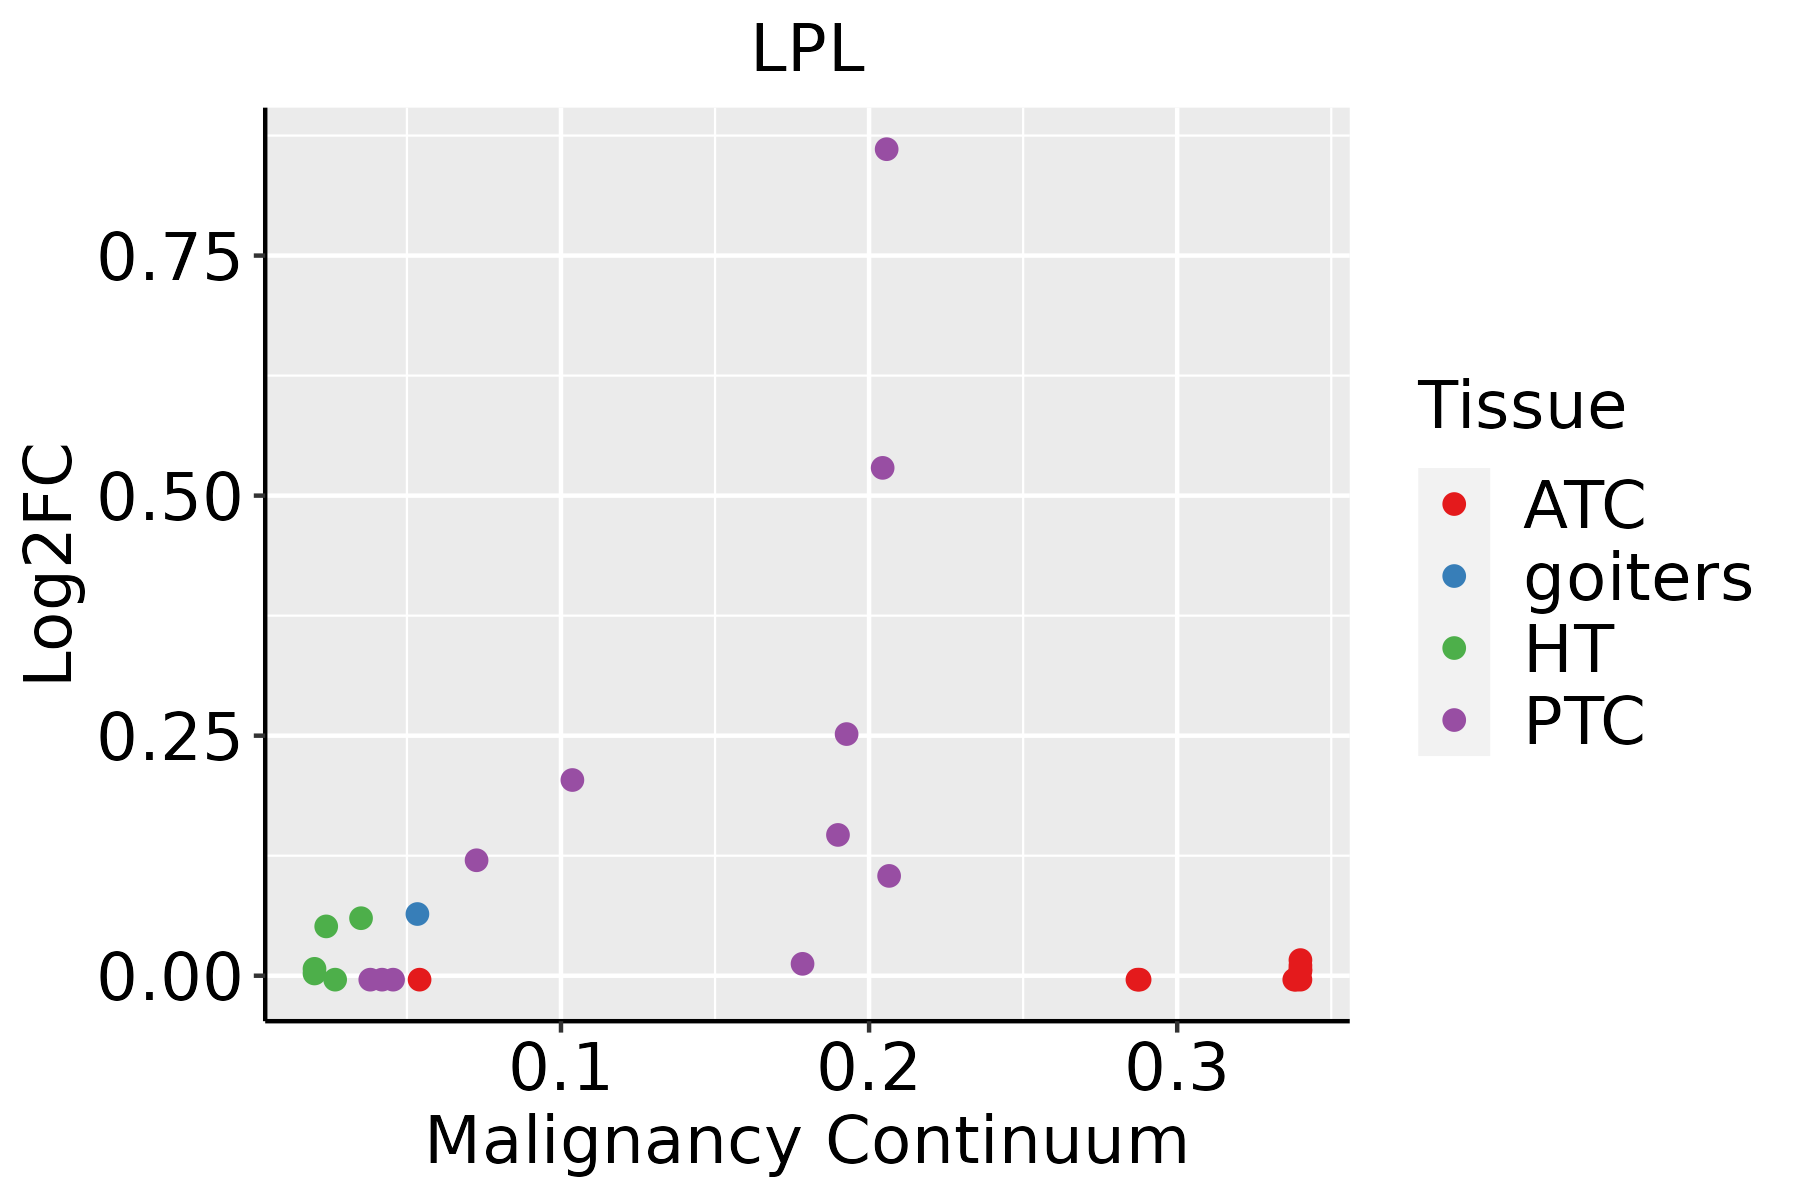 | ATC: Anaplastic thyroid cancer |
| HT: Hashimoto's thyroiditis | ||
| PTC: Papillary thyroid cancer |
| ∗log2FC in expression of this searched gene in stem-like cells from each diseased tissue sample relative to stem-like cells in normal samples in each tissue plotted against the malignancy continuum. Samples are colored based on if they are from different disease stage. |
Top |
Malignant transformation related pathway analysis |
| Find out the enriched GO biological processes and KEGG pathways involved in transition from healthy to precancer to cancer |
| Tissue | Disease Stage | Enriched GO biological Processes |
| Colorectum | AD |  |
| Colorectum | SER |  |
| Colorectum | MSS |  |
| Colorectum | MSI-H |  |
| Colorectum | FAP |  |
| ∗Top 15 enriched GO BP terms are showed in the bar plot of each disease state in each tissue. Each row represents a significant GO biological process which is colored according to the -log10(p.adjust). |
| Page: 1 2 3 4 5 6 7 8 9 |
| GO ID | Tissue | Disease Stage | Description | Gene Ratio | Bg Ratio | pvalue | p.adjust | Count |
| GO:0070997210 | Thyroid | ATC | neuron death | 176/6293 | 361/18723 | 1.43e-09 | 3.57e-08 | 176 |
| GO:190121428 | Thyroid | ATC | regulation of neuron death | 156/6293 | 319/18723 | 9.30e-09 | 1.96e-07 | 156 |
| GO:006195123 | Thyroid | ATC | establishment of protein localization to plasma membrane | 41/6293 | 60/18723 | 4.02e-08 | 7.37e-07 | 41 |
| GO:000206428 | Thyroid | ATC | epithelial cell development | 103/6293 | 220/18723 | 3.06e-05 | 2.55e-04 | 103 |
| Page: 1 2 3 4 5 6 |
| Pathway ID | Tissue | Disease Stage | Description | Gene Ratio | Bg Ratio | pvalue | p.adjust | qvalue | Count |
| Page: 1 |
Top |
Cell-cell communication analysis |
| Identification of potential cell-cell interactions between two cell types and their ligand-receptor pairs for different disease states |
| Ligand | Receptor | LRpair | Pathway | Tissue | Disease Stage |
| Page: 1 |
Top |
Single-cell gene regulatory network inference analysis |
| Find out the significant the regulons (TFs) and the target genes of each regulon across cell types for different disease states |
| TF | Cell Type | Tissue | Disease Stage | Target Gene | RSS | Regulon Activity |
| ∗The dot plots of a searched regulon are shown for all cell subpopulations in each disease state of each tissue based on the regulon specific score inferred using pySCENIC and by calculating the average expression. |
| Page: 1 |
Top |
Somatic mutation of malignant transformation related genes |
| Annotation of somatic variants for genes involved in malignant transformation |
| Hugo Symbol | Variant Class | Variant Classification | dbSNP RS | HGVSc | HGVSp | HGVSp Short | SWISSPROT | BIOTYPE | SIFT | PolyPhen | Tumor Sample Barcode | Tissue | Histology | Sex | Age | Stage | Therapy Types | Drugs | Outcome |
| LPL | SNV | Missense_Mutation | novel | c.817C>T | p.His273Tyr | p.H273Y | P06858 | protein_coding | deleterious(0.03) | probably_damaging(0.991) | TCGA-BH-A0BW-01 | Breast | breast invasive carcinoma | Female | >=65 | I/II | Chemotherapy | adriamycin | CR |
| LPL | SNV | Missense_Mutation | novel | c.146C>T | p.Thr49Ile | p.T49I | P06858 | protein_coding | tolerated(0.1) | benign(0.012) | TCGA-E2-A14V-01 | Breast | breast invasive carcinoma | Female | <65 | I/II | Chemotherapy | cyclophosphamide | SD |
| LPL | insertion | Frame_Shift_Ins | novel | c.1050_1051insTCTCCTAGGCTGGAGGAGA | p.Gly351SerfsTer9 | p.G351Sfs*9 | P06858 | protein_coding | TCGA-BH-A0B8-01 | Breast | breast invasive carcinoma | Female | <65 | I/II | Hormone Therapy | arimidex | SD | ||
| LPL | SNV | Missense_Mutation | rs557015233 | c.112N>A | p.Glu38Lys | p.E38K | P06858 | protein_coding | tolerated(0.31) | benign(0.202) | TCGA-2W-A8YY-01 | Cervix | cervical & endocervical cancer | Female | <65 | I/II | Chemotherapy | cisplatin | CR |
| LPL | SNV | Missense_Mutation | rs199675233 | c.373N>A | p.Ala125Thr | p.A125T | P06858 | protein_coding | deleterious(0.02) | probably_damaging(0.982) | TCGA-EK-A2PI-01 | Cervix | cervical & endocervical cancer | Female | <65 | III/IV | Unknown | Unknown | SD |
| LPL | SNV | Missense_Mutation | c.1120N>C | p.Glu374Gln | p.E374Q | P06858 | protein_coding | tolerated(0.38) | possibly_damaging(0.673) | TCGA-EK-A2RJ-01 | Cervix | cervical & endocervical cancer | Female | <65 | I/II | Unknown | Unknown | SD | |
| LPL | SNV | Missense_Mutation | c.277N>T | p.Pro93Ser | p.P93S | P06858 | protein_coding | tolerated(0.4) | possibly_damaging(0.678) | TCGA-AA-3713-01 | Colorectum | colon adenocarcinoma | Male | >=65 | III/IV | Chemotherapy | 5-fluorouracil | PR | |
| LPL | SNV | Missense_Mutation | c.1213N>G | p.Leu405Val | p.L405V | P06858 | protein_coding | tolerated(0.47) | benign(0.029) | TCGA-AA-3715-01 | Colorectum | colon adenocarcinoma | Male | >=65 | I/II | Unknown | Unknown | PD | |
| LPL | SNV | Missense_Mutation | c.1423G>T | p.Gly475Cys | p.G475C | P06858 | protein_coding | deleterious_low_confidence(0) | probably_damaging(0.971) | TCGA-AA-3864-01 | Colorectum | colon adenocarcinoma | Male | >=65 | I/II | Unknown | Unknown | SD | |
| LPL | SNV | Missense_Mutation | c.1344N>T | p.Glu448Asp | p.E448D | P06858 | protein_coding | tolerated(1) | benign(0.005) | TCGA-AA-3977-01 | Colorectum | colon adenocarcinoma | Male | >=65 | I/II | Unknown | Unknown | SD |
| Page: 1 2 3 4 5 6 7 8 |
Top |
Related drugs of malignant transformation related genes |
| Identification of chemicals and drugs interact with genes involved in malignant transfromation |
| (DGIdb 4.0) |
| Entrez ID | Symbol | Category | Interaction Types | Drug Claim Name | Drug Name | PMIDs |
| 4023 | LPL | DRUGGABLE GENOME, LIPASE, PHOSPHOLIPASE, CELL SURFACE | INSULIN | INSULIN | 15202783,8727949 | |
| 4023 | LPL | DRUGGABLE GENOME, LIPASE, PHOSPHOLIPASE, CELL SURFACE | NADOLOL | NADOLOL | 1681747 | |
| 4023 | LPL | DRUGGABLE GENOME, LIPASE, PHOSPHOLIPASE, CELL SURFACE | LAK | 8895065 | ||
| 4023 | LPL | DRUGGABLE GENOME, LIPASE, PHOSPHOLIPASE, CELL SURFACE | ACARBOSE | ACARBOSE | 8886823 | |
| 4023 | LPL | DRUGGABLE GENOME, LIPASE, PHOSPHOLIPASE, CELL SURFACE | Ibrolipim | IBROLIPIM | ||
| 4023 | LPL | DRUGGABLE GENOME, LIPASE, PHOSPHOLIPASE, CELL SURFACE | fenofibrate | FENOFIBRATE | 19207029 | |
| 4023 | LPL | DRUGGABLE GENOME, LIPASE, PHOSPHOLIPASE, CELL SURFACE | Gemfibrozil | GEMFIBROZIL | ||
| 4023 | LPL | DRUGGABLE GENOME, LIPASE, PHOSPHOLIPASE, CELL SURFACE | RU 486 | 7627771 | ||
| 4023 | LPL | DRUGGABLE GENOME, LIPASE, PHOSPHOLIPASE, CELL SURFACE | L-ASPARAGINASE | ASPARAGINASE | 9264396 | |
| 4023 | LPL | DRUGGABLE GENOME, LIPASE, PHOSPHOLIPASE, CELL SURFACE | DIAZOXIDE | DIAZOXIDE | 14499880 |
| Page: 1 2 3 |

Copyright 2023-Present -The University of Texas Health Science Center at Houston |