
|
|||||
|
 | |
| |
| |
| |
| |
| |
|
Gene: LLGL2 |
Gene summary for LLGL2 |
| Gene information | Species | Human | Gene symbol | LLGL2 | Gene ID | 3993 |
| Gene name | LLGL scribble cell polarity complex component 2 | |
| Gene Alias | HGL | |
| Cytomap | 17q25.1 | |
| Gene Type | protein-coding | GO ID | GO:0000226 | UniProtAcc | Q6P1M3 |
Top |
Malignant transformation analysis |
| Identification of the aberrant gene expression in precancerous and cancerous lesions by comparing the gene expression of stem-like cells in diseased tissues with normal stem cells |
| Entrez ID | Symbol | Replicates | Species | Organ | Tissue | Adj P-value | Log2FC | Malignancy |
| 3993 | LLGL2 | GSM4909282 | Human | Breast | IDC | 3.73e-12 | 3.92e-01 | -0.0288 |
| 3993 | LLGL2 | GSM4909286 | Human | Breast | IDC | 4.94e-08 | 2.74e-01 | 0.1081 |
| 3993 | LLGL2 | GSM4909290 | Human | Breast | IDC | 8.28e-15 | 5.00e-01 | 0.2096 |
| 3993 | LLGL2 | GSM4909295 | Human | Breast | IDC | 8.93e-18 | 6.98e-01 | 0.0898 |
| 3993 | LLGL2 | GSM4909298 | Human | Breast | IDC | 4.23e-11 | 3.19e-01 | 0.1551 |
| 3993 | LLGL2 | GSM4909317 | Human | Breast | IDC | 2.76e-16 | 4.74e-01 | 0.1355 |
| 3993 | LLGL2 | GSM4909318 | Human | Breast | IDC | 3.18e-03 | 4.32e-01 | 0.2031 |
| 3993 | LLGL2 | GSM4909319 | Human | Breast | IDC | 5.81e-08 | 2.67e-02 | 0.1563 |
| 3993 | LLGL2 | P1 | Human | Breast | IDC | 1.63e-02 | 1.57e-01 | 0.1527 |
| 3993 | LLGL2 | DCIS2 | Human | Breast | DCIS | 7.00e-34 | 1.24e-01 | 0.0085 |
| 3993 | LLGL2 | HTA11_2487_2000001011 | Human | Colorectum | SER | 2.18e-14 | 8.34e-01 | -0.1808 |
| 3993 | LLGL2 | HTA11_1938_2000001011 | Human | Colorectum | AD | 1.37e-16 | 8.19e-01 | -0.0811 |
| 3993 | LLGL2 | HTA11_78_2000001011 | Human | Colorectum | AD | 6.34e-03 | 5.79e-01 | -0.1088 |
| 3993 | LLGL2 | HTA11_347_2000001011 | Human | Colorectum | AD | 4.01e-43 | 1.13e+00 | -0.1954 |
| 3993 | LLGL2 | HTA11_411_2000001011 | Human | Colorectum | SER | 9.78e-13 | 1.61e+00 | -0.2602 |
| 3993 | LLGL2 | HTA11_2112_2000001011 | Human | Colorectum | SER | 1.84e-13 | 9.51e-01 | -0.2196 |
| 3993 | LLGL2 | HTA11_3361_2000001011 | Human | Colorectum | AD | 7.00e-11 | 6.99e-01 | -0.1207 |
| 3993 | LLGL2 | HTA11_83_2000001011 | Human | Colorectum | SER | 7.80e-20 | 1.06e+00 | -0.1526 |
| 3993 | LLGL2 | HTA11_696_2000001011 | Human | Colorectum | AD | 3.80e-30 | 1.13e+00 | -0.1464 |
| 3993 | LLGL2 | HTA11_866_2000001011 | Human | Colorectum | AD | 2.51e-28 | 1.03e+00 | -0.1001 |
| Page: 1 2 3 4 5 6 7 8 9 10 |
| Tissue | Expression Dynamics | Abbreviation |
| Breast |  | IDC: Invasive ductal carcinoma |
| DCIS: Ductal carcinoma in situ | ||
| Precancer(BRCA1-mut): Precancerous lesion from BRCA1 mutation carriers | ||
| Colorectum (GSE201348) |  | FAP: Familial adenomatous polyposis |
| CRC: Colorectal cancer | ||
| Colorectum (HTA11) |  | AD: Adenomas |
| SER: Sessile serrated lesions | ||
| MSI-H: Microsatellite-high colorectal cancer | ||
| MSS: Microsatellite stable colorectal cancer | ||
| Endometrium | 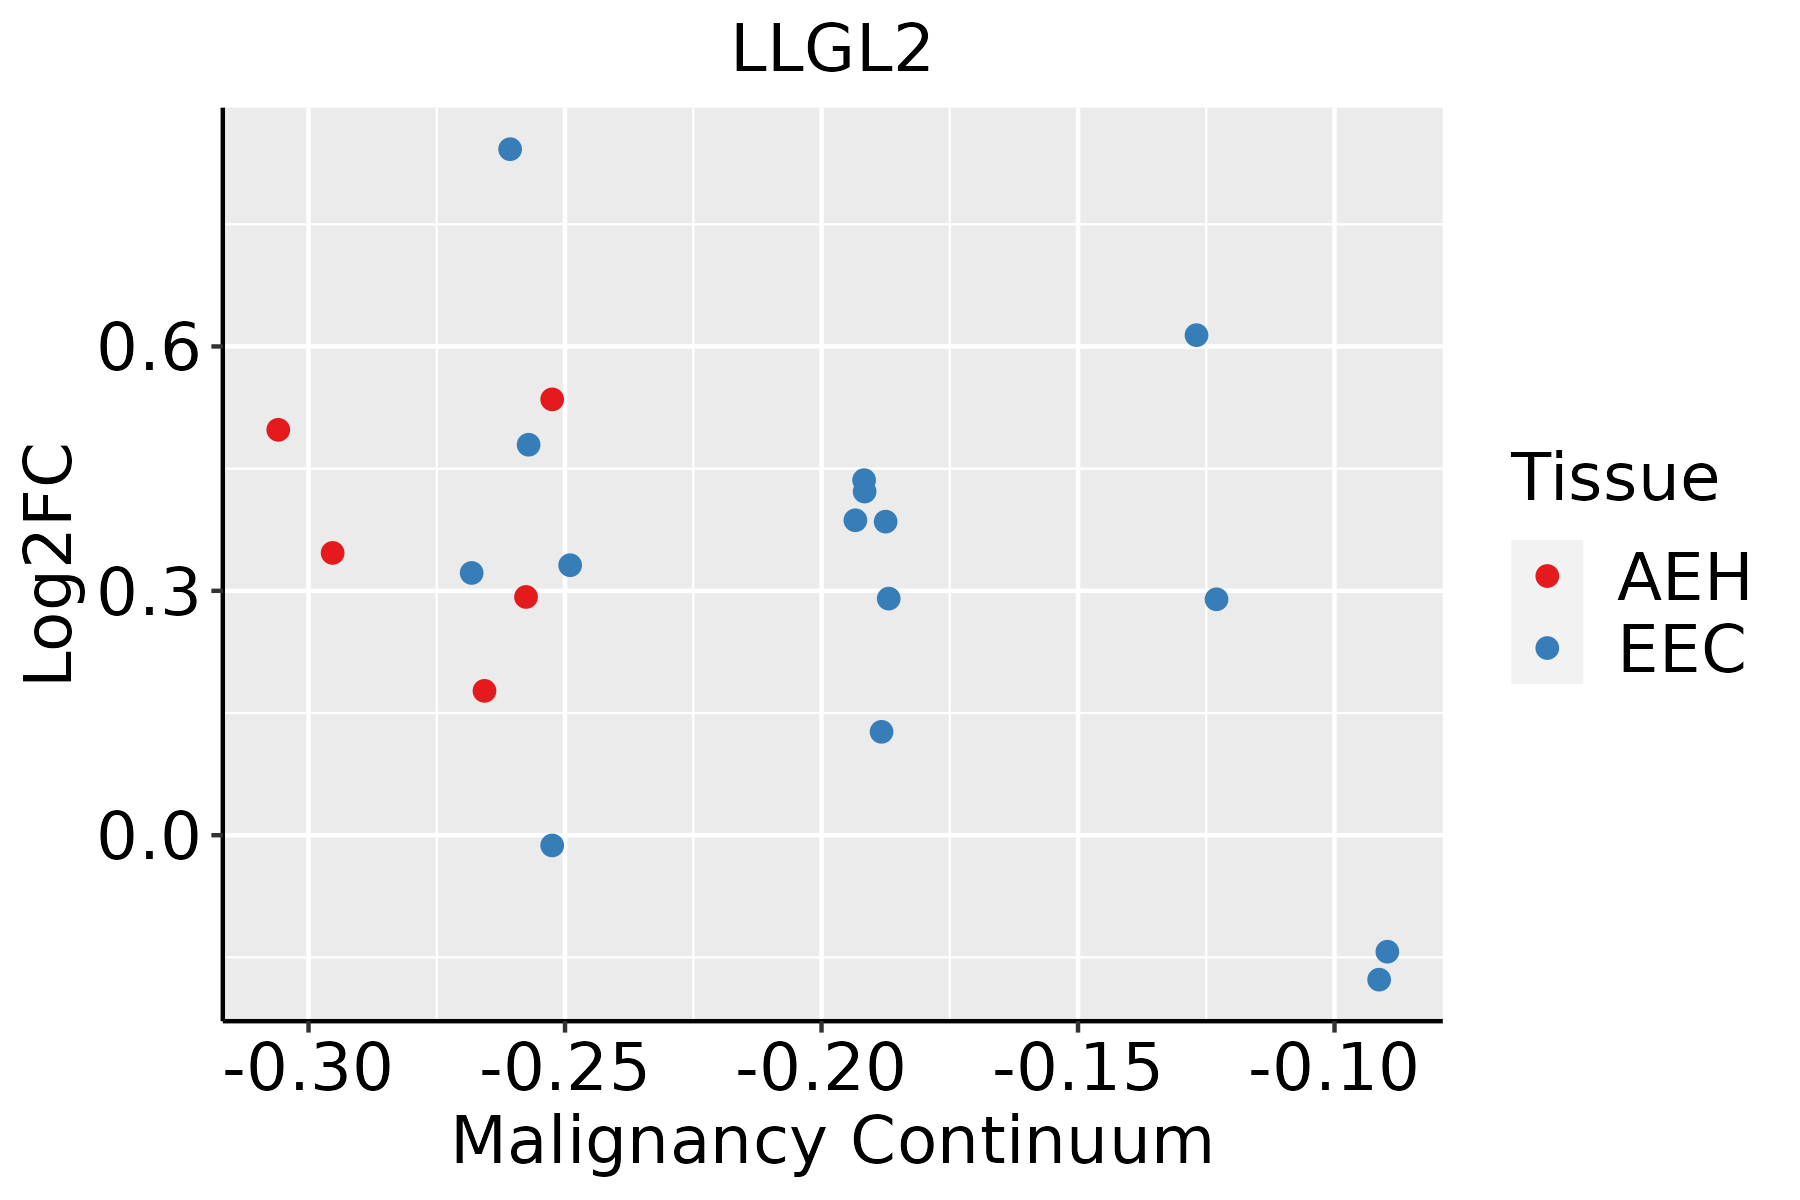 | AEH: Atypical endometrial hyperplasia |
| EEC: Endometrioid Cancer | ||
| Esophagus |  | ESCC: Esophageal squamous cell carcinoma |
| HGIN: High-grade intraepithelial neoplasias | ||
| LGIN: Low-grade intraepithelial neoplasias | ||
| GC | 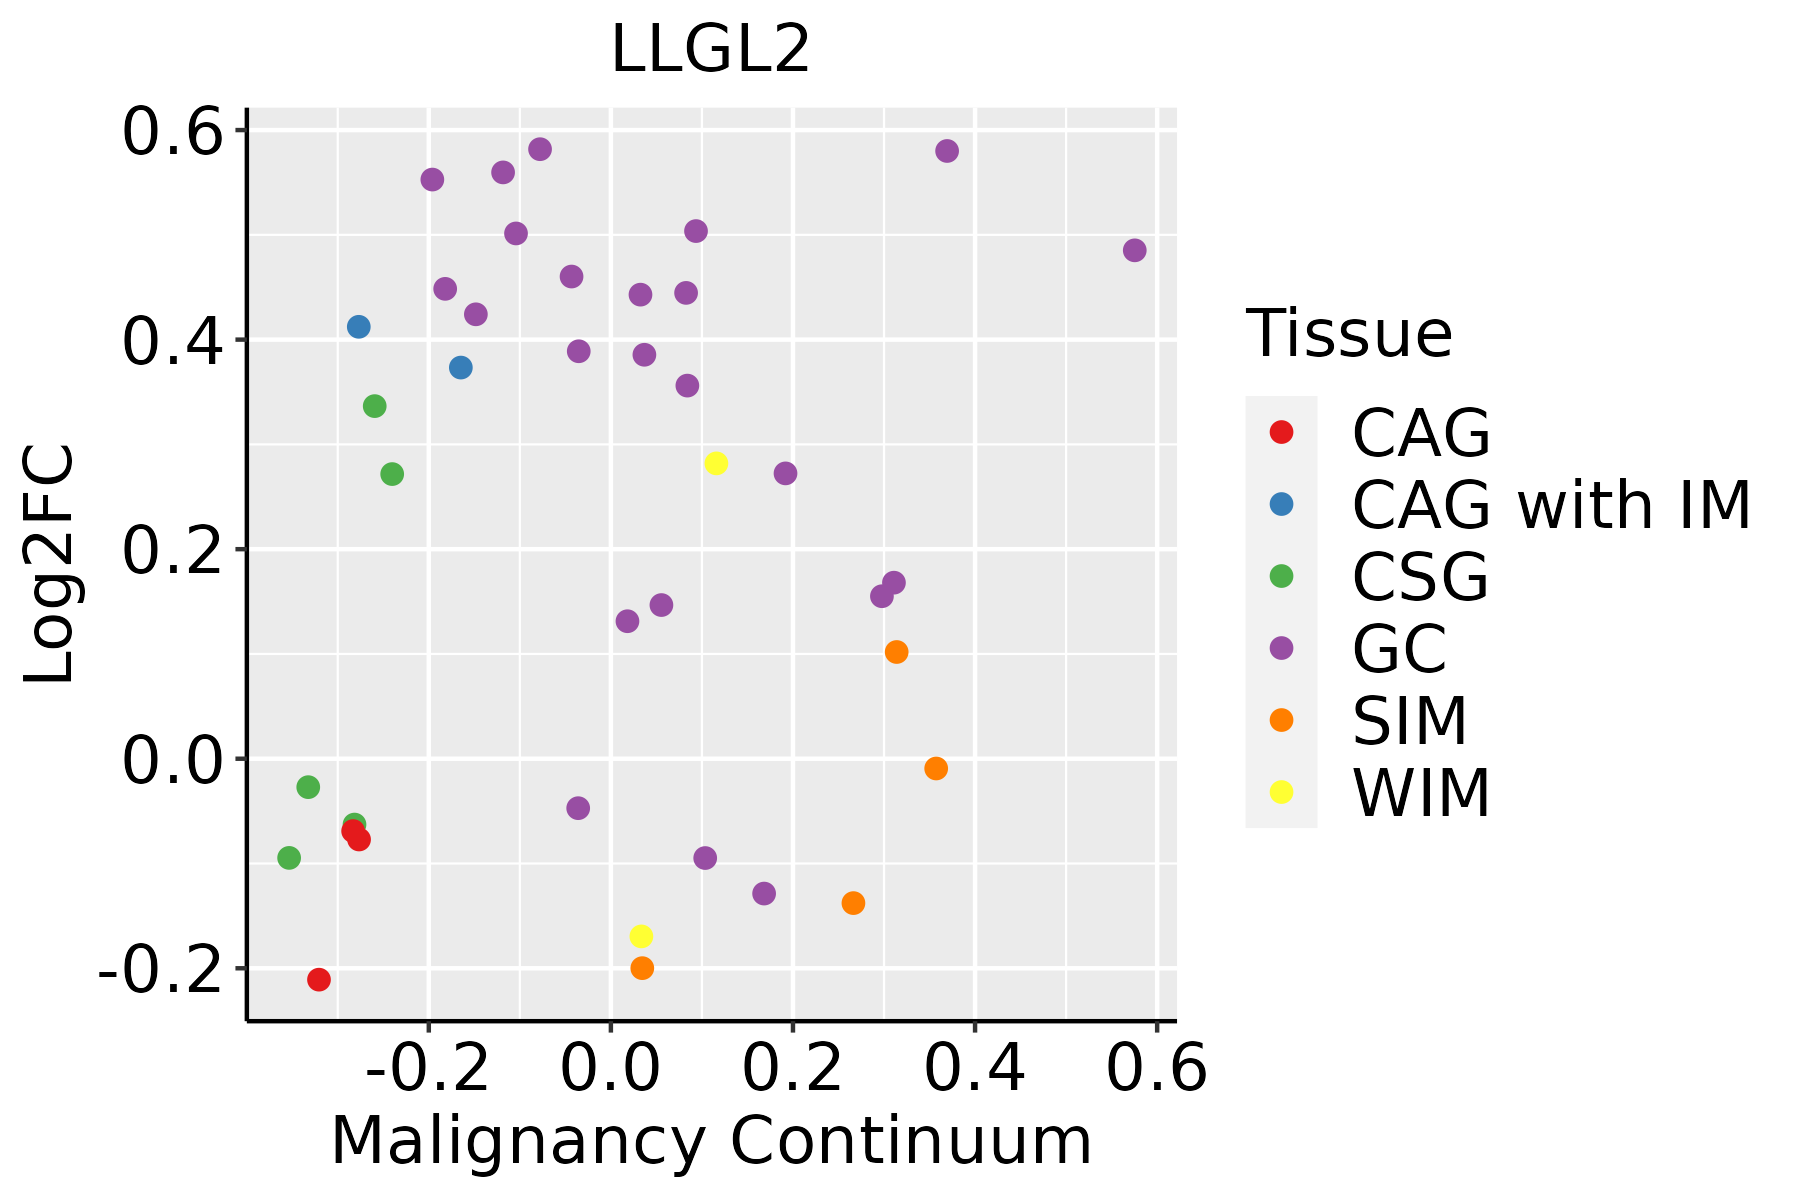 | CAG: Chronic atrophic gastritis |
| CAG with IM: Chronic atrophic gastritis with intestinal metaplasia | ||
| CSG: Chronic superficial gastritis | ||
| GC: Gastric cancer | ||
| SIM: Severe intestinal metaplasia | ||
| WIM: Wild intestinal metaplasia | ||
| Liver | 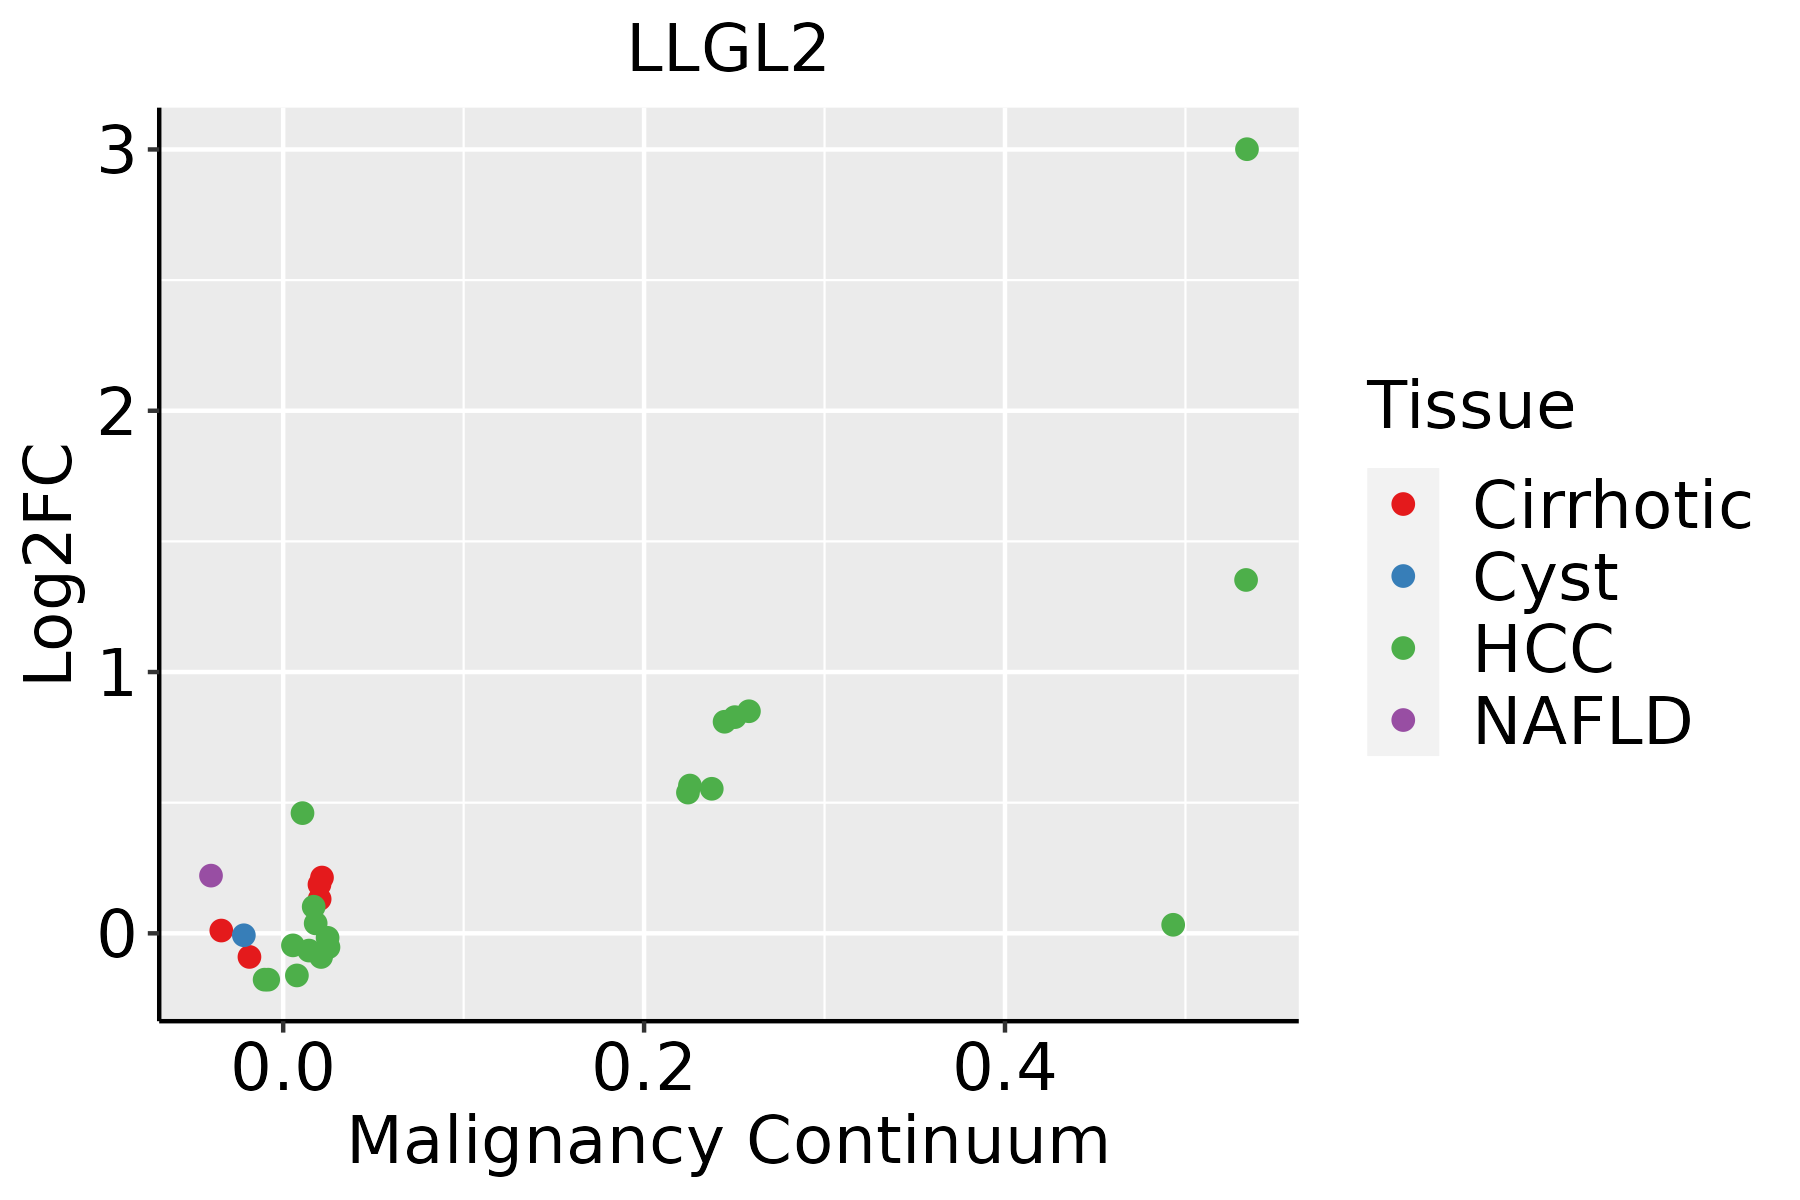 | HCC: Hepatocellular carcinoma |
| NAFLD: Non-alcoholic fatty liver disease | ||
| Lung | 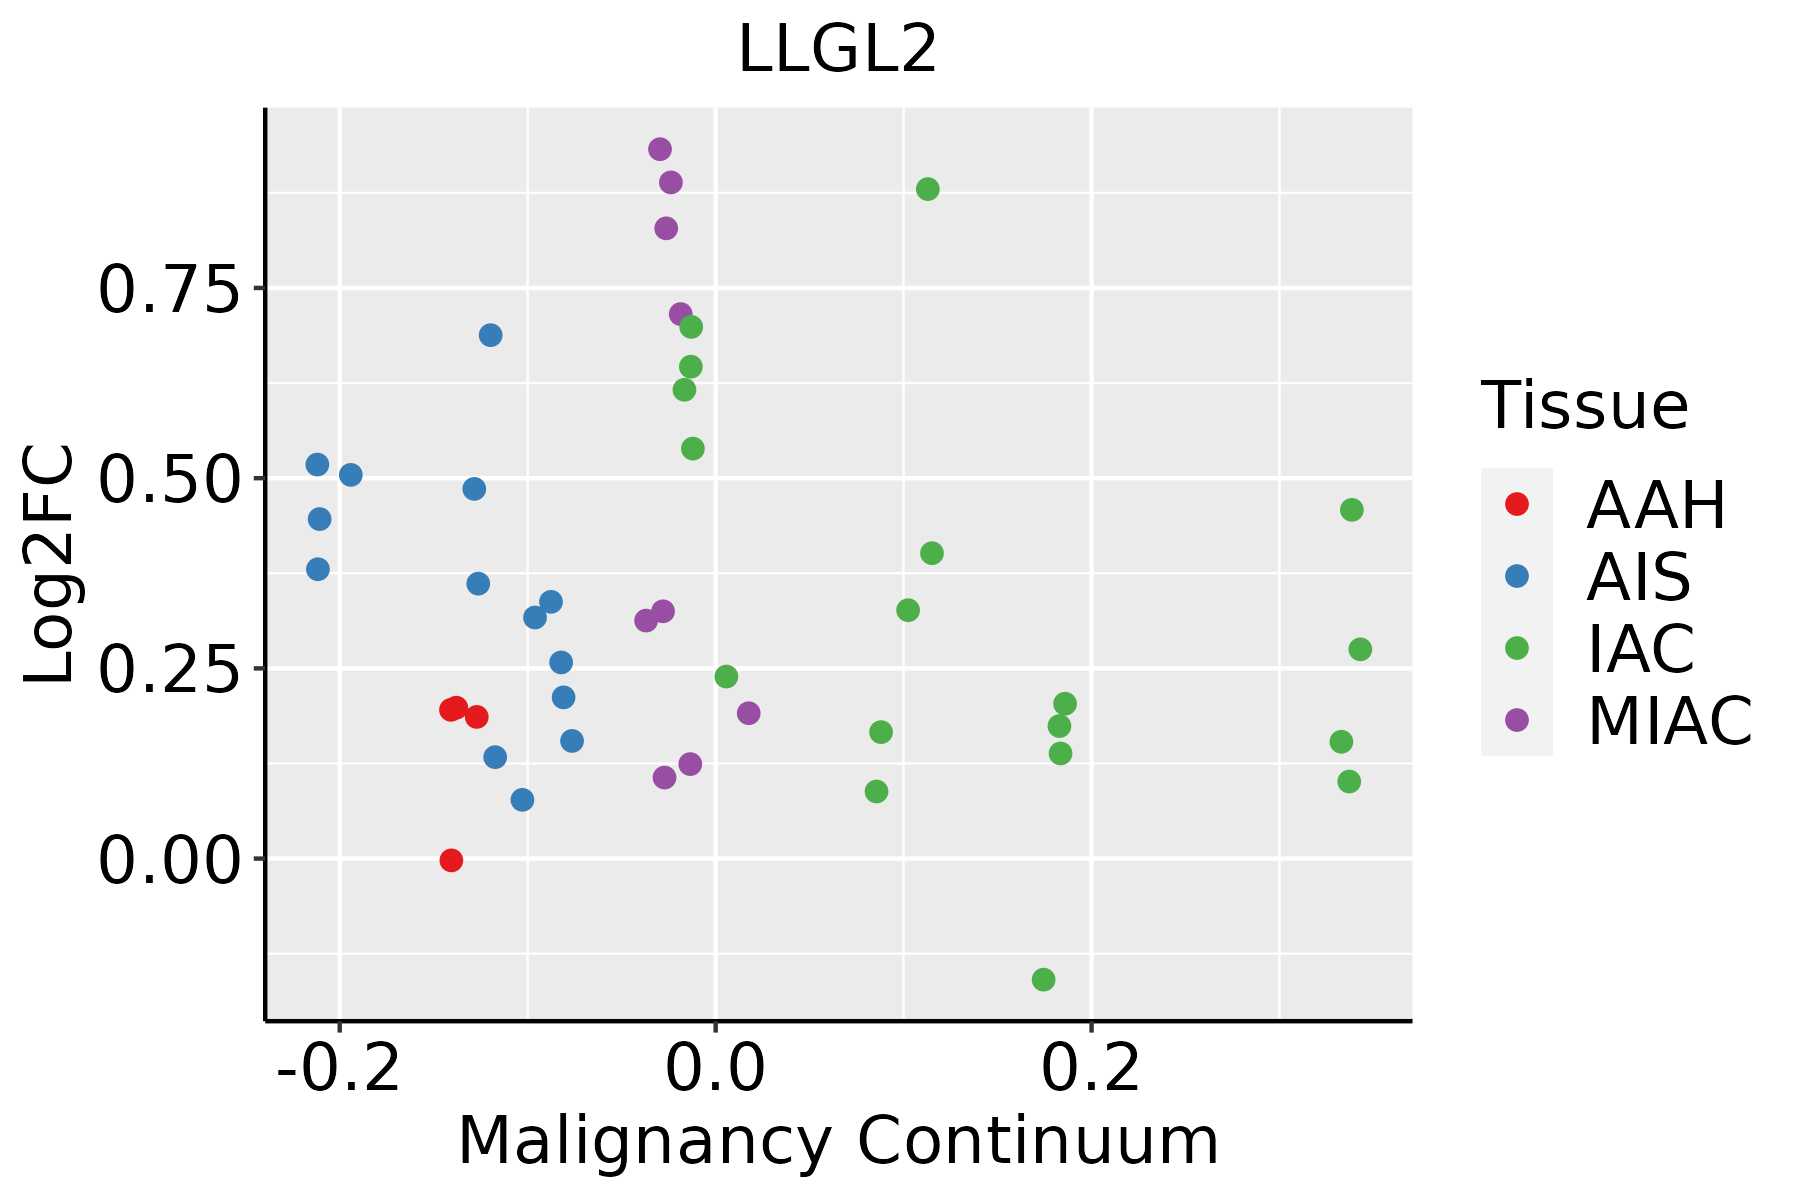 | AAH: Atypical adenomatous hyperplasia |
| AIS: Adenocarcinoma in situ | ||
| IAC: Invasive lung adenocarcinoma | ||
| MIA: Minimally invasive adenocarcinoma | ||
| Oral Cavity |  | EOLP: Erosive Oral lichen planus |
| LP: leukoplakia | ||
| NEOLP: Non-erosive oral lichen planus | ||
| OSCC: Oral squamous cell carcinoma | ||
| Thyroid | 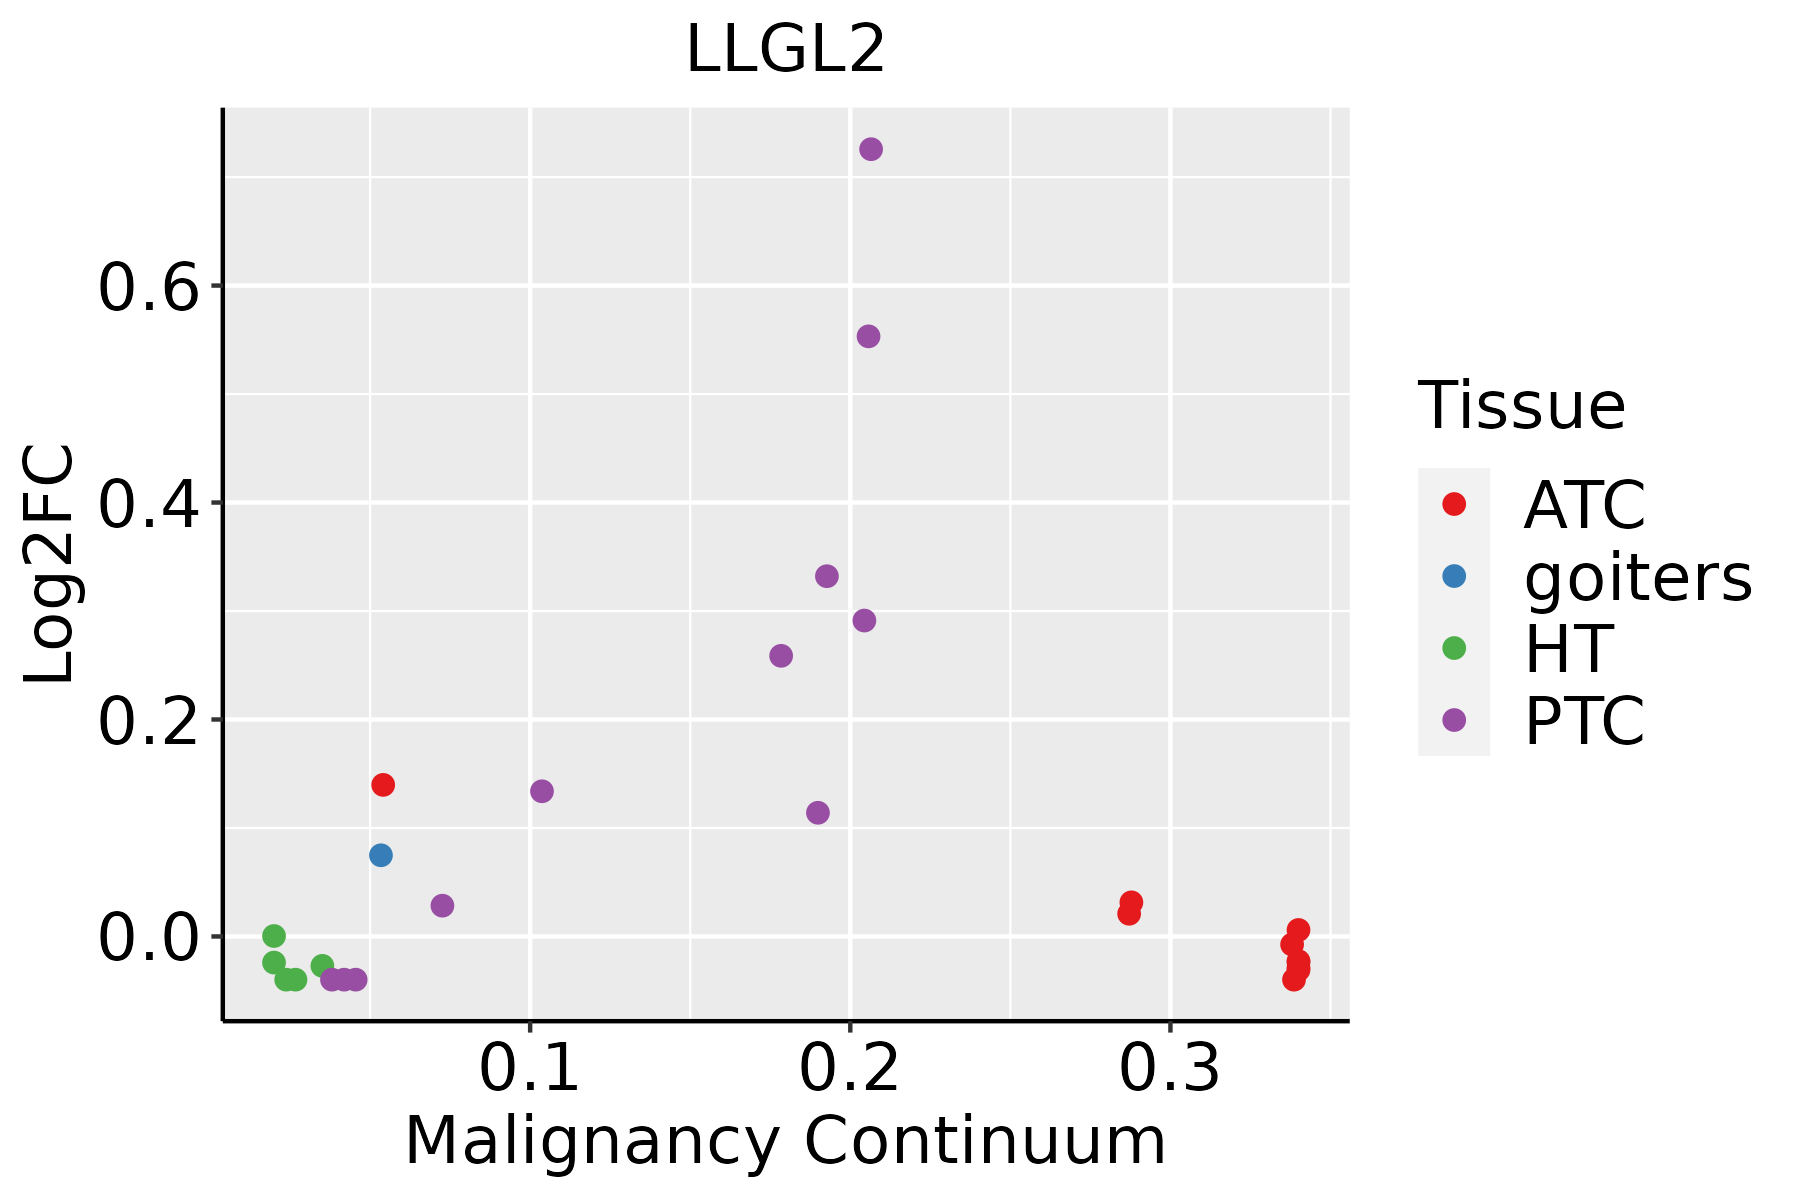 | ATC: Anaplastic thyroid cancer |
| HT: Hashimoto's thyroiditis | ||
| PTC: Papillary thyroid cancer |
| ∗log2FC in expression of this searched gene in stem-like cells from each diseased tissue sample relative to stem-like cells in normal samples in each tissue plotted against the malignancy continuum. Samples are colored based on if they are from different disease stage. |
Top |
Malignant transformation related pathway analysis |
| Find out the enriched GO biological processes and KEGG pathways involved in transition from healthy to precancer to cancer |
| Tissue | Disease Stage | Enriched GO biological Processes |
| Colorectum | AD |  |
| Colorectum | SER |  |
| Colorectum | MSS |  |
| Colorectum | MSI-H |  |
| Colorectum | FAP |  |
| ∗Top 15 enriched GO BP terms are showed in the bar plot of each disease state in each tissue. Each row represents a significant GO biological process which is colored according to the -log10(p.adjust). |
| Page: 1 2 3 4 5 6 7 8 9 |
| GO ID | Tissue | Disease Stage | Description | Gene Ratio | Bg Ratio | pvalue | p.adjust | Count |
| GO:003001022 | Liver | HCC | establishment of cell polarity | 82/7958 | 143/18723 | 2.38e-04 | 1.79e-03 | 82 |
| GO:003559212 | Liver | HCC | establishment of protein localization to extracellular region | 176/7958 | 360/18723 | 7.96e-03 | 3.15e-02 | 176 |
| GO:000930612 | Liver | HCC | protein secretion | 175/7958 | 359/18723 | 9.32e-03 | 3.57e-02 | 175 |
| GO:00071637 | Lung | IAC | establishment or maintenance of cell polarity | 61/2061 | 218/18723 | 3.10e-12 | 3.07e-09 | 61 |
| GO:00300107 | Lung | IAC | establishment of cell polarity | 46/2061 | 143/18723 | 7.70e-12 | 4.27e-09 | 46 |
| GO:00328785 | Lung | IAC | regulation of establishment or maintenance of cell polarity | 14/2061 | 25/18723 | 5.04e-08 | 5.44e-06 | 14 |
| GO:00516566 | Lung | IAC | establishment of organelle localization | 64/2061 | 390/18723 | 7.12e-04 | 9.50e-03 | 64 |
| GO:00085932 | Lung | IAC | regulation of Notch signaling pathway | 20/2061 | 95/18723 | 3.15e-03 | 2.75e-02 | 20 |
| GO:000716313 | Lung | AIS | establishment or maintenance of cell polarity | 56/1849 | 218/18723 | 1.31e-11 | 6.13e-09 | 56 |
| GO:003001013 | Lung | AIS | establishment of cell polarity | 42/1849 | 143/18723 | 5.03e-11 | 1.95e-08 | 42 |
| GO:003287812 | Lung | AIS | regulation of establishment or maintenance of cell polarity | 13/1849 | 25/18723 | 1.36e-07 | 1.44e-05 | 13 |
| GO:005165612 | Lung | AIS | establishment of organelle localization | 59/1849 | 390/18723 | 6.08e-04 | 9.24e-03 | 59 |
| GO:00085931 | Lung | AIS | regulation of Notch signaling pathway | 20/1849 | 95/18723 | 8.52e-04 | 1.17e-02 | 20 |
| GO:00072193 | Lung | AIS | Notch signaling pathway | 29/1849 | 172/18723 | 2.93e-03 | 2.92e-02 | 29 |
| GO:003001031 | Lung | MIAC | establishment of cell polarity | 27/967 | 143/18723 | 4.16e-09 | 4.27e-06 | 27 |
| GO:000716332 | Lung | MIAC | establishment or maintenance of cell polarity | 34/967 | 218/18723 | 7.70e-09 | 4.94e-06 | 34 |
| GO:003287831 | Lung | MIAC | regulation of establishment or maintenance of cell polarity | 8/967 | 25/18723 | 2.42e-05 | 1.53e-03 | 8 |
| GO:005165622 | Lung | MIAC | establishment of organelle localization | 35/967 | 390/18723 | 1.09e-03 | 2.16e-02 | 35 |
| GO:005165610 | Oral cavity | OSCC | establishment of organelle localization | 239/7305 | 390/18723 | 2.46e-19 | 3.31e-17 | 239 |
| GO:000716318 | Oral cavity | OSCC | establishment or maintenance of cell polarity | 129/7305 | 218/18723 | 1.16e-09 | 2.86e-08 | 129 |
| Page: 1 2 3 4 5 6 7 8 9 |
| Pathway ID | Tissue | Disease Stage | Description | Gene Ratio | Bg Ratio | pvalue | p.adjust | qvalue | Count |
| hsa0453024 | Breast | IDC | Tight junction | 38/867 | 169/8465 | 2.07e-06 | 3.20e-05 | 2.39e-05 | 38 |
| hsa0453034 | Breast | IDC | Tight junction | 38/867 | 169/8465 | 2.07e-06 | 3.20e-05 | 2.39e-05 | 38 |
| hsa0453044 | Breast | DCIS | Tight junction | 37/846 | 169/8465 | 3.07e-06 | 4.20e-05 | 3.09e-05 | 37 |
| hsa0453054 | Breast | DCIS | Tight junction | 37/846 | 169/8465 | 3.07e-06 | 4.20e-05 | 3.09e-05 | 37 |
| hsa04530 | Colorectum | AD | Tight junction | 76/2092 | 169/8465 | 5.49e-09 | 9.69e-08 | 6.18e-08 | 76 |
| hsa045301 | Colorectum | AD | Tight junction | 76/2092 | 169/8465 | 5.49e-09 | 9.69e-08 | 6.18e-08 | 76 |
| hsa045302 | Colorectum | SER | Tight junction | 59/1580 | 169/8465 | 3.24e-07 | 5.98e-06 | 4.34e-06 | 59 |
| hsa045303 | Colorectum | SER | Tight junction | 59/1580 | 169/8465 | 3.24e-07 | 5.98e-06 | 4.34e-06 | 59 |
| hsa045308 | Colorectum | FAP | Tight junction | 60/1404 | 169/8465 | 1.40e-09 | 9.33e-08 | 5.67e-08 | 60 |
| hsa043902 | Colorectum | FAP | Hippo signaling pathway | 41/1404 | 157/8465 | 1.49e-03 | 7.91e-03 | 4.81e-03 | 41 |
| hsa045309 | Colorectum | FAP | Tight junction | 60/1404 | 169/8465 | 1.40e-09 | 9.33e-08 | 5.67e-08 | 60 |
| hsa043903 | Colorectum | FAP | Hippo signaling pathway | 41/1404 | 157/8465 | 1.49e-03 | 7.91e-03 | 4.81e-03 | 41 |
| hsa0453010 | Colorectum | CRC | Tight junction | 44/1091 | 169/8465 | 2.51e-06 | 7.61e-05 | 5.16e-05 | 44 |
| hsa043904 | Colorectum | CRC | Hippo signaling pathway | 32/1091 | 157/8465 | 5.17e-03 | 2.72e-02 | 1.84e-02 | 32 |
| hsa0453011 | Colorectum | CRC | Tight junction | 44/1091 | 169/8465 | 2.51e-06 | 7.61e-05 | 5.16e-05 | 44 |
| hsa043905 | Colorectum | CRC | Hippo signaling pathway | 32/1091 | 157/8465 | 5.17e-03 | 2.72e-02 | 1.84e-02 | 32 |
| hsa0453026 | Endometrium | AEH | Tight junction | 54/1197 | 169/8465 | 1.99e-09 | 3.80e-08 | 2.78e-08 | 54 |
| hsa043909 | Endometrium | AEH | Hippo signaling pathway | 38/1197 | 157/8465 | 4.79e-04 | 3.38e-03 | 2.47e-03 | 38 |
| hsa04530112 | Endometrium | AEH | Tight junction | 54/1197 | 169/8465 | 1.99e-09 | 3.80e-08 | 2.78e-08 | 54 |
| hsa0439014 | Endometrium | AEH | Hippo signaling pathway | 38/1197 | 157/8465 | 4.79e-04 | 3.38e-03 | 2.47e-03 | 38 |
| Page: 1 2 3 4 |
Top |
Cell-cell communication analysis |
| Identification of potential cell-cell interactions between two cell types and their ligand-receptor pairs for different disease states |
| Ligand | Receptor | LRpair | Pathway | Tissue | Disease Stage |
| Page: 1 |
Top |
Single-cell gene regulatory network inference analysis |
| Find out the significant the regulons (TFs) and the target genes of each regulon across cell types for different disease states |
| TF | Cell Type | Tissue | Disease Stage | Target Gene | RSS | Regulon Activity |
| ∗The dot plots of a searched regulon are shown for all cell subpopulations in each disease state of each tissue based on the regulon specific score inferred using pySCENIC and by calculating the average expression. |
| Page: 1 |
Top |
Somatic mutation of malignant transformation related genes |
| Annotation of somatic variants for genes involved in malignant transformation |
| Hugo Symbol | Variant Class | Variant Classification | dbSNP RS | HGVSc | HGVSp | HGVSp Short | SWISSPROT | BIOTYPE | SIFT | PolyPhen | Tumor Sample Barcode | Tissue | Histology | Sex | Age | Stage | Therapy Types | Drugs | Outcome |
| LLGL2 | SNV | Missense_Mutation | c.1306N>C | p.Asp436His | p.D436H | Q6P1M3 | protein_coding | deleterious(0.01) | probably_damaging(0.989) | TCGA-A8-A09I-01 | Breast | breast invasive carcinoma | Female | >=65 | I/II | Hormone Therapy | anastrozole | SD | |
| LLGL2 | SNV | Missense_Mutation | c.469N>G | p.Gln157Glu | p.Q157E | Q6P1M3 | protein_coding | tolerated(0.77) | benign(0) | TCGA-D8-A1XL-01 | Breast | breast invasive carcinoma | Female | <65 | I/II | Chemotherapy | doxorubicine+cyclophosphamide+tamoxifen | SD | |
| LLGL2 | SNV | Missense_Mutation | c.1681C>A | p.His561Asn | p.H561N | Q6P1M3 | protein_coding | deleterious(0) | possibly_damaging(0.881) | TCGA-D8-A4Z1-01 | Breast | breast invasive carcinoma | Female | >=65 | I/II | Hormone Therapy | tamoxiphen | SD | |
| LLGL2 | SNV | Missense_Mutation | rs750945305 | c.934N>T | p.Arg312Cys | p.R312C | Q6P1M3 | protein_coding | deleterious(0) | probably_damaging(1) | TCGA-E9-A1RH-01 | Breast | breast invasive carcinoma | Female | <65 | I/II | Chemotherapy | 5-fluorouracil | SD |
| LLGL2 | insertion | Frame_Shift_Ins | novel | c.2144_2145insAGTCATTCCGCCGGATGCGT | p.Leu716ValfsTer15 | p.L716Vfs*15 | Q6P1M3 | protein_coding | TCGA-A7-A0CJ-01 | Breast | breast invasive carcinoma | Female | <65 | I/II | Chemotherapy | cytoxan | SD | ||
| LLGL2 | deletion | Frame_Shift_Del | novel | c.519_523delGGTGC | p.Val174AlafsTer76 | p.V174Afs*76 | Q6P1M3 | protein_coding | TCGA-D8-A1XF-01 | Breast | breast invasive carcinoma | Female | <65 | I/II | Chemotherapy | adriamycin+cyclophosphamide | SD | ||
| LLGL2 | deletion | Frame_Shift_Del | novel | c.264delN | p.Val89SerfsTer14 | p.V89Sfs*14 | Q6P1M3 | protein_coding | TCGA-D8-A27V-01 | Breast | breast invasive carcinoma | Female | <65 | I/II | Hormone Therapy | tamoxiphen | SD | ||
| LLGL2 | SNV | Missense_Mutation | c.784G>A | p.Glu262Lys | p.E262K | Q6P1M3 | protein_coding | tolerated(0.16) | benign(0) | TCGA-IR-A3LH-01 | Cervix | cervical & endocervical cancer | Female | <65 | I/II | Chemotherapy | cisplatin | CR | |
| LLGL2 | SNV | Missense_Mutation | rs199973131 | c.1976G>A | p.Arg659Gln | p.R659Q | Q6P1M3 | protein_coding | tolerated(0.05) | benign(0.03) | TCGA-LP-A4AV-01 | Cervix | cervical & endocervical cancer | Female | <65 | I/II | Unknown | Unknown | SD |
| LLGL2 | SNV | Missense_Mutation | novel | c.658N>A | p.Gly220Ser | p.G220S | Q6P1M3 | protein_coding | tolerated(0.96) | benign(0.001) | TCGA-A6-3809-01 | Colorectum | colon adenocarcinoma | Female | >=65 | I/II | Unknown | Unknown | SD |
| Page: 1 2 3 4 5 6 7 |
Top |
Related drugs of malignant transformation related genes |
| Identification of chemicals and drugs interact with genes involved in malignant transfromation |
| (DGIdb 4.0) |
| Entrez ID | Symbol | Category | Interaction Types | Drug Claim Name | Drug Name | PMIDs |
| Page: 1 |

Copyright 2023-Present -The University of Texas Health Science Center at Houston |