Schematic overview of the cellular and molecular mechanisms involved in the cancer progression, including the proposed cellular and molecular mechanisms in cancer cells trajectory. AT1: alveolar type 1 cells; AT2: alveolar type 2 cells; AAH: atypical adenomatous hyperplasia; AIS: adenocarcinoma in situ; MIA: minimally invasive adenocarcinoma; IA: invasive adenocarcinoma; EMT: epithelial-mesenchymal transition

Home

Download

Statistics

Help

Contact

Center for Computational Systems Medicine
leaf

Gene summary

leaf

Malignant transformation analysis

leaf

Malignant transformation related pathway analysis

leaf

Cell-cell communication analysis

leaf

Single-cell gene regulatory network inference analysis

leaf

Somatic mutation of malignant transformation related genes

leaf

Related drugs of malignant transformation related genes

Gene: LETM1

Gene summary for LETM1

check button Gene summary.

Gene informationSpeciesHuman
Gene symbol

LETM1

Gene ID

3954

Gene nameleucine zipper and EF-hand containing transmembrane protein 1
Gene AliasSLC55A1
Cytomap4p16.3
Gene Typeprotein-coding
GO ID

GO:0006810

UniProtAcc

O95202


Top

Malignant transformation analysis

check button Identification of the aberrant gene expression in precancerous and cancerous lesions by comparing the gene expression of stem-like cells in diseased tissues with normal stem cells
check button Malignant transformation involving gene list.
Entrez IDSymbolReplicatesSpeciesOrganTissueAdj P-valueLog2FCMalignancy
3954LETM1HTA11_2487_2000001011HumanColorectumSER1.38e-086.55e-01-0.1808
3954LETM1HTA11_347_2000001011HumanColorectumAD4.16e-166.17e-01-0.1954
3954LETM1HTA11_411_2000001011HumanColorectumSER2.19e-027.19e-01-0.2602
3954LETM1HTA11_3361_2000001011HumanColorectumAD4.60e-023.06e-01-0.1207
3954LETM1HTA11_83_2000001011HumanColorectumSER1.14e-045.41e-01-0.1526
3954LETM1HTA11_696_2000001011HumanColorectumAD3.34e-114.96e-01-0.1464
3954LETM1HTA11_866_2000001011HumanColorectumAD1.11e-063.20e-01-0.1001
3954LETM1HTA11_1391_2000001011HumanColorectumAD4.61e-074.93e-01-0.059
3954LETM1HTA11_99999971662_82457HumanColorectumMSS7.28e-074.24e-010.3859
3954LETM1A015-C-203HumanColorectumFAP3.63e-02-1.39e-01-0.1294
3954LETM1A002-C-205HumanColorectumFAP2.28e-03-1.02e-01-0.1236
3954LETM1A015-C-006HumanColorectumFAP1.58e-02-1.24e-01-0.0994
3954LETM1A002-C-114HumanColorectumFAP1.57e-02-1.28e-01-0.1561
3954LETM1A015-C-104HumanColorectumFAP8.40e-04-1.18e-01-0.1899
3954LETM1A002-C-116HumanColorectumFAP4.59e-05-1.79e-01-0.0452
3954LETM1A018-E-020HumanColorectumFAP3.19e-03-1.55e-01-0.2034
3954LETM1LZE20THumanEsophagusESCC1.55e-032.02e-010.0662
3954LETM1LZE22THumanEsophagusESCC1.57e-023.04e-010.068
3954LETM1LZE24THumanEsophagusESCC2.11e-102.26e-010.0596
3954LETM1P1T-EHumanEsophagusESCC3.31e-052.89e-010.0875
Page: 1 2 3 4 5 6 

check button Transcriptomic changes along malignancy continuum.
TissueExpression DynamicsAbbreviation
Colorectum (GSE201348)The image shows the transcriptomic changes along malignancy continuum.log2FC in expression of this searched gene in stem-like cells from each diseased tissue sample relative to stem-like cells in normal samples in each tissue plotted against the malignancy continuum. Samples are colored based on if they are from different disease stage.
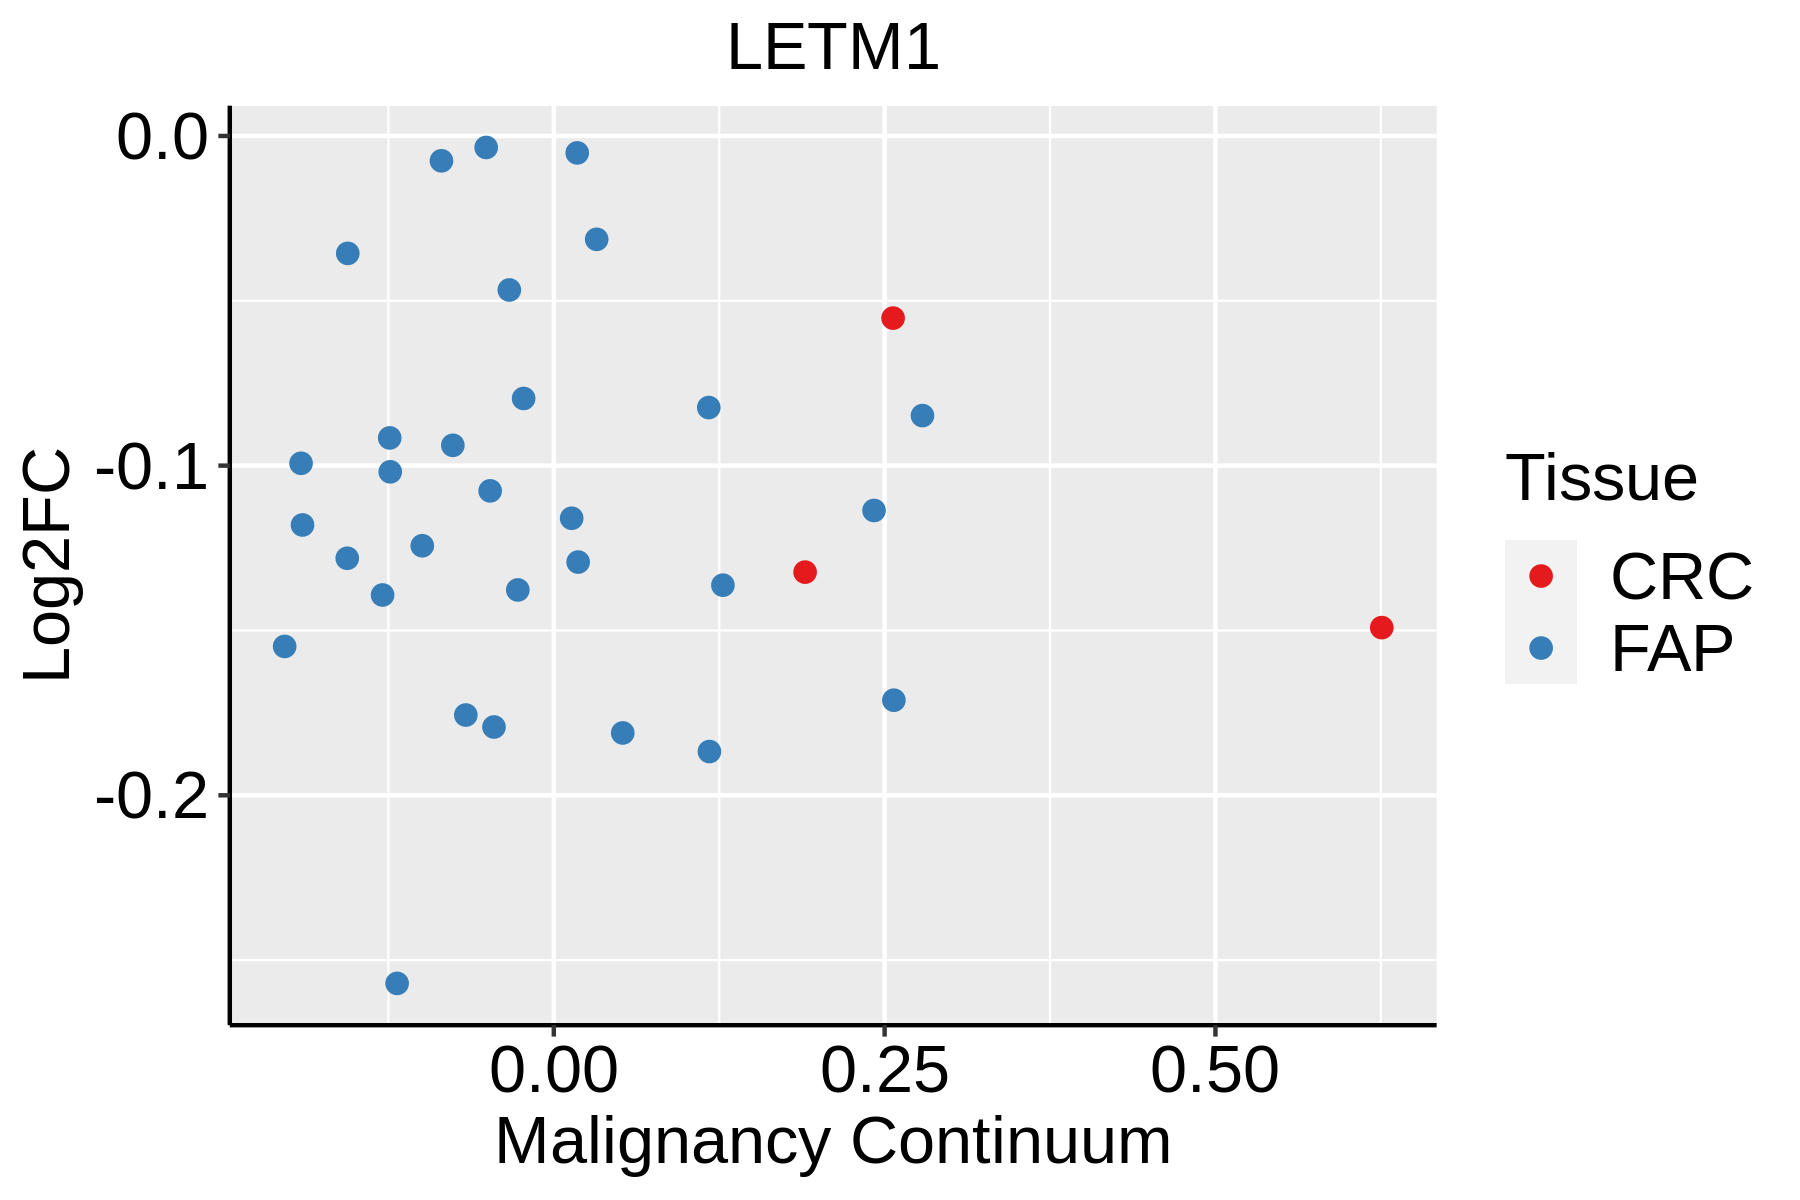
FAP: Familial adenomatous polyposis
CRC: Colorectal cancer
Colorectum (HTA11)The image shows the transcriptomic changes along malignancy continuum.log2FC in expression of this searched gene in stem-like cells from each diseased tissue sample relative to stem-like cells in normal samples in each tissue plotted against the malignancy continuum. Samples are colored based on if they are from different disease stage.AD: Adenomas
SER: Sessile serrated lesions
MSI-H: Microsatellite-high colorectal cancer
MSS: Microsatellite stable colorectal cancer
EsophagusThe image shows the transcriptomic changes along malignancy continuum.log2FC in expression of this searched gene in stem-like cells from each diseased tissue sample relative to stem-like cells in normal samples in each tissue plotted against the malignancy continuum. Samples are colored based on if they are from different disease stage.
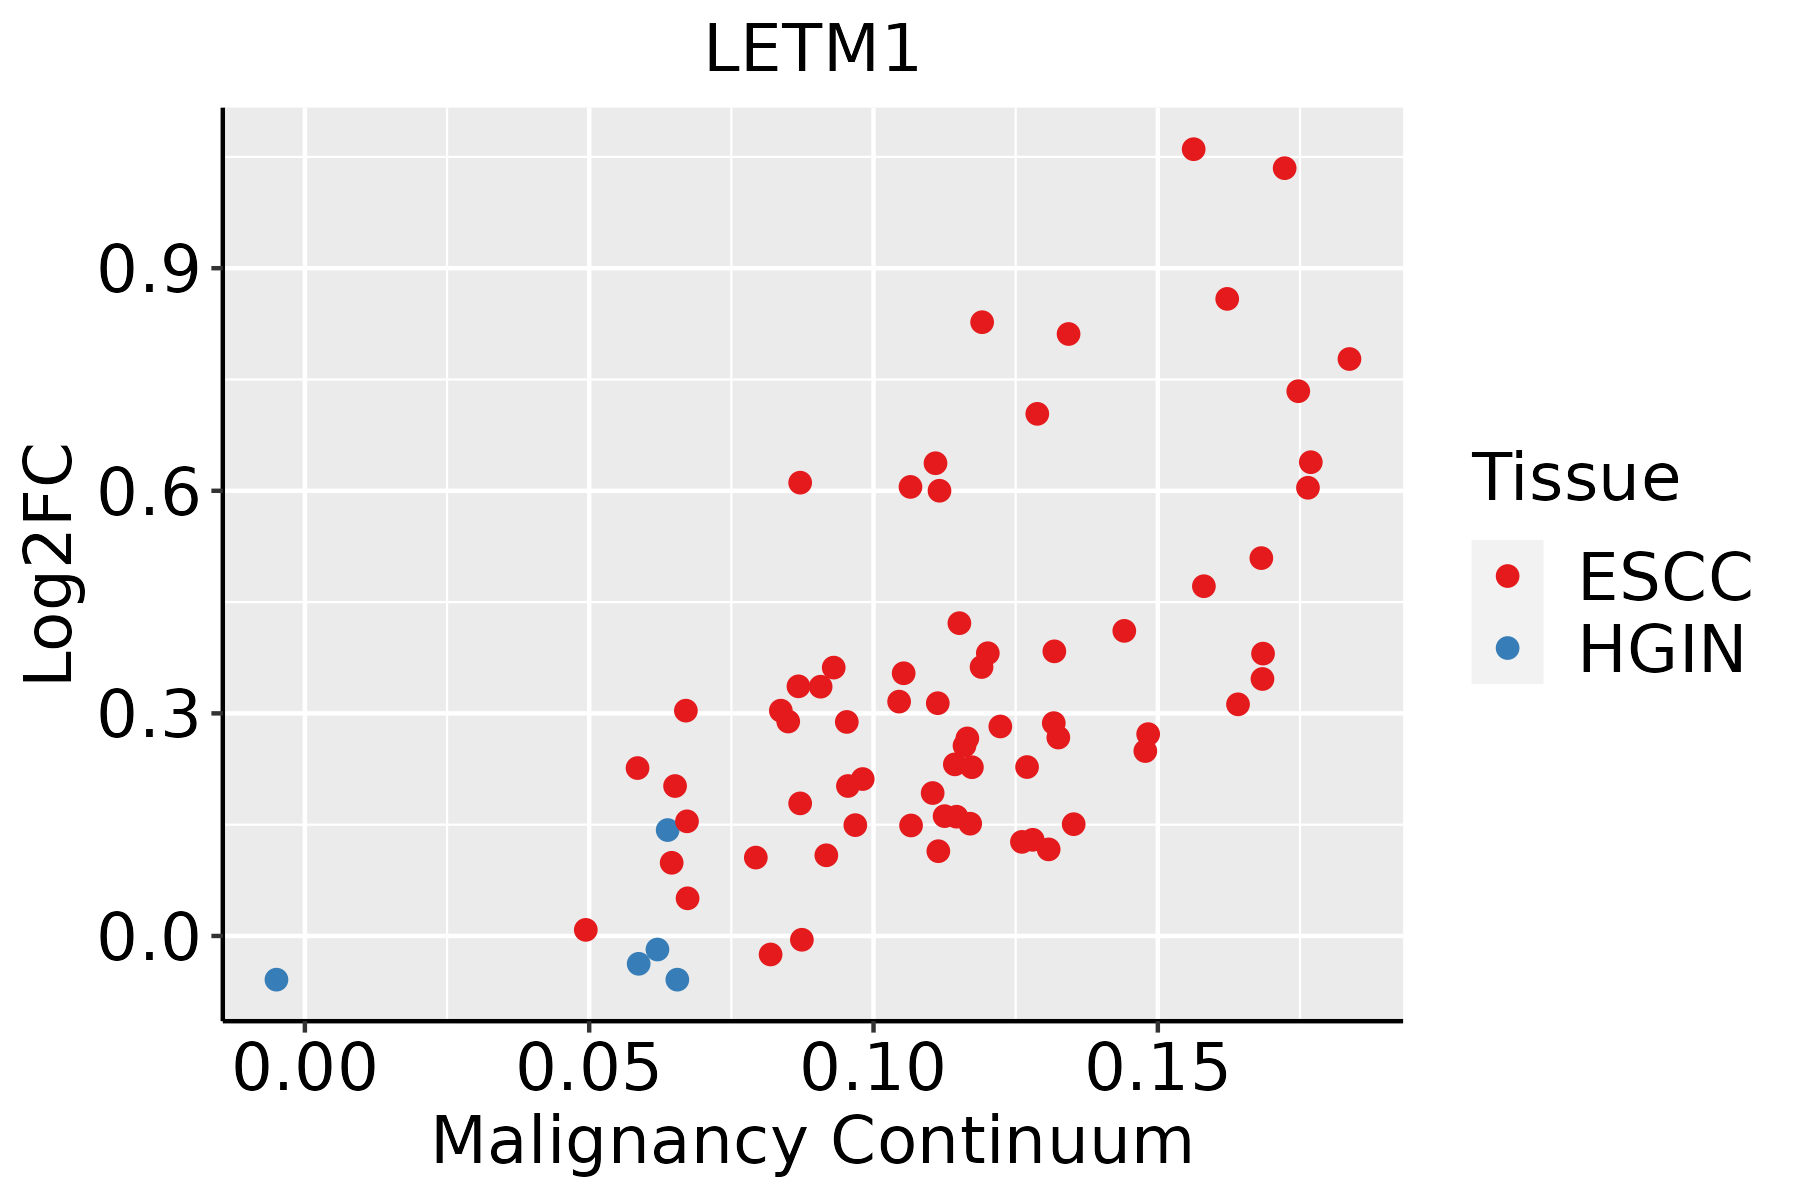
ESCC: Esophageal squamous cell carcinoma
HGIN: High-grade intraepithelial neoplasias
LGIN: Low-grade intraepithelial neoplasias
LiverThe image shows the transcriptomic changes along malignancy continuum.log2FC in expression of this searched gene in stem-like cells from each diseased tissue sample relative to stem-like cells in normal samples in each tissue plotted against the malignancy continuum. Samples are colored based on if they are from different disease stage.
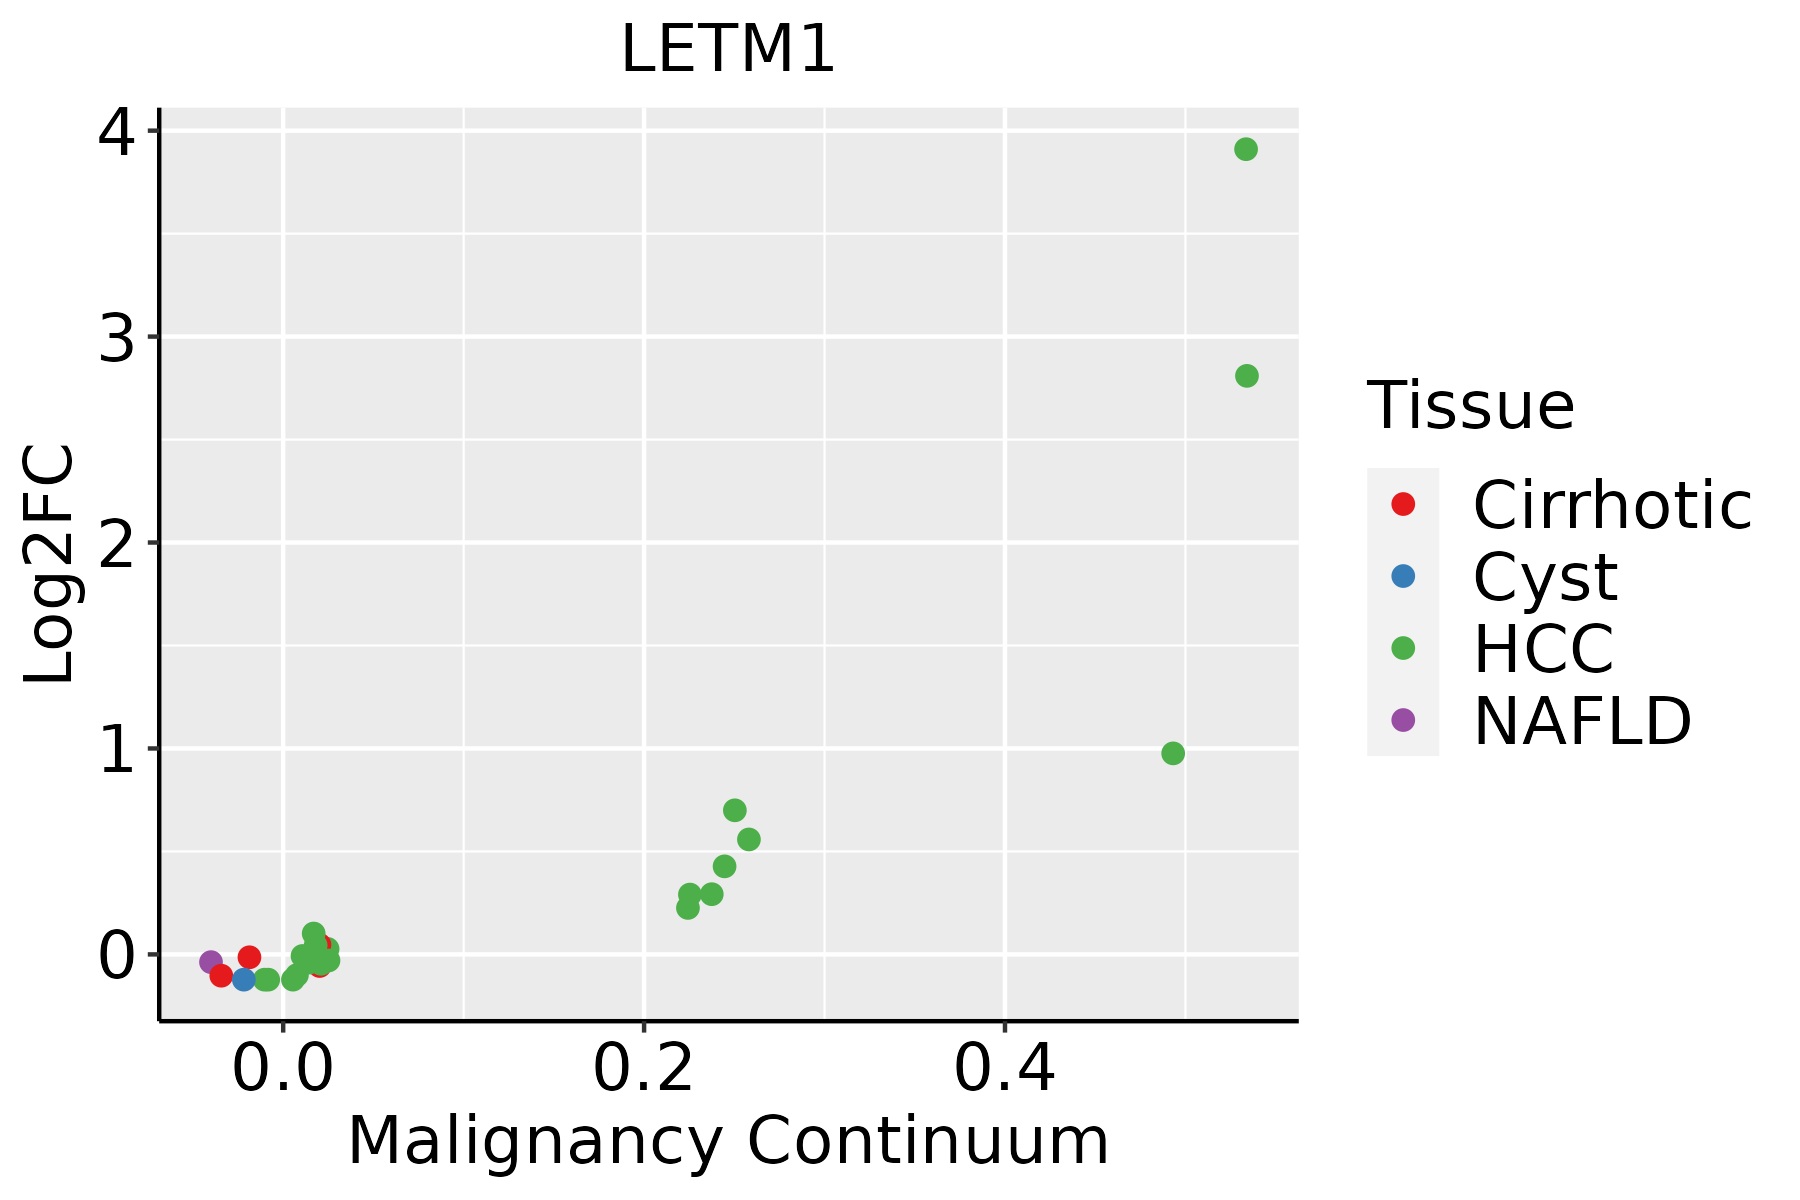
HCC: Hepatocellular carcinoma
NAFLD: Non-alcoholic fatty liver disease
Oral CavityThe image shows the transcriptomic changes along malignancy continuum.log2FC in expression of this searched gene in stem-like cells from each diseased tissue sample relative to stem-like cells in normal samples in each tissue plotted against the malignancy continuum. Samples are colored based on if they are from different disease stage.
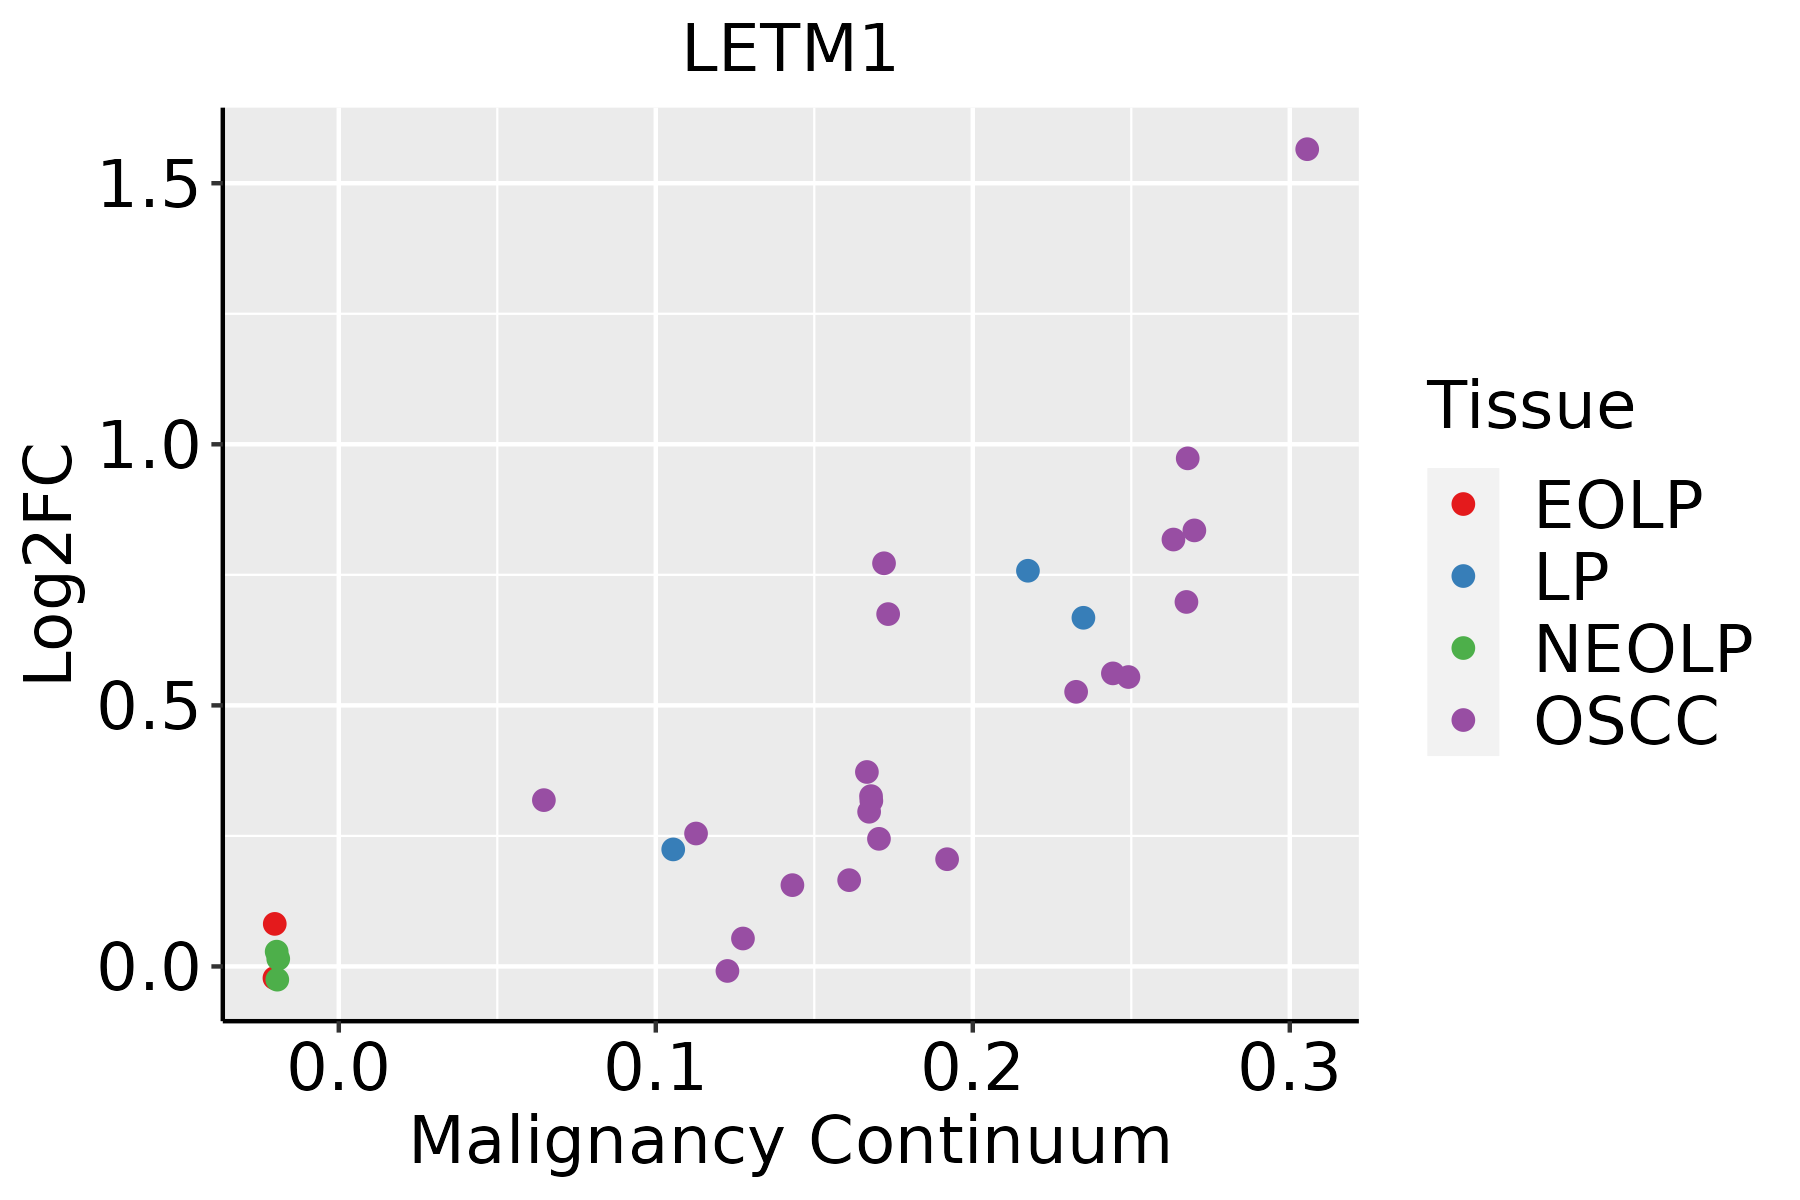
EOLP: Erosive Oral lichen planus
LP: leukoplakia
NEOLP: Non-erosive oral lichen planus
OSCC: Oral squamous cell carcinoma
SkinThe image shows the transcriptomic changes along malignancy continuum.log2FC in expression of this searched gene in stem-like cells from each diseased tissue sample relative to stem-like cells in normal samples in each tissue plotted against the malignancy continuum. Samples are colored based on if they are from different disease stage.
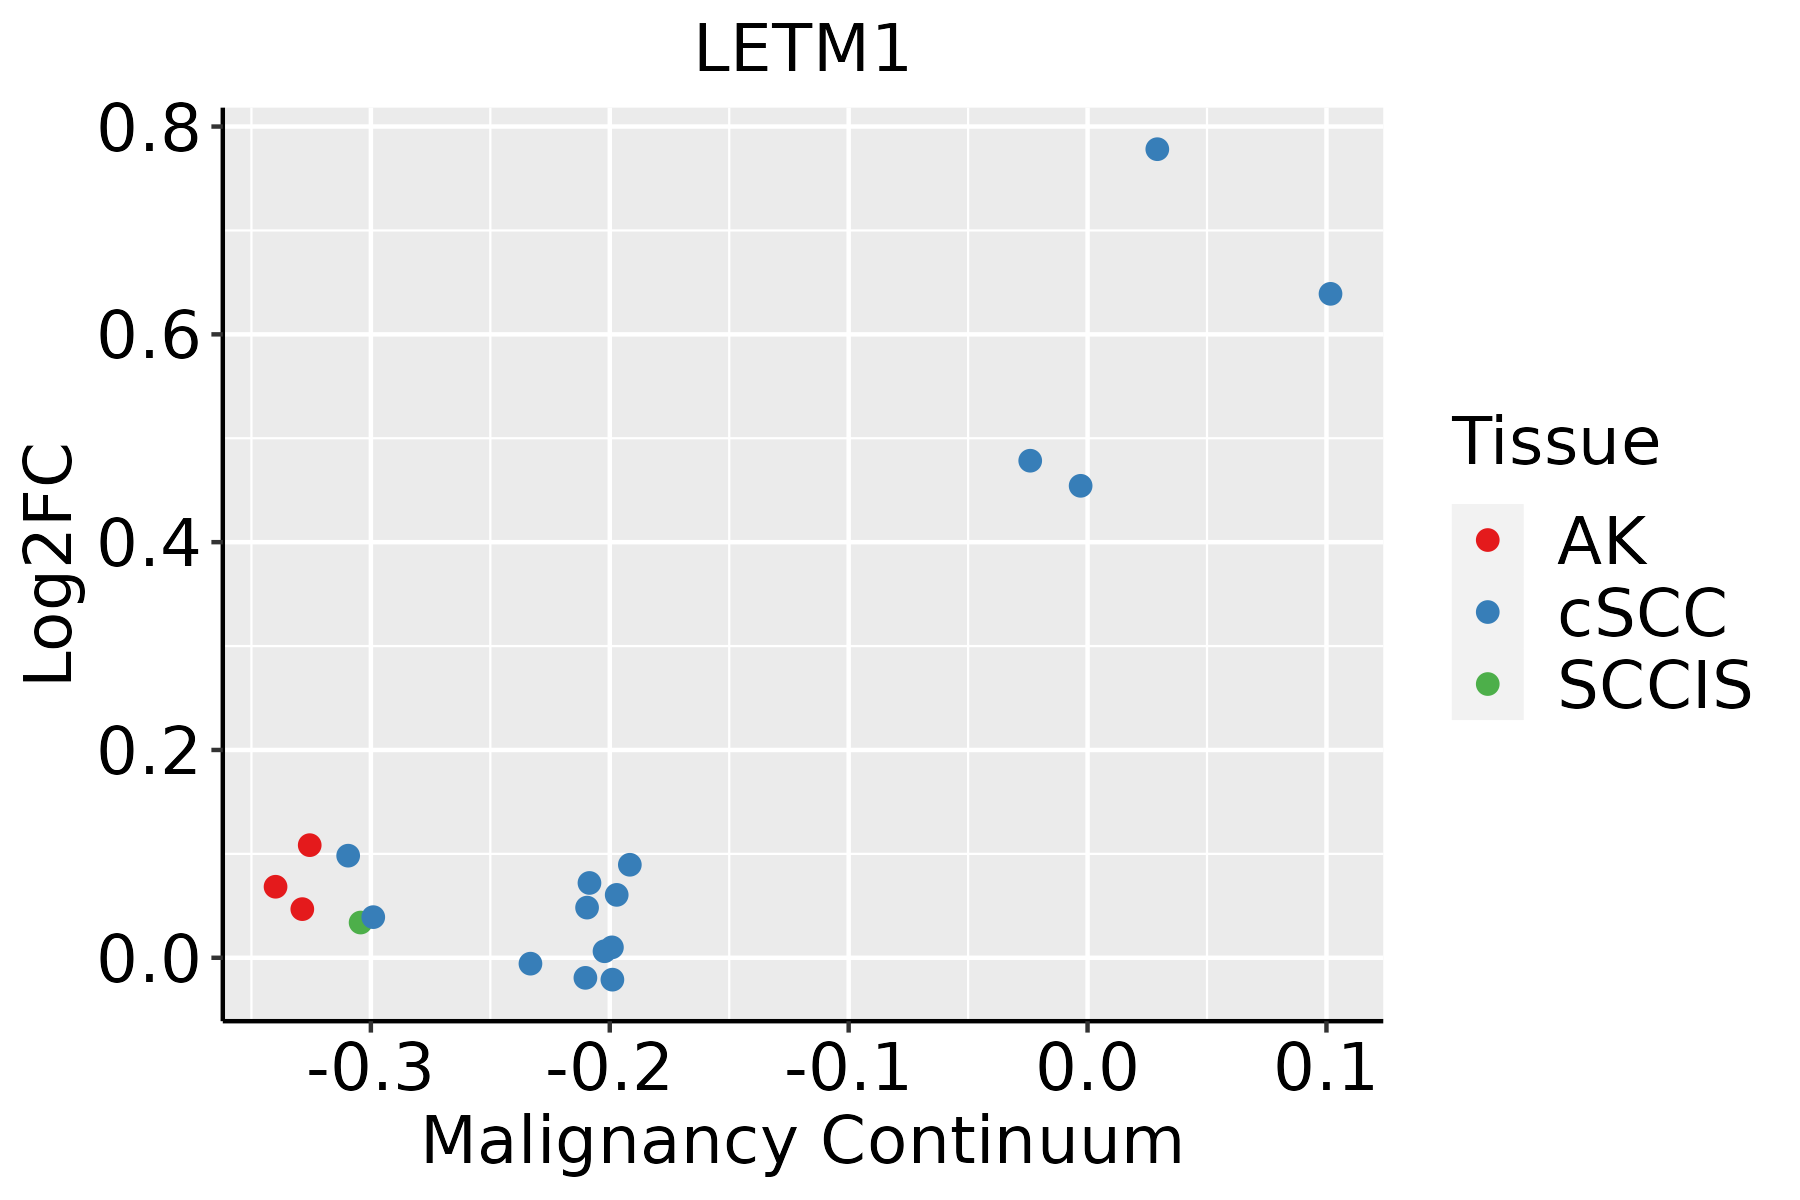
AK: Actinic keratosis
cSCC: Cutaneous squamous cell carcinoma
SCCIS:squamous cell carcinoma in situ
ThyroidThe image shows the transcriptomic changes along malignancy continuum.log2FC in expression of this searched gene in stem-like cells from each diseased tissue sample relative to stem-like cells in normal samples in each tissue plotted against the malignancy continuum. Samples are colored based on if they are from different disease stage.
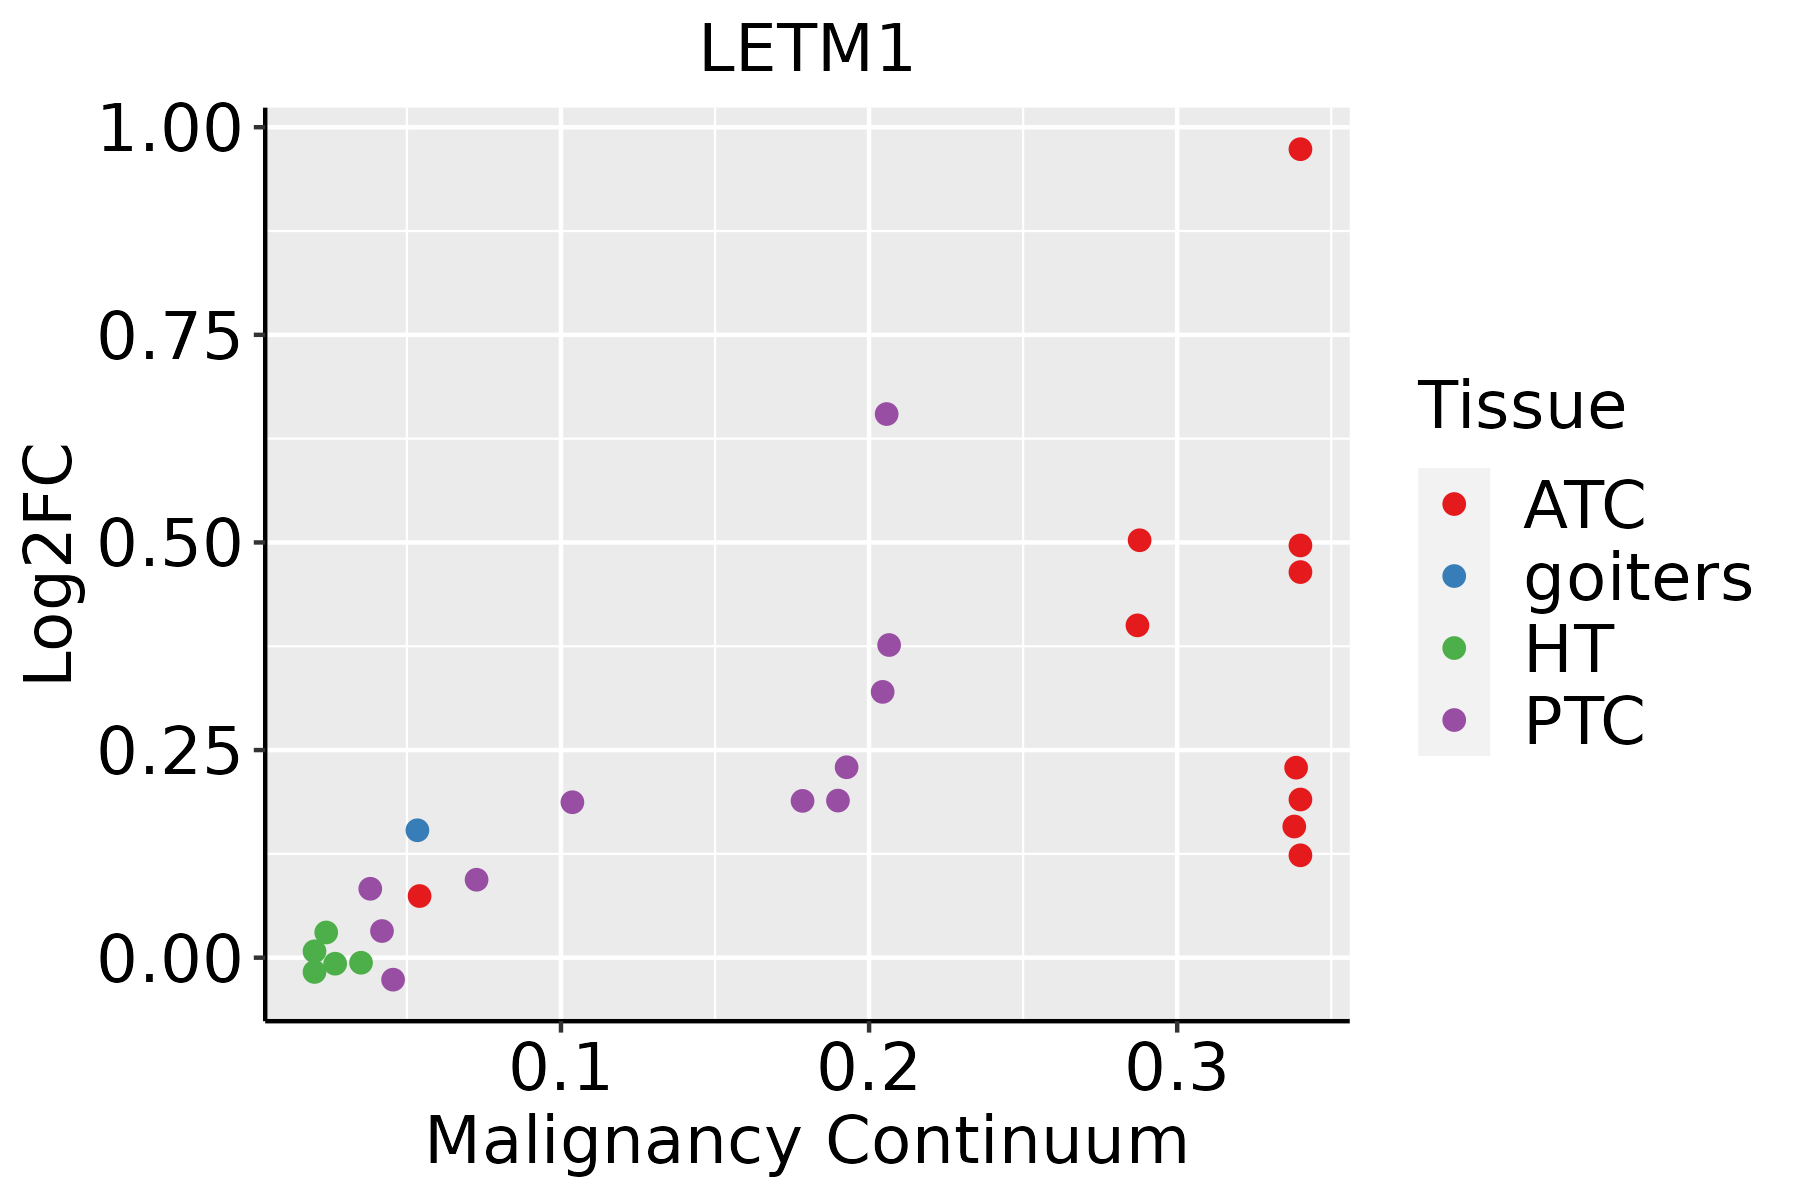
ATC: Anaplastic thyroid cancer
HT: Hashimoto's thyroiditis
PTC: Papillary thyroid cancer
∗log2FC in expression of this searched gene in stem-like cells from each diseased tissue sample relative to stem-like cells in normal samples in each tissue plotted against the malignancy continuum. Samples are colored based on if they are from different disease stage.

Top

Malignant transformation related pathway analysis

check buttonFind out the enriched GO biological processes and KEGG pathways involved in transition from healthy to precancer to cancer
check button Figure of enriched GO biological processes.
TissueDisease StageEnriched GO biological Processes
ColorectumADGO analysis - Figure of enriched GO biological processes: Top 15 enriched GO BP terms are showed in the bar plot of each disease state in each tissue. Each row represents a significant GO biological process which is colored according to the -log10(p.adjust).
ColorectumSERGO analysis - Figure of enriched GO biological processes: Top 15 enriched GO BP terms are showed in the bar plot of each disease state in each tissue. Each row represents a significant GO biological process which is colored according to the -log10(p.adjust).
ColorectumMSSGO analysis - Figure of enriched GO biological processes: Top 15 enriched GO BP terms are showed in the bar plot of each disease state in each tissue. Each row represents a significant GO biological process which is colored according to the -log10(p.adjust).
ColorectumMSI-HGO analysis - Figure of enriched GO biological processes: Top 15 enriched GO BP terms are showed in the bar plot of each disease state in each tissue. Each row represents a significant GO biological process which is colored according to the -log10(p.adjust).
ColorectumFAPGO analysis - Figure of enriched GO biological processes: Top 15 enriched GO BP terms are showed in the bar plot of each disease state in each tissue. Each row represents a significant GO biological process which is colored according to the -log10(p.adjust).
∗Top 15 enriched GO BP terms are showed in the bar plot of each disease state in each tissue. Each row represents a significant GO biological process which is colored according to the -log10(p.adjust).
Page: 1 2 3 4 5 6 7 8 9 

check button Enriched GO biological processes.
GO IDTissueDisease StageDescriptionGene RatioBg Ratiopvaluep.adjustCount
GO:199054224SkincSCCmitochondrial transmembrane transport43/4864102/187232.68e-042.16e-0343
GO:000697021SkincSCCresponse to osmotic stress35/486484/187231.23e-037.97e-0335
GO:005123527SkincSCCmaintenance of location106/4864327/187235.17e-032.61e-02106
GO:005165128SkincSCCmaintenance of location in cell72/4864214/187237.37e-033.47e-0272
GO:00424073SkincSCCcristae formation9/486416/187239.73e-034.31e-029
GO:000683928ThyroidPTCmitochondrial transport150/5968254/187232.76e-193.34e-17150
GO:0062197113ThyroidPTCcellular response to chemical stress180/5968337/187231.36e-161.16e-14180
GO:0071214111ThyroidPTCcellular response to abiotic stimulus158/5968331/187239.90e-102.89e-08158
GO:0104004111ThyroidPTCcellular response to environmental stimulus158/5968331/187239.90e-102.89e-08158
GO:000700624ThyroidPTCmitochondrial membrane organization68/5968116/187232.47e-096.88e-0868
GO:0051235112ThyroidPTCmaintenance of location148/5968327/187232.30e-074.07e-06148
GO:199054225ThyroidPTCmitochondrial transmembrane transport57/5968102/187234.49e-077.38e-0657
GO:0051651113ThyroidPTCmaintenance of location in cell100/5968214/187233.65e-064.67e-05100
GO:00068515ThyroidPTCmitochondrial calcium ion transmembrane transport16/596820/187231.31e-051.42e-0416
GO:00515608ThyroidPTCmitochondrial calcium ion homeostasis19/596826/187231.93e-051.98e-0419
GO:00070078ThyroidPTCinner mitochondrial membrane organization24/596838/187237.14e-056.19e-0424
GO:00069709ThyroidPTCresponse to osmotic stress42/596884/187234.07e-042.73e-0342
GO:00714743ThyroidPTCcellular hyperosmotic response11/596815/187231.19e-036.84e-0311
GO:00714709ThyroidPTCcellular response to osmotic stress22/596841/187233.11e-031.53e-0222
GO:0006972ThyroidPTChyperosmotic response16/596828/187234.99e-032.31e-0216
Page: 1 2 3 4 5 6 7 

check button Enriched KEGG pathways.
Pathway IDTissueDisease StageDescriptionGene RatioBg Ratiopvaluep.adjustqvalueCount
Page: 1 

Top

Cell-cell communication analysis

check buttonIdentification of potential cell-cell interactions between two cell types and their ligand-receptor pairs for different disease states
LigandReceptorLRpairPathwayTissueDisease Stage
Page: 1 

Top

Single-cell gene regulatory network inference analysis

check buttonFind out the significant the regulons (TFs) and the target genes of each regulon across cell types for different disease states
TFCell TypeTissueDisease StageTarget GeneRSSRegulon Activity
∗The dot plots of a searched regulon are shown for all cell subpopulations in each disease state of each tissue based on the regulon specific score inferred using pySCENIC and by calculating the average expression.
Page: 1 

Top

Somatic mutation of malignant transformation related genes

check buttonAnnotation of somatic variants for genes involved in malignant transformation
Hugo SymbolVariant ClassVariant ClassificationdbSNP RSHGVScHGVSpHGVSp ShortSWISSPROTBIOTYPESIFTPolyPhenTumor Sample BarcodeTissueHistologySexAgeStageTherapy TypesDrugsOutcome
LETM1SNVMissense_Mutationc.1145N>Ap.Arg382Glnp.R382QO95202protein_codingdeleterious(0)probably_damaging(0.998)TCGA-A2-A0CX-01Breastbreast invasive carcinomaFemale<65I/IIChemotherapyadriamycinSD
LETM1SNVMissense_Mutationc.721G>Ap.Glu241Lysp.E241KO95202protein_codingdeleterious(0.01)benign(0.327)TCGA-A2-A0T0-01Breastbreast invasive carcinomaFemale<65I/IIChemotherapytaxotereSD
LETM1SNVMissense_Mutationc.1845G>Ap.Met615Ilep.M615IO95202protein_codingdeleterious(0.03)probably_damaging(0.914)TCGA-AR-A24R-01Breastbreast invasive carcinomaFemale<65III/IVChemotherapycytoxanSD
LETM1SNVMissense_Mutationc.730T>Ap.Ser244Thrp.S244TO95202protein_codingtolerated(0.29)probably_damaging(0.996)TCGA-BH-A0DH-01Breastbreast invasive carcinomaFemale<65I/IIChemotherapycyclophosphamideSD
LETM1SNVMissense_Mutationc.870C>Ap.Phe290Leup.F290LO95202protein_codingtolerated(0.08)possibly_damaging(0.761)TCGA-BH-A0E2-01Breastbreast invasive carcinomaFemale<65III/IVChemotherapydoxorubicinSD
LETM1SNVMissense_Mutationc.1605G>Cp.Leu535Phep.L535FO95202protein_codingtolerated(0.05)benign(0.143)TCGA-GM-A2D9-01Breastbreast invasive carcinomaFemale>=65I/IIHormone TherapyarimidexSD
LETM1insertionFrame_Shift_Insrs745839823c.432_433insCp.Ala145ArgfsTer61p.A145Rfs*61O95202protein_codingTCGA-AR-A0TY-01Breastbreast invasive carcinomaFemale<65I/IIUnspecificPaclitaxelPD
LETM1deletionFrame_Shift_Delnovelc.1012delNp.Ile338SerfsTer18p.I338Sfs*18O95202protein_codingTCGA-D8-A27V-01Breastbreast invasive carcinomaFemale<65I/IIHormone TherapytamoxiphenSD
LETM1deletionFrame_Shift_Delnovelc.635delNp.Phe212SerfsTer18p.F212Sfs*18O95202protein_codingTCGA-EW-A2FV-01Breastbreast invasive carcinomaFemale<65III/IVChemotherapydocetaxelSD
LETM1SNVMissense_Mutationrs577048812c.1033C>Tp.Arg345Cysp.R345CO95202protein_codingdeleterious(0)benign(0.364)TCGA-2W-A8YY-01Cervixcervical & endocervical cancerFemale<65I/IIChemotherapycisplatinCR
Page: 1 2 3 4 5 6 7 

Top

Related drugs of malignant transformation related genes

check buttonIdentification of chemicals and drugs interact with genes involved in malignant transfromation
(DGIdb 4.0)
Entrez IDSymbolCategoryInteraction TypesDrug Claim NameDrug NamePMIDs
Page: 1