| Tissue | Expression Dynamics | Abbreviation |
| Cervix | 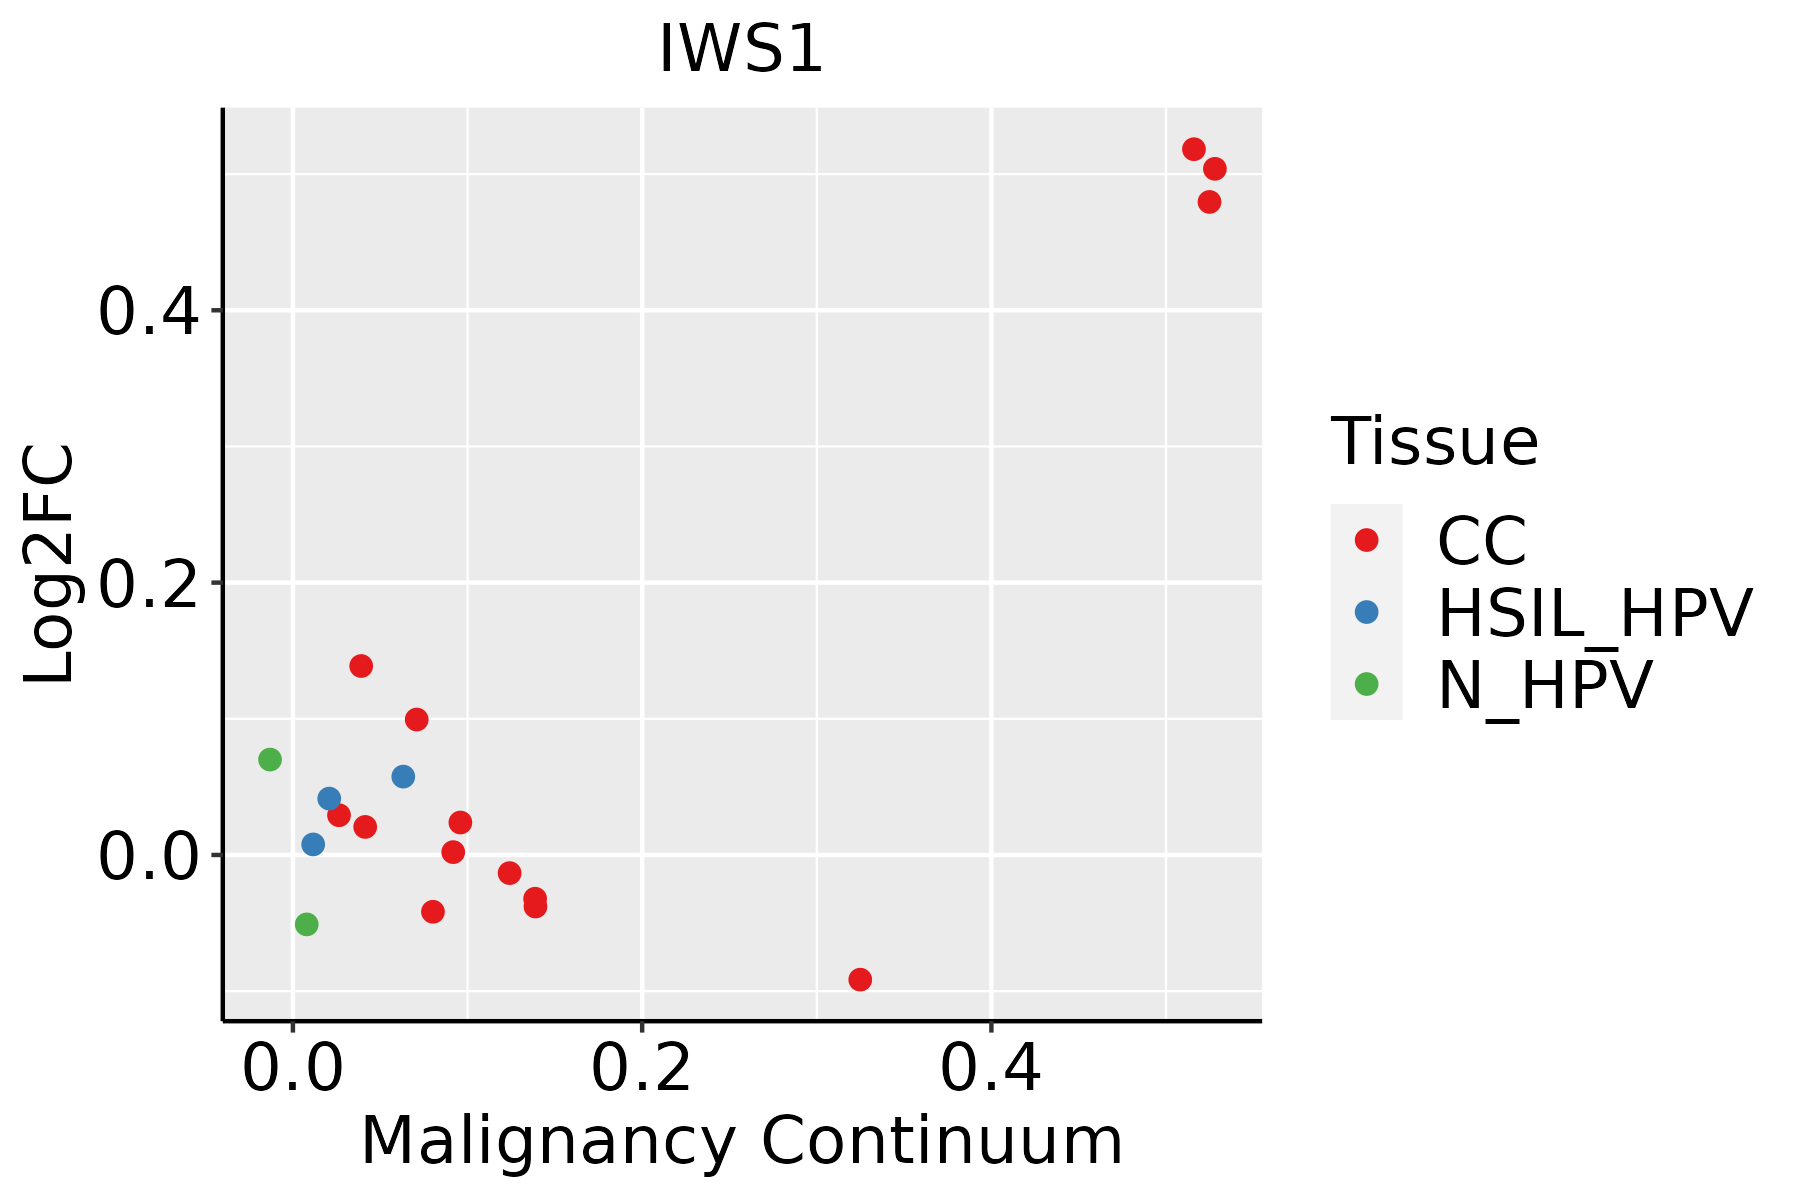 | CC: Cervix cancer |
| HSIL_HPV: HPV-infected high-grade squamous intraepithelial lesions |
| N_HPV: HPV-infected normal cervix |
| Esophagus | 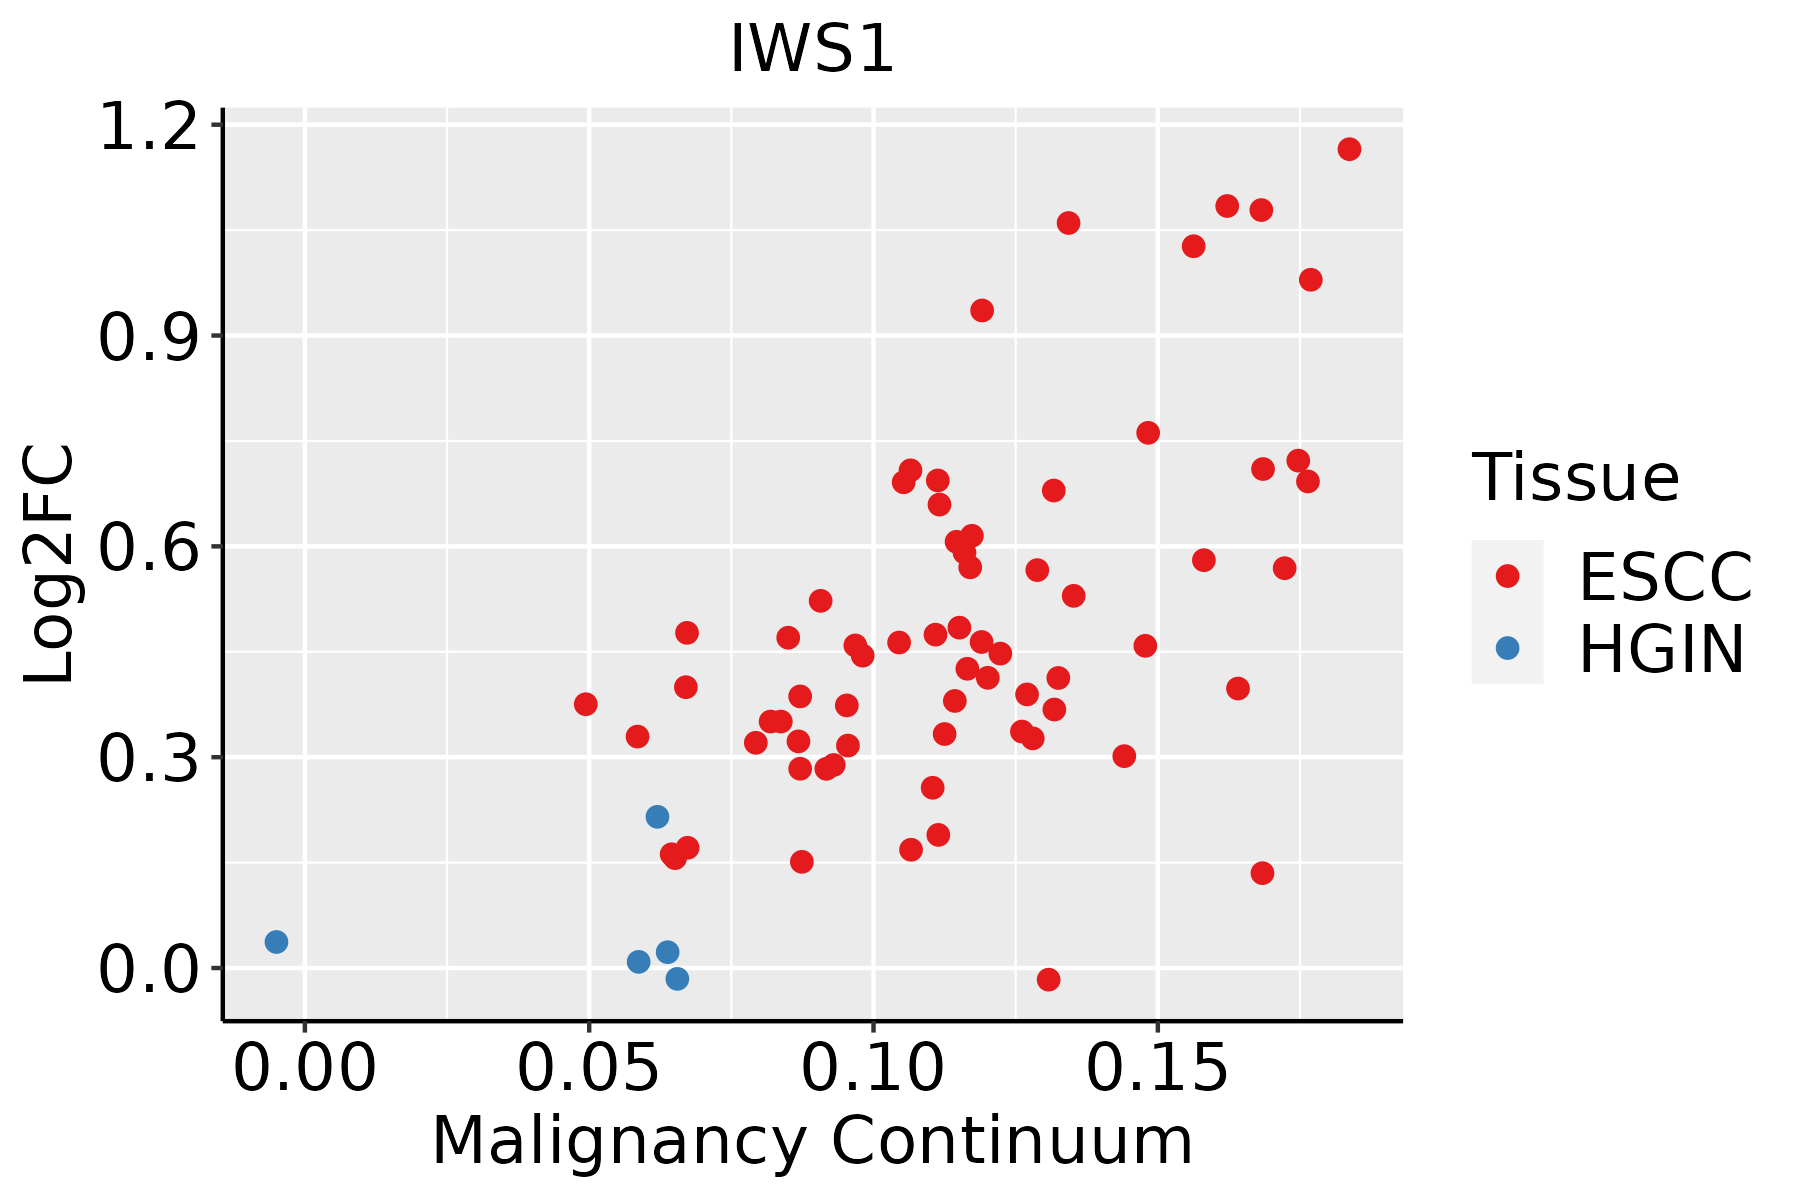 | ESCC: Esophageal squamous cell carcinoma |
| HGIN: High-grade intraepithelial neoplasias |
| LGIN: Low-grade intraepithelial neoplasias |
| Liver | 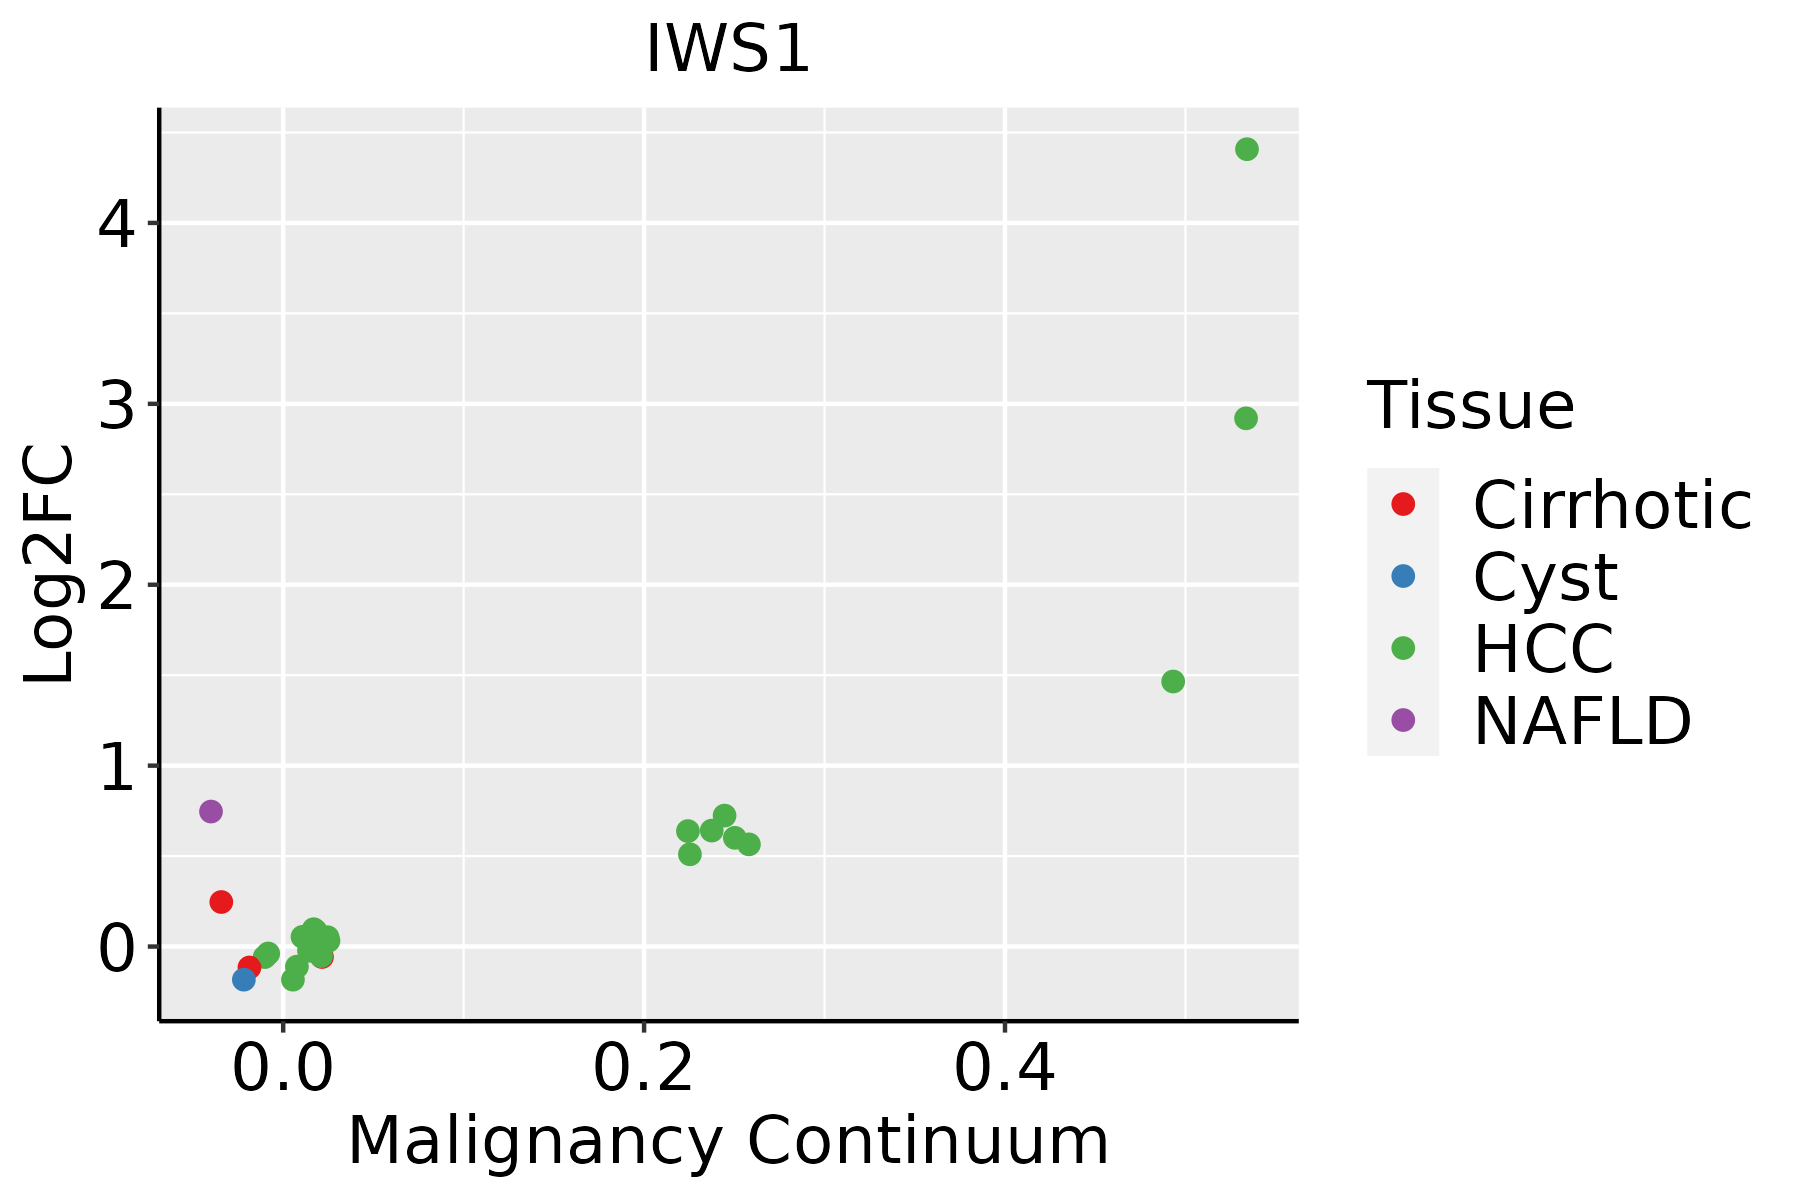 | HCC: Hepatocellular carcinoma |
| NAFLD: Non-alcoholic fatty liver disease |
| Oral Cavity | 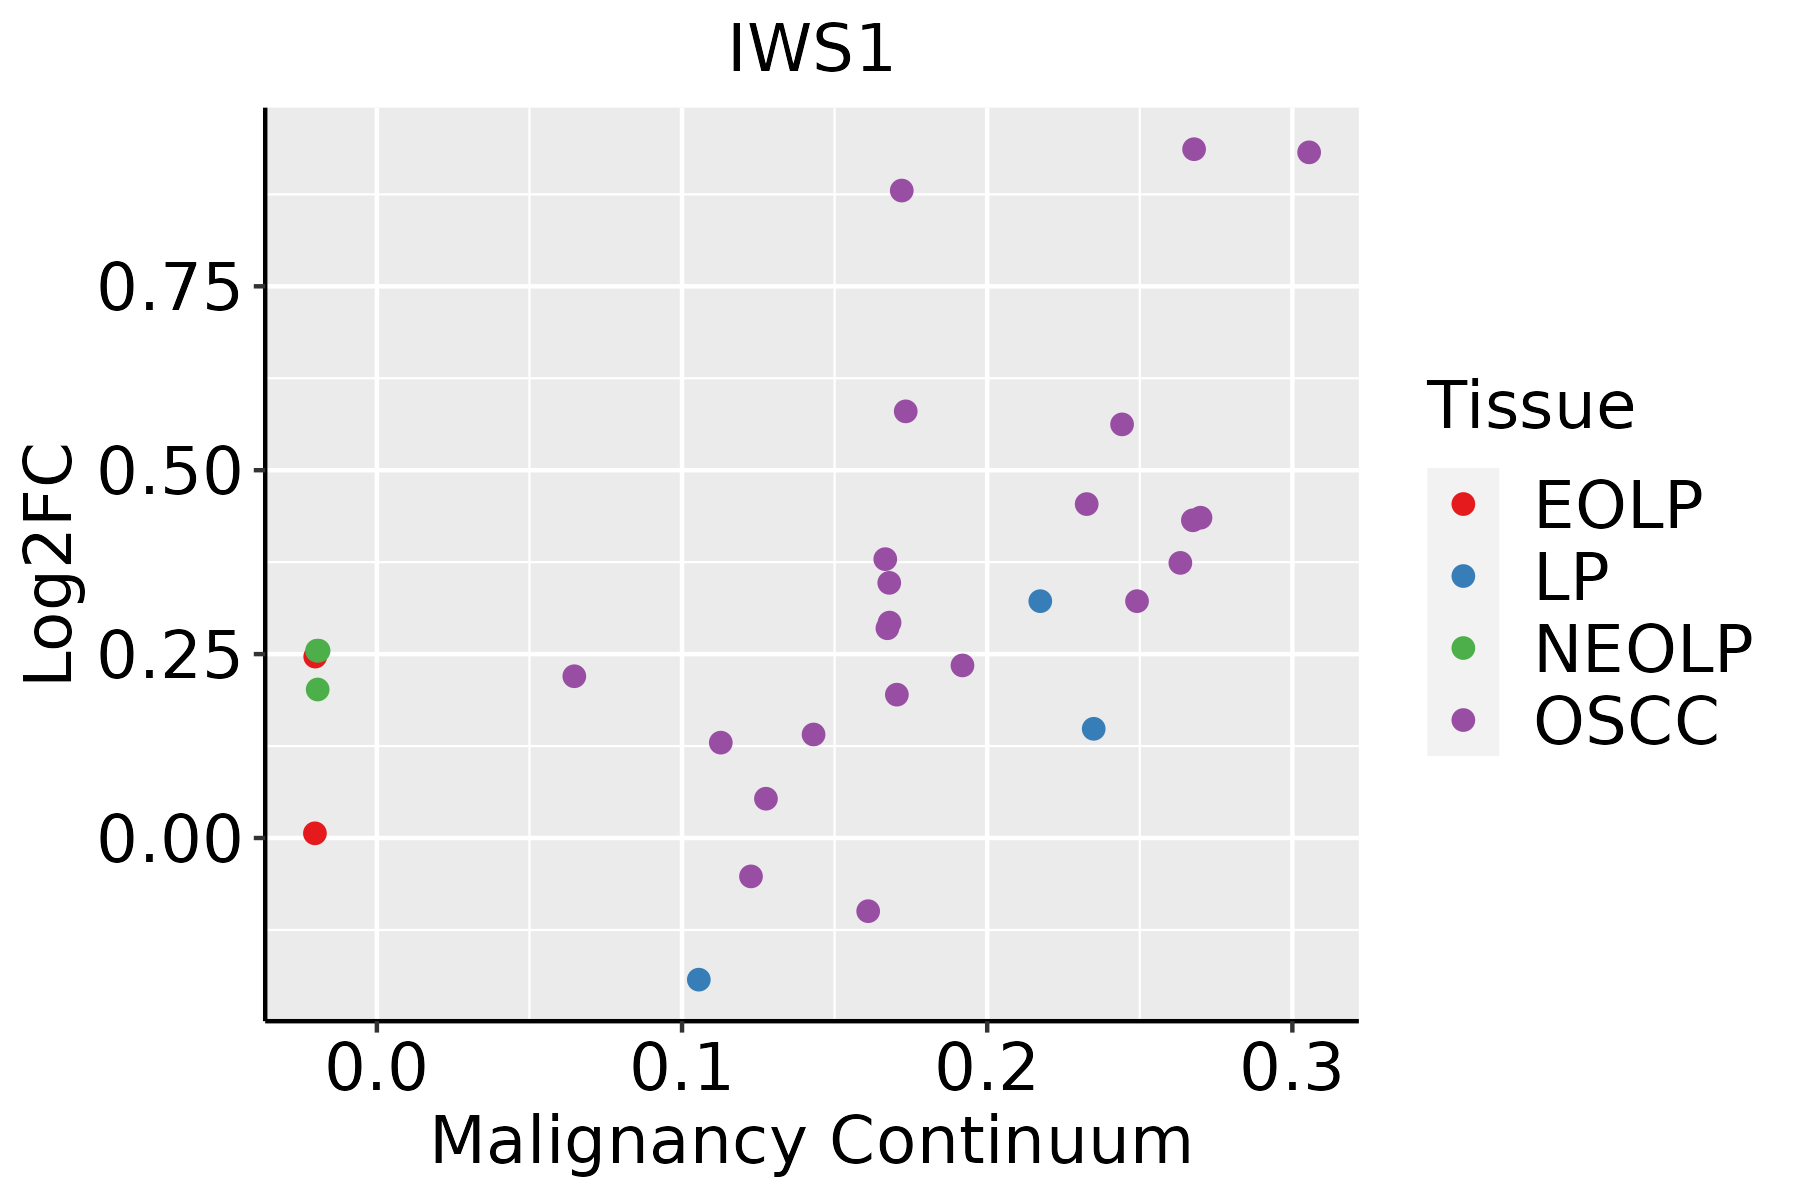 | EOLP: Erosive Oral lichen planus |
| LP: leukoplakia |
| NEOLP: Non-erosive oral lichen planus |
| OSCC: Oral squamous cell carcinoma |
| Skin | 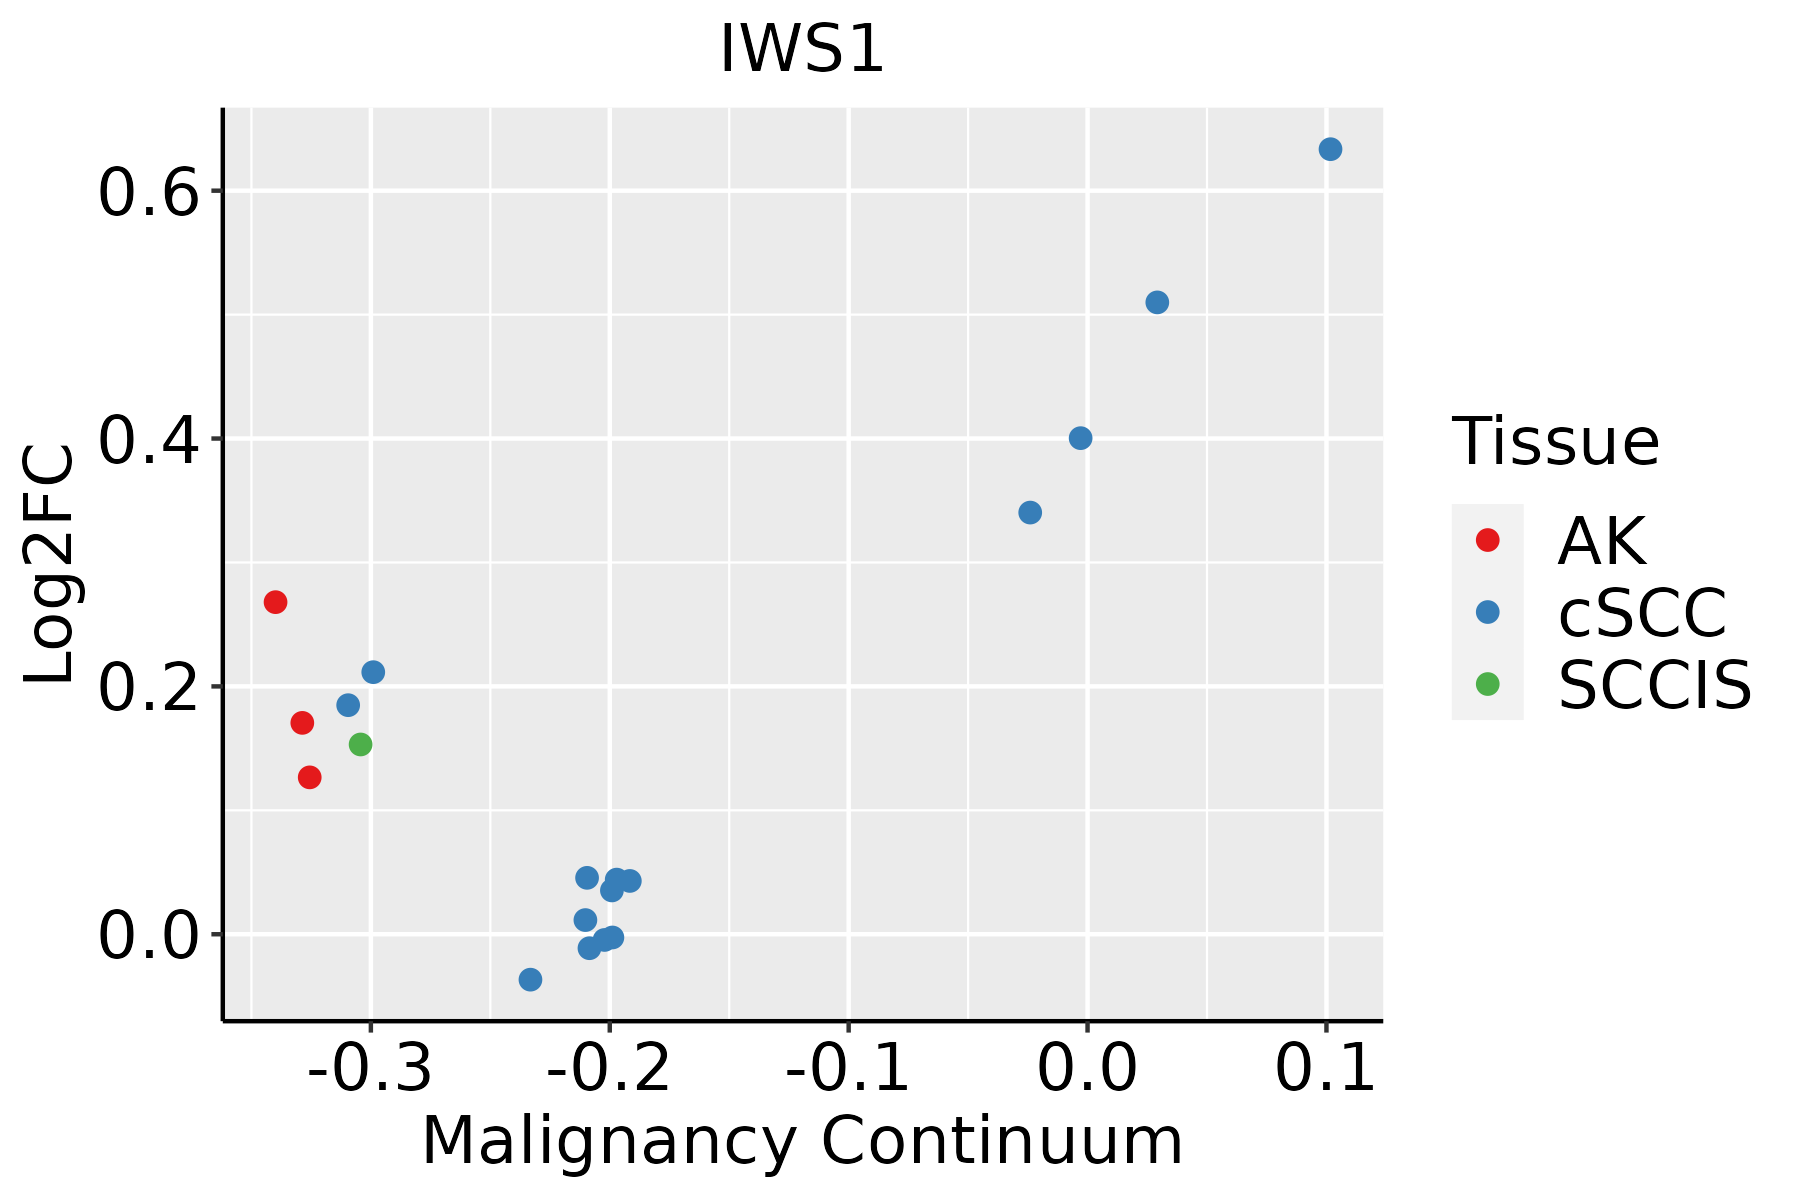 | AK: Actinic keratosis |
| cSCC: Cutaneous squamous cell carcinoma |
| SCCIS:squamous cell carcinoma in situ |
| Thyroid |  | ATC: Anaplastic thyroid cancer |
| HT: Hashimoto's thyroiditis |
| PTC: Papillary thyroid cancer |
| GO ID | Tissue | Disease Stage | Description | Gene Ratio | Bg Ratio | pvalue | p.adjust | Count |
| GO:190331111 | Liver | Cirrhotic | regulation of mRNA metabolic process | 140/4634 | 288/18723 | 1.07e-18 | 1.91e-16 | 140 |
| GO:005068411 | Liver | Cirrhotic | regulation of mRNA processing | 81/4634 | 137/18723 | 1.05e-17 | 1.60e-15 | 81 |
| GO:003238611 | Liver | Cirrhotic | regulation of intracellular transport | 147/4634 | 337/18723 | 1.84e-14 | 1.72e-12 | 147 |
| GO:000640312 | Liver | Cirrhotic | RNA localization | 94/4634 | 201/18723 | 8.57e-12 | 5.66e-10 | 94 |
| GO:000691312 | Liver | Cirrhotic | nucleocytoplasmic transport | 118/4634 | 301/18723 | 1.71e-08 | 6.27e-07 | 118 |
| GO:005116912 | Liver | Cirrhotic | nuclear transport | 118/4634 | 301/18723 | 1.71e-08 | 6.27e-07 | 118 |
| GO:00064731 | Liver | Cirrhotic | protein acetylation | 84/4634 | 201/18723 | 7.50e-08 | 2.25e-06 | 84 |
| GO:00183941 | Liver | Cirrhotic | peptidyl-lysine acetylation | 73/4634 | 169/18723 | 1.08e-07 | 3.07e-06 | 73 |
| GO:004682211 | Liver | Cirrhotic | regulation of nucleocytoplasmic transport | 51/4634 | 106/18723 | 1.54e-07 | 4.12e-06 | 51 |
| GO:005123611 | Liver | Cirrhotic | establishment of RNA localization | 71/4634 | 166/18723 | 2.56e-07 | 6.41e-06 | 71 |
| GO:005116812 | Liver | Cirrhotic | nuclear export | 67/4634 | 154/18723 | 2.57e-07 | 6.41e-06 | 67 |
| GO:00435431 | Liver | Cirrhotic | protein acylation | 95/4634 | 243/18723 | 4.73e-07 | 1.07e-05 | 95 |
| GO:00506576 | Liver | Cirrhotic | nucleic acid transport | 69/4634 | 163/18723 | 5.97e-07 | 1.30e-05 | 69 |
| GO:00506586 | Liver | Cirrhotic | RNA transport | 69/4634 | 163/18723 | 5.97e-07 | 1.30e-05 | 69 |
| GO:00159316 | Liver | Cirrhotic | nucleobase-containing compound transport | 87/4634 | 222/18723 | 1.25e-06 | 2.52e-05 | 87 |
| GO:00182051 | Liver | Cirrhotic | peptidyl-lysine modification | 134/4634 | 376/18723 | 1.29e-06 | 2.59e-05 | 134 |
| GO:00510282 | Liver | Cirrhotic | mRNA transport | 56/4634 | 130/18723 | 3.47e-06 | 5.97e-05 | 56 |
| GO:00064751 | Liver | Cirrhotic | internal protein amino acid acetylation | 65/4634 | 160/18723 | 6.66e-06 | 1.04e-04 | 65 |
| GO:00183931 | Liver | Cirrhotic | internal peptidyl-lysine acetylation | 64/4634 | 158/18723 | 8.75e-06 | 1.29e-04 | 64 |
| GO:001657011 | Liver | Cirrhotic | histone modification | 154/4634 | 463/18723 | 1.92e-05 | 2.57e-04 | 154 |
| Hugo Symbol | Variant Class | Variant Classification | dbSNP RS | HGVSc | HGVSp | HGVSp Short | SWISSPROT | BIOTYPE | SIFT | PolyPhen | Tumor Sample Barcode | Tissue | Histology | Sex | Age | Stage | Therapy Types | Drugs | Outcome |
| IWS1 | SNV | Missense_Mutation | | c.1447G>A | p.Glu483Lys | p.E483K | Q96ST2 | protein_coding | deleterious(0) | probably_damaging(0.989) | TCGA-E2-A14P-01 | Breast | breast invasive carcinoma | Female | >=65 | III/IV | Targeted Molecular therapy | trastuzumab | SD |
| IWS1 | insertion | In_Frame_Ins | novel | c.1954_1955insATATACTTTCTTTCATGGTCATTGTAGCAGCTA | p.Leu652delinsHisIleLeuSerPheMetValIleValAlaAlaMet | p.L652delinsHILSFMVIVAAM | Q96ST2 | protein_coding | | | TCGA-AR-A0TY-01 | Breast | breast invasive carcinoma | Female | <65 | I/II | Unspecific | Paclitaxel | PD |
| IWS1 | SNV | Missense_Mutation | | c.1900C>T | p.Arg634Trp | p.R634W | Q96ST2 | protein_coding | deleterious(0) | probably_damaging(1) | TCGA-2W-A8YY-01 | Cervix | cervical & endocervical cancer | Female | <65 | I/II | Chemotherapy | cisplatin | CR |
| IWS1 | SNV | Missense_Mutation | | c.1189N>T | p.Leu397Phe | p.L397F | Q96ST2 | protein_coding | deleterious(0.04) | probably_damaging(0.998) | TCGA-C5-A1MH-01 | Cervix | cervical & endocervical cancer | Female | >=65 | III/IV | Chemotherapy | cisplatin | PD |
| IWS1 | SNV | Missense_Mutation | novel | c.2072G>A | p.Gly691Asp | p.G691D | Q96ST2 | protein_coding | deleterious(0.02) | probably_damaging(0.972) | TCGA-DS-A1OB-01 | Cervix | cervical & endocervical cancer | Female | <65 | I/II | Chemotherapy | carboplatin | PD |
| IWS1 | SNV | Missense_Mutation | rs768095036 | c.247N>A | p.Glu83Lys | p.E83K | Q96ST2 | protein_coding | tolerated_low_confidence(0.11) | possibly_damaging(0.664) | TCGA-EA-A3QD-01 | Cervix | cervical & endocervical cancer | Female | <65 | III/IV | Chemotherapy | cisplatin | CR |
| IWS1 | SNV | Missense_Mutation | | c.2389G>A | p.Asp797Asn | p.D797N | Q96ST2 | protein_coding | deleterious(0.03) | benign(0.101) | TCGA-EK-A2PG-01 | Cervix | cervical & endocervical cancer | Female | >=65 | I/II | Unknown | Unknown | SD |
| IWS1 | SNV | Missense_Mutation | | c.476N>A | p.Ser159Tyr | p.S159Y | Q96ST2 | protein_coding | deleterious_low_confidence(0) | probably_damaging(0.98) | TCGA-FU-A3HZ-01 | Cervix | cervical & endocervical cancer | Female | <65 | I/II | Chemotherapy | cisplatin | CR |
| IWS1 | insertion | Frame_Shift_Ins | novel | c.2069_2070insCCTAA | p.Gly691LeufsTer11 | p.G691Lfs*11 | Q96ST2 | protein_coding | | | TCGA-DS-A1OB-01 | Cervix | cervical & endocervical cancer | Female | <65 | I/II | Chemotherapy | carboplatin | PD |
| IWS1 | SNV | Missense_Mutation | | c.1691N>A | p.Ile564Asn | p.I564N | Q96ST2 | protein_coding | deleterious(0) | probably_damaging(0.929) | TCGA-CK-4951-01 | Colorectum | colon adenocarcinoma | Female | >=65 | I/II | Unknown | Unknown | PD |


