
|
|||||
|
 | |
| |
| |
| |
| |
| |
|
Gene: IVNS1ABP |
Gene summary for IVNS1ABP |
| Gene information | Species | Human | Gene symbol | IVNS1ABP | Gene ID | 10625 |
| Gene name | influenza virus NS1A binding protein | |
| Gene Alias | ARA3 | |
| Cytomap | 1q25.3 | |
| Gene Type | protein-coding | GO ID | GO:0006139 | UniProtAcc | Q9Y6Y0 |
Top |
Malignant transformation analysis |
| Identification of the aberrant gene expression in precancerous and cancerous lesions by comparing the gene expression of stem-like cells in diseased tissues with normal stem cells |
| Entrez ID | Symbol | Replicates | Species | Organ | Tissue | Adj P-value | Log2FC | Malignancy |
| 10625 | IVNS1ABP | LZE4T | Human | Esophagus | ESCC | 2.73e-07 | 5.15e-01 | 0.0811 |
| 10625 | IVNS1ABP | LZE5T | Human | Esophagus | ESCC | 4.37e-02 | -1.96e-01 | 0.0514 |
| 10625 | IVNS1ABP | LZE7T | Human | Esophagus | ESCC | 7.73e-13 | 1.76e+00 | 0.0667 |
| 10625 | IVNS1ABP | LZE8T | Human | Esophagus | ESCC | 3.95e-06 | 1.18e-01 | 0.067 |
| 10625 | IVNS1ABP | LZE24T | Human | Esophagus | ESCC | 3.45e-07 | 6.14e-01 | 0.0596 |
| 10625 | IVNS1ABP | P1T-E | Human | Esophagus | ESCC | 3.86e-07 | 7.02e-01 | 0.0875 |
| 10625 | IVNS1ABP | P2T-E | Human | Esophagus | ESCC | 4.82e-14 | 3.87e-01 | 0.1177 |
| 10625 | IVNS1ABP | P4T-E | Human | Esophagus | ESCC | 7.71e-07 | 3.51e-01 | 0.1323 |
| 10625 | IVNS1ABP | P5T-E | Human | Esophagus | ESCC | 1.30e-05 | 2.92e-01 | 0.1327 |
| 10625 | IVNS1ABP | P8T-E | Human | Esophagus | ESCC | 3.99e-09 | 2.47e-01 | 0.0889 |
| 10625 | IVNS1ABP | P9T-E | Human | Esophagus | ESCC | 6.83e-14 | 6.51e-01 | 0.1131 |
| 10625 | IVNS1ABP | P10T-E | Human | Esophagus | ESCC | 3.67e-19 | 5.01e-01 | 0.116 |
| 10625 | IVNS1ABP | P11T-E | Human | Esophagus | ESCC | 2.02e-13 | 2.22e+00 | 0.1426 |
| 10625 | IVNS1ABP | P12T-E | Human | Esophagus | ESCC | 1.92e-21 | 8.00e-01 | 0.1122 |
| 10625 | IVNS1ABP | P15T-E | Human | Esophagus | ESCC | 3.69e-32 | 1.08e+00 | 0.1149 |
| 10625 | IVNS1ABP | P16T-E | Human | Esophagus | ESCC | 2.61e-22 | 7.56e-01 | 0.1153 |
| 10625 | IVNS1ABP | P20T-E | Human | Esophagus | ESCC | 1.49e-14 | 6.74e-01 | 0.1124 |
| 10625 | IVNS1ABP | P21T-E | Human | Esophagus | ESCC | 6.73e-21 | 7.39e-01 | 0.1617 |
| 10625 | IVNS1ABP | P22T-E | Human | Esophagus | ESCC | 5.59e-10 | 6.44e-02 | 0.1236 |
| 10625 | IVNS1ABP | P23T-E | Human | Esophagus | ESCC | 2.92e-20 | 6.34e-01 | 0.108 |
| Page: 1 2 3 4 5 6 |
| Tissue | Expression Dynamics | Abbreviation |
| Esophagus | 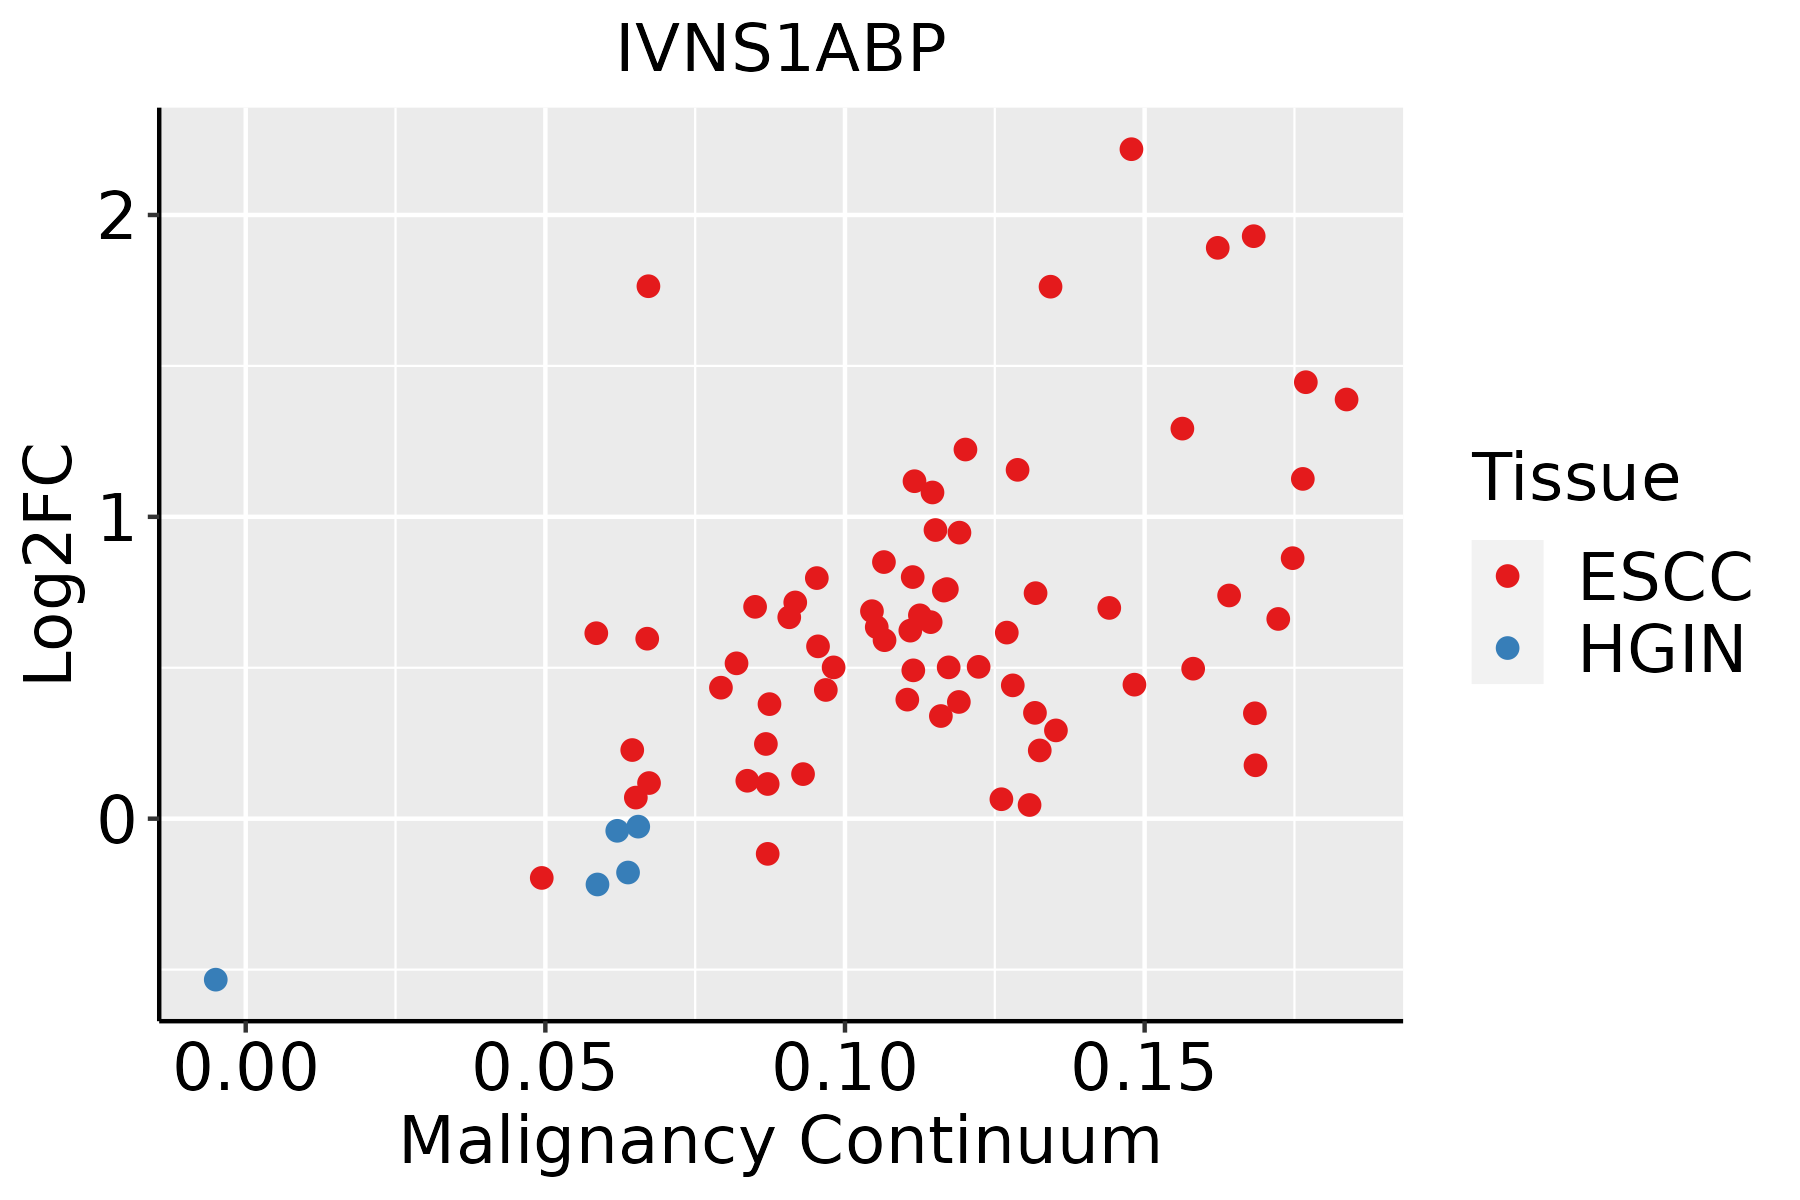 | ESCC: Esophageal squamous cell carcinoma |
| HGIN: High-grade intraepithelial neoplasias | ||
| LGIN: Low-grade intraepithelial neoplasias | ||
| Liver |  | HCC: Hepatocellular carcinoma |
| NAFLD: Non-alcoholic fatty liver disease | ||
| Lung | 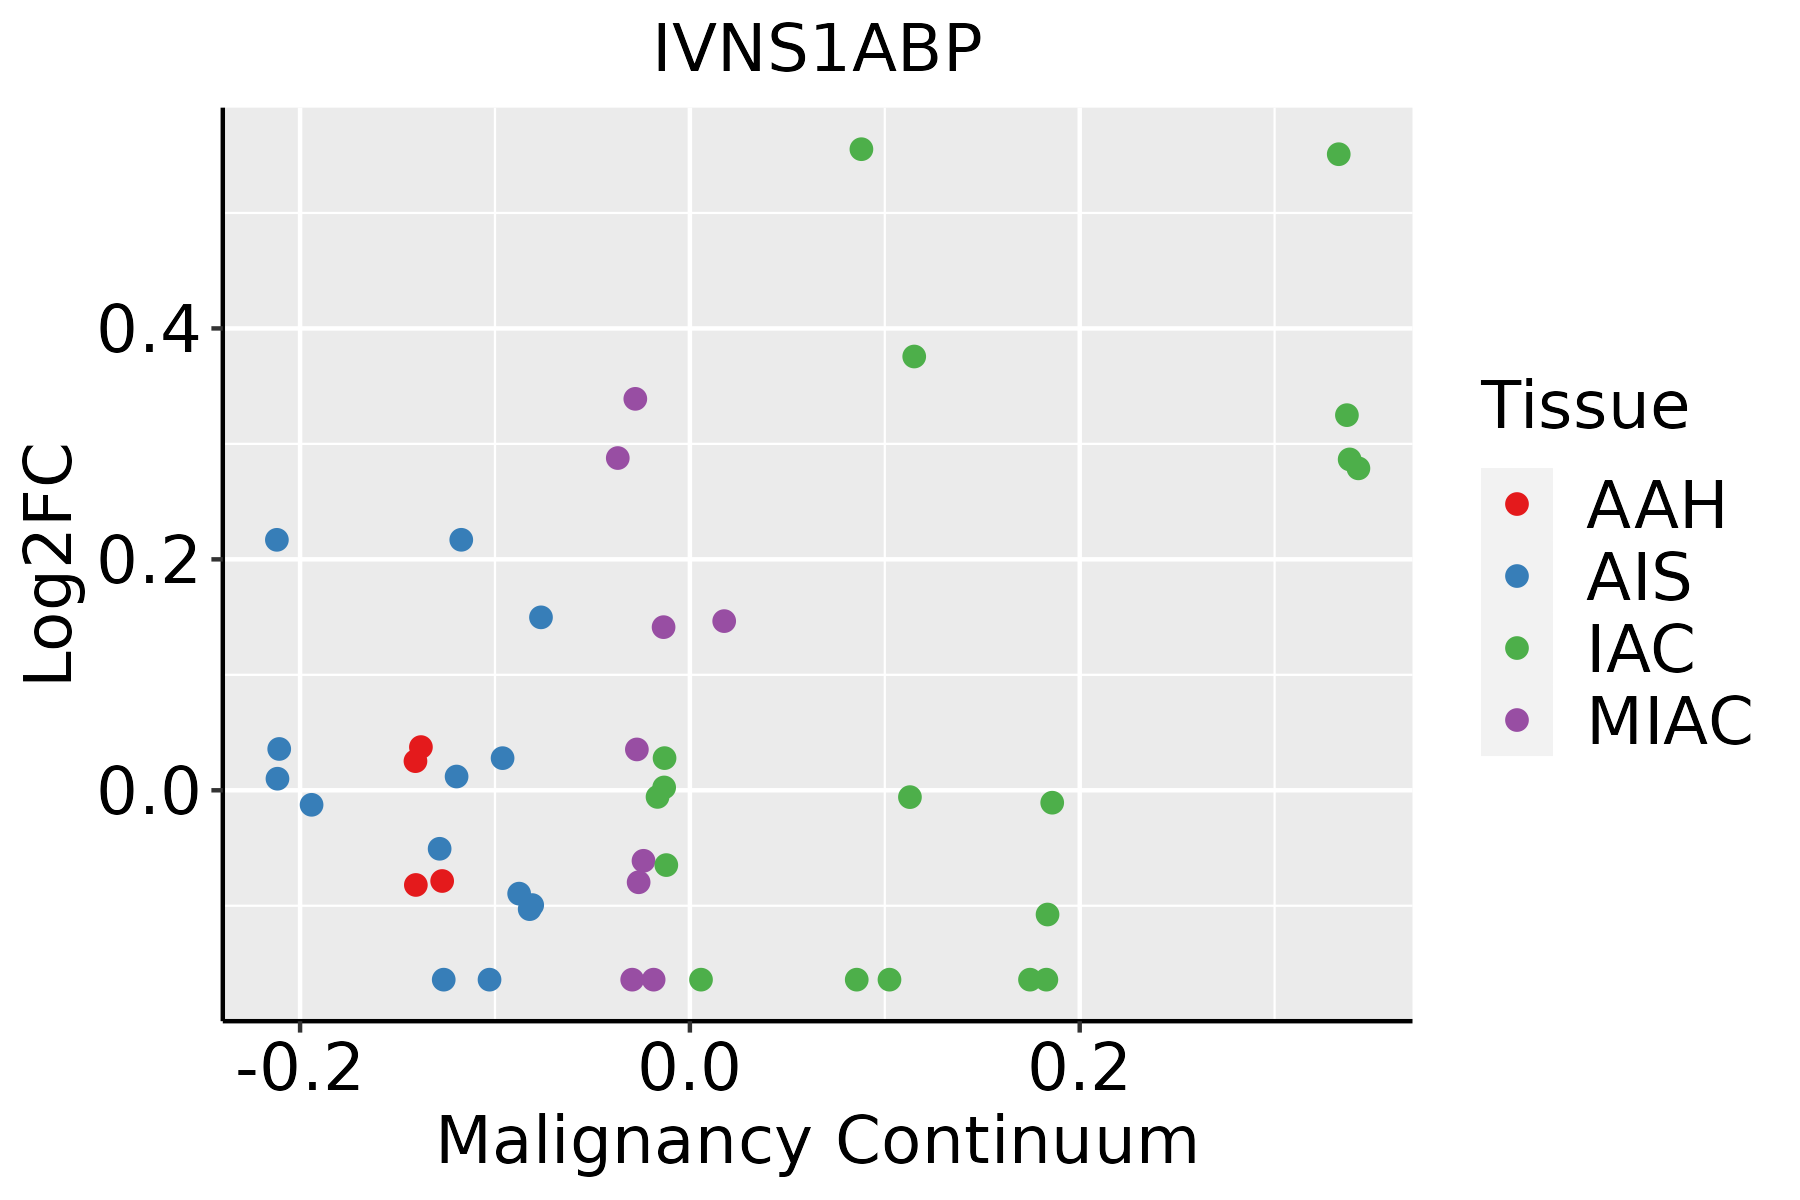 | AAH: Atypical adenomatous hyperplasia |
| AIS: Adenocarcinoma in situ | ||
| IAC: Invasive lung adenocarcinoma | ||
| MIA: Minimally invasive adenocarcinoma | ||
| Oral Cavity | 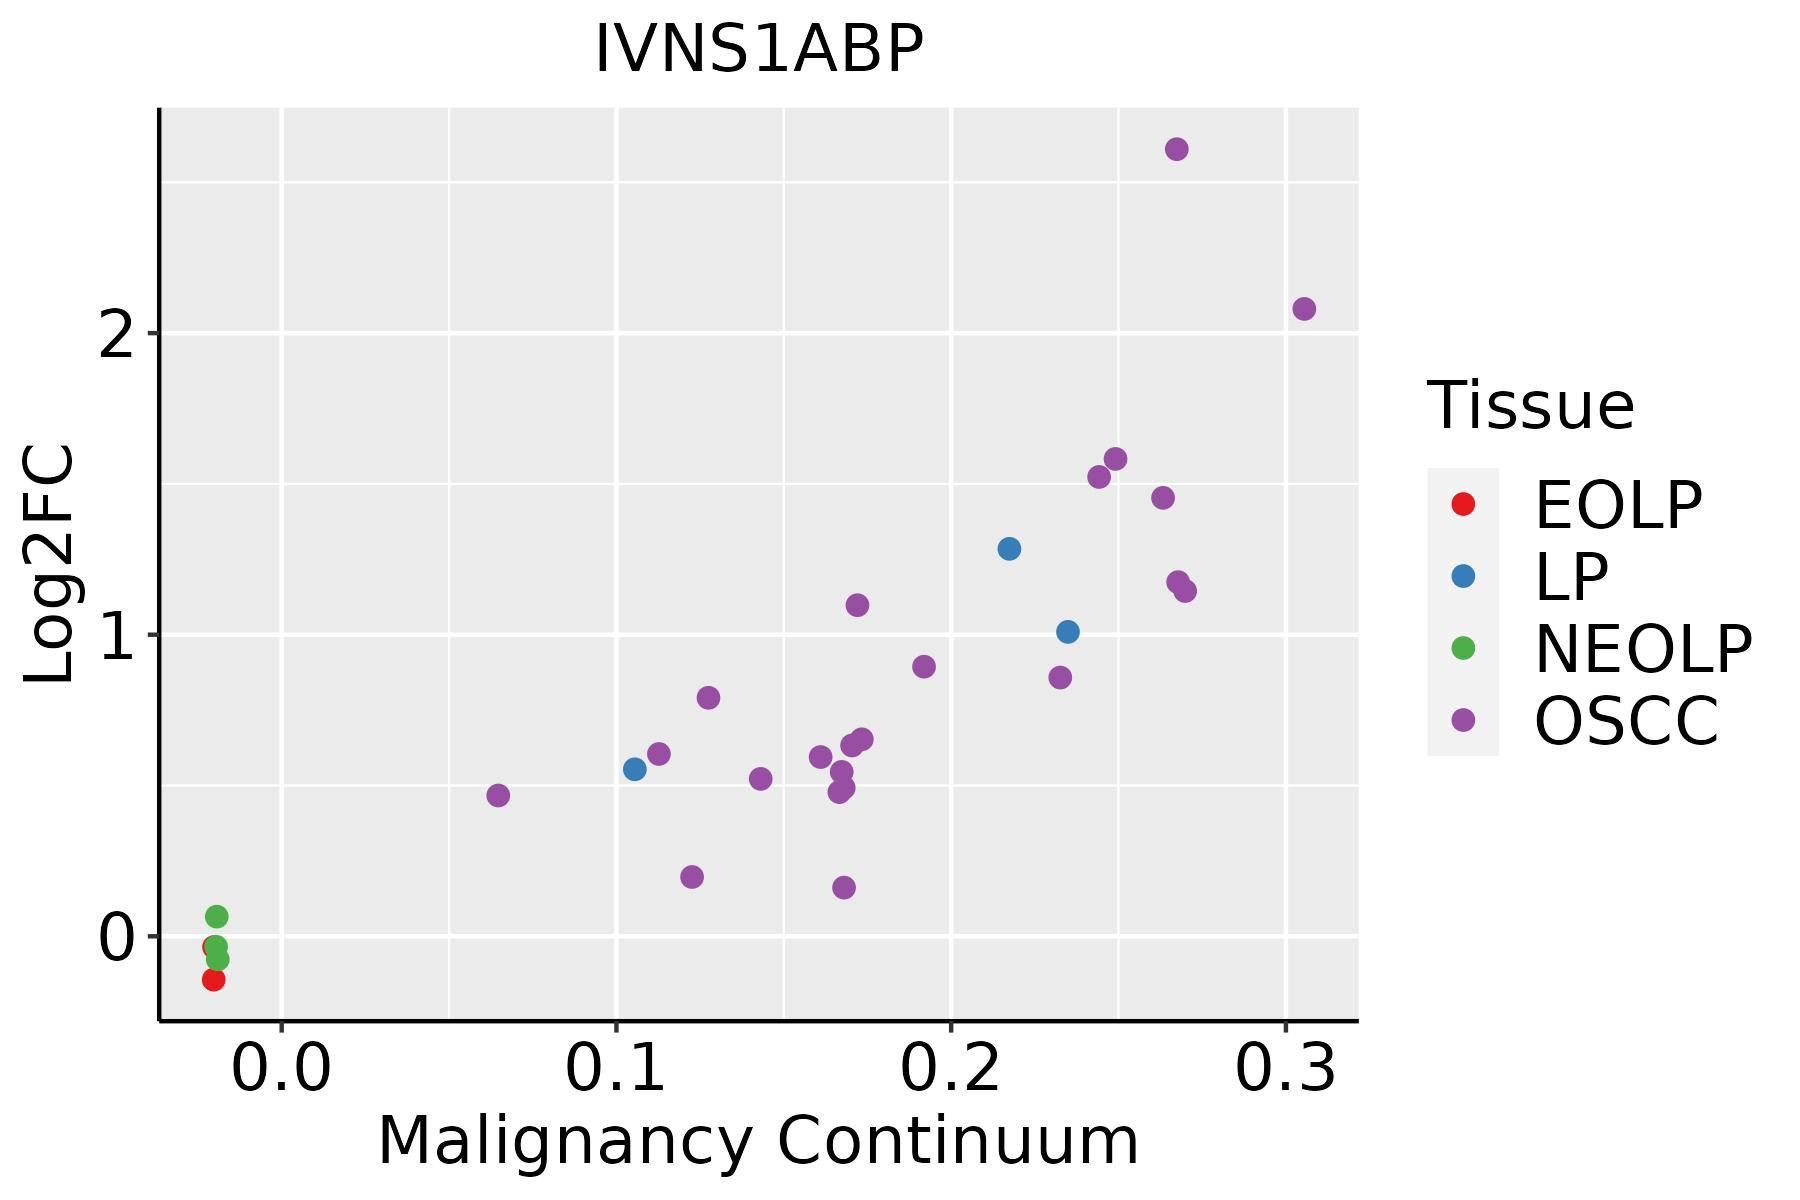 | EOLP: Erosive Oral lichen planus |
| LP: leukoplakia | ||
| NEOLP: Non-erosive oral lichen planus | ||
| OSCC: Oral squamous cell carcinoma | ||
| Prostate | 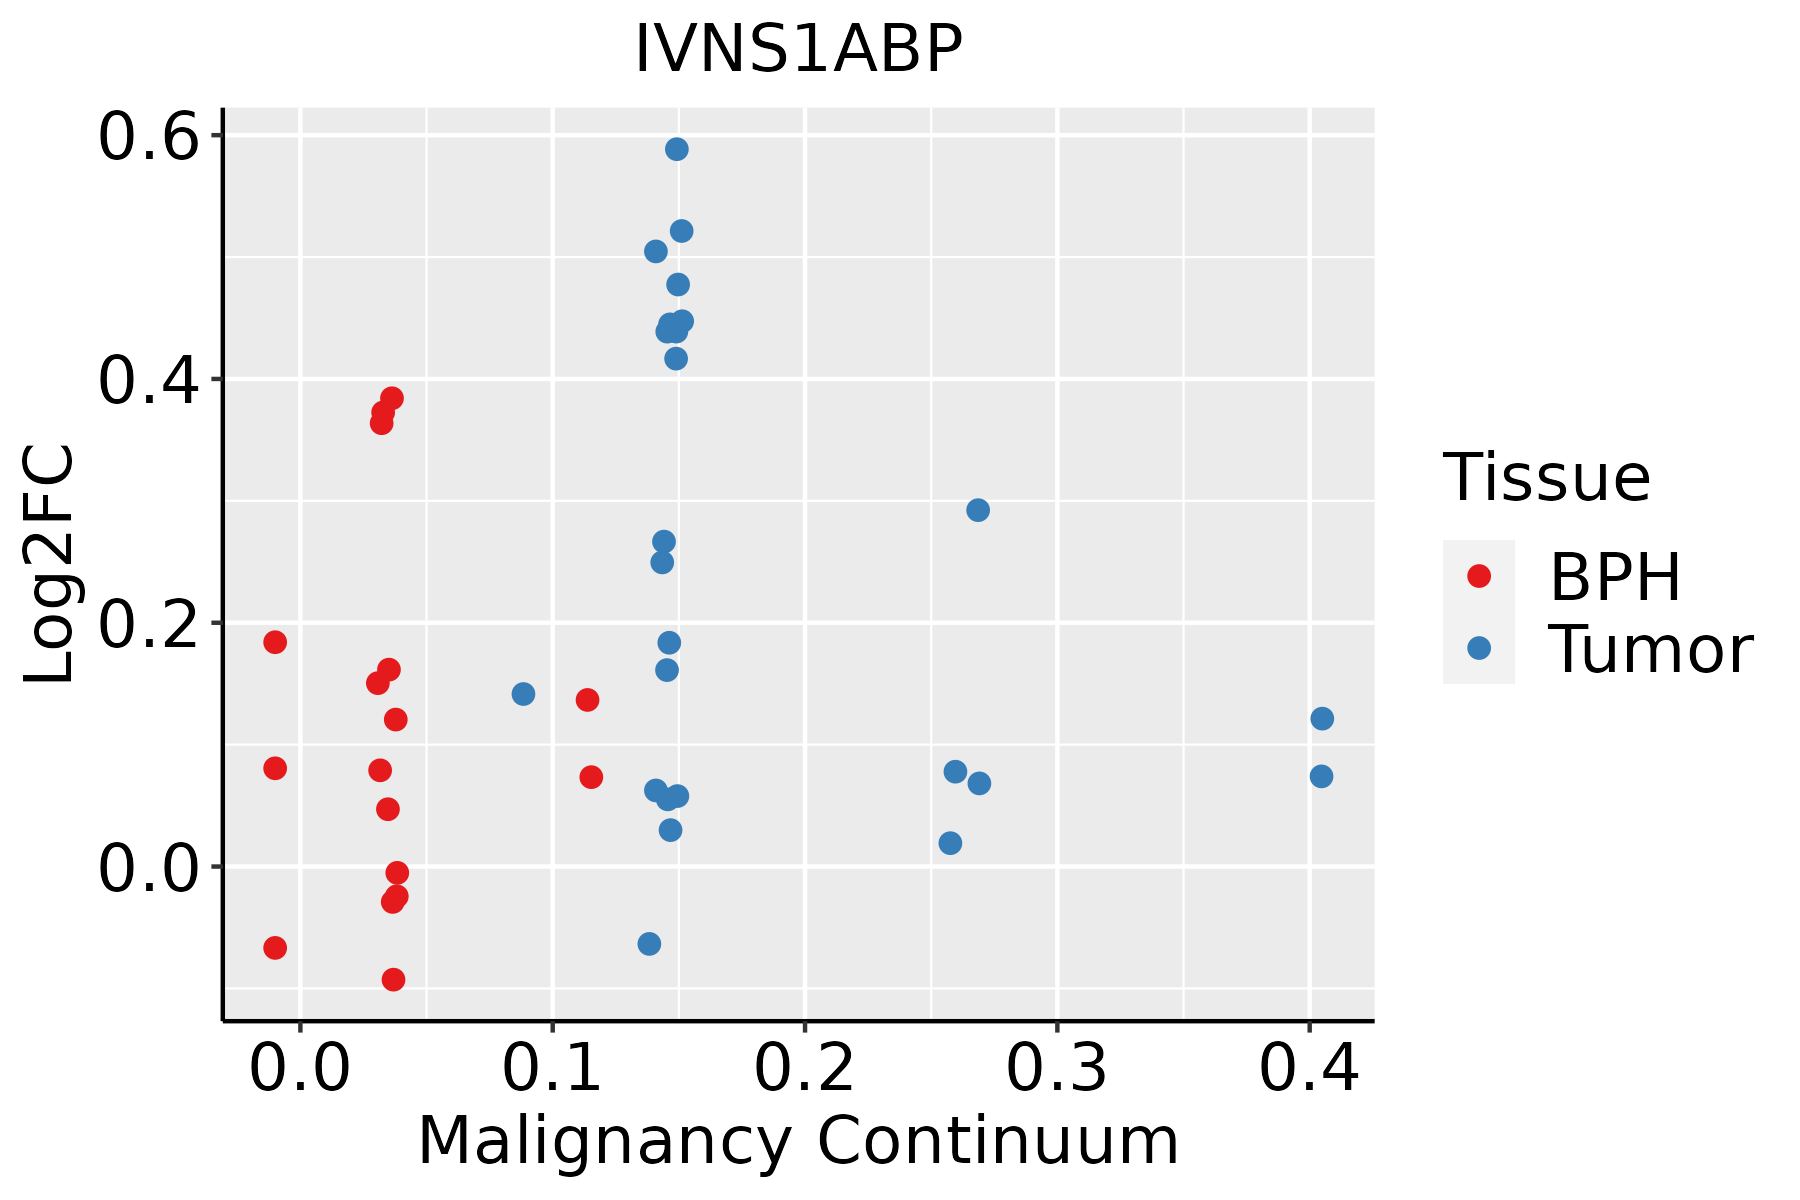 | BPH: Benign Prostatic Hyperplasia |
| Skin | 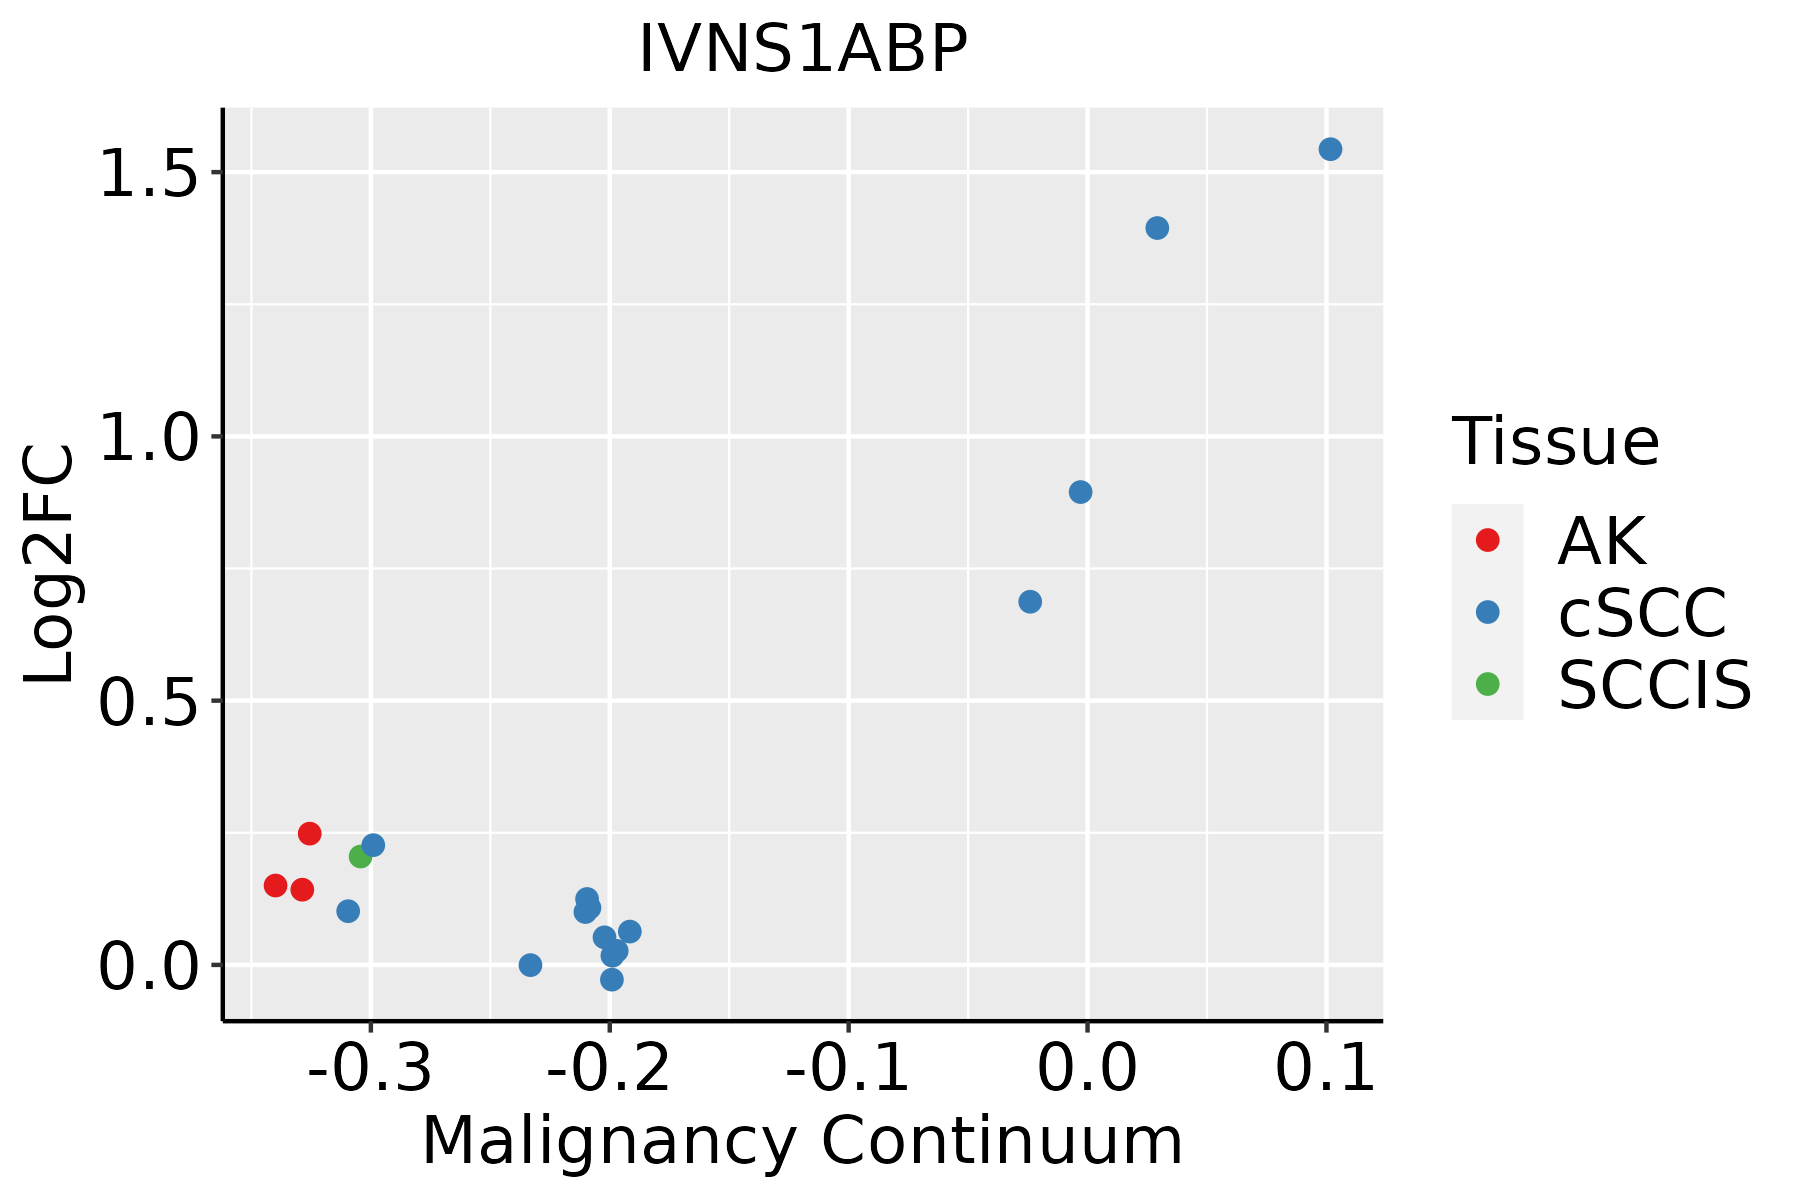 | AK: Actinic keratosis |
| cSCC: Cutaneous squamous cell carcinoma | ||
| SCCIS:squamous cell carcinoma in situ |
| ∗log2FC in expression of this searched gene in stem-like cells from each diseased tissue sample relative to stem-like cells in normal samples in each tissue plotted against the malignancy continuum. Samples are colored based on if they are from different disease stage. |
Top |
Malignant transformation related pathway analysis |
| Find out the enriched GO biological processes and KEGG pathways involved in transition from healthy to precancer to cancer |
| Tissue | Disease Stage | Enriched GO biological Processes |
| Colorectum | AD |  |
| Colorectum | SER |  |
| Colorectum | MSS |  |
| Colorectum | MSI-H |  |
| Colorectum | FAP |  |
| ∗Top 15 enriched GO BP terms are showed in the bar plot of each disease state in each tissue. Each row represents a significant GO biological process which is colored according to the -log10(p.adjust). |
| Page: 1 2 3 4 5 6 7 8 9 |
| GO ID | Tissue | Disease Stage | Description | Gene Ratio | Bg Ratio | pvalue | p.adjust | Count |
| GO:190332128 | Skin | AK | negative regulation of protein modification by small protein conjugation or removal | 32/1910 | 95/18723 | 4.71e-10 | 5.26e-08 | 32 |
| GO:200124326 | Skin | AK | negative regulation of intrinsic apoptotic signaling pathway | 31/1910 | 98/18723 | 4.97e-09 | 3.63e-07 | 31 |
| GO:000961519 | Skin | AK | response to virus | 63/1910 | 367/18723 | 2.53e-05 | 4.54e-04 | 63 |
| GO:0008380112 | Skin | cSCC | RNA splicing | 263/4864 | 434/18723 | 2.45e-53 | 5.13e-50 | 263 |
| GO:009719329 | Skin | cSCC | intrinsic apoptotic signaling pathway | 150/4864 | 288/18723 | 1.76e-21 | 3.34e-19 | 150 |
| GO:200123329 | Skin | cSCC | regulation of apoptotic signaling pathway | 173/4864 | 356/18723 | 2.25e-20 | 3.44e-18 | 173 |
| GO:200124229 | Skin | cSCC | regulation of intrinsic apoptotic signaling pathway | 96/4864 | 164/18723 | 9.88e-19 | 1.32e-16 | 96 |
| GO:190332029 | Skin | cSCC | regulation of protein modification by small protein conjugation or removal | 125/4864 | 242/18723 | 9.50e-18 | 1.05e-15 | 125 |
| GO:003139629 | Skin | cSCC | regulation of protein ubiquitination | 107/4864 | 210/18723 | 7.17e-15 | 5.35e-13 | 107 |
| GO:000961522 | Skin | cSCC | response to virus | 152/4864 | 367/18723 | 5.88e-11 | 2.75e-09 | 152 |
| GO:200123429 | Skin | cSCC | negative regulation of apoptotic signaling pathway | 101/4864 | 224/18723 | 4.17e-10 | 1.70e-08 | 101 |
| GO:200124327 | Skin | cSCC | negative regulation of intrinsic apoptotic signaling pathway | 53/4864 | 98/18723 | 2.91e-09 | 1.02e-07 | 53 |
| GO:003139729 | Skin | cSCC | negative regulation of protein ubiquitination | 45/4864 | 83/18723 | 4.04e-08 | 1.05e-06 | 45 |
| GO:190332129 | Skin | cSCC | negative regulation of protein modification by small protein conjugation or removal | 49/4864 | 95/18723 | 8.44e-08 | 2.04e-06 | 49 |
| GO:00063834 | Skin | cSCC | transcription by RNA polymerase III | 20/4864 | 46/18723 | 7.44e-03 | 3.50e-02 | 20 |
| Page: 1 2 3 4 5 6 |
| Pathway ID | Tissue | Disease Stage | Description | Gene Ratio | Bg Ratio | pvalue | p.adjust | qvalue | Count |
| Page: 1 |
Top |
Cell-cell communication analysis |
| Identification of potential cell-cell interactions between two cell types and their ligand-receptor pairs for different disease states |
| Ligand | Receptor | LRpair | Pathway | Tissue | Disease Stage |
| Page: 1 |
Top |
Single-cell gene regulatory network inference analysis |
| Find out the significant the regulons (TFs) and the target genes of each regulon across cell types for different disease states |
| TF | Cell Type | Tissue | Disease Stage | Target Gene | RSS | Regulon Activity |
| ∗The dot plots of a searched regulon are shown for all cell subpopulations in each disease state of each tissue based on the regulon specific score inferred using pySCENIC and by calculating the average expression. |
| Page: 1 |
Top |
Somatic mutation of malignant transformation related genes |
| Annotation of somatic variants for genes involved in malignant transformation |
| Hugo Symbol | Variant Class | Variant Classification | dbSNP RS | HGVSc | HGVSp | HGVSp Short | SWISSPROT | BIOTYPE | SIFT | PolyPhen | Tumor Sample Barcode | Tissue | Histology | Sex | Age | Stage | Therapy Types | Drugs | Outcome |
| IVNS1ABP | SNV | Missense_Mutation | novel | c.1711C>G | p.His571Asp | p.H571D | Q9Y6Y0 | protein_coding | tolerated(0.07) | possibly_damaging(0.872) | TCGA-AC-A3W6-01 | Breast | breast invasive carcinoma | Female | >=65 | III/IV | Unknown | Unknown | SD |
| IVNS1ABP | SNV | Missense_Mutation | c.203N>G | p.His68Arg | p.H68R | Q9Y6Y0 | protein_coding | tolerated(0.43) | benign(0.265) | TCGA-AN-A0AK-01 | Breast | breast invasive carcinoma | Female | >=65 | I/II | Unknown | Unknown | SD | |
| IVNS1ABP | SNV | Missense_Mutation | c.888G>C | p.Lys296Asn | p.K296N | Q9Y6Y0 | protein_coding | tolerated(0.09) | probably_damaging(0.915) | TCGA-AR-A24H-01 | Breast | breast invasive carcinoma | Female | >=65 | I/II | Hormone Therapy | tamoxiphen | SD | |
| IVNS1ABP | SNV | Missense_Mutation | c.523N>T | p.Arg175Trp | p.R175W | Q9Y6Y0 | protein_coding | tolerated(0.19) | probably_damaging(1) | TCGA-AR-A251-01 | Breast | breast invasive carcinoma | Female | <65 | III/IV | Chemotherapy | doxorubicin | SD | |
| IVNS1ABP | insertion | In_Frame_Ins | novel | c.931_932insCTTTTTCTCATTGTGCAGATT | p.Ile311delinsThrPheSerHisCysAlaAspLeu | p.I311delinsTFSHCADL | Q9Y6Y0 | protein_coding | TCGA-A2-A0EO-01 | Breast | breast invasive carcinoma | Female | <65 | I/II | Hormone Therapy | tamoxiphen | SD | ||
| IVNS1ABP | insertion | Nonsense_Mutation | novel | c.929_930insCATCCTTAAAAAGTTTTAA | p.Phe312LeufsTer5 | p.F312Lfs*5 | Q9Y6Y0 | protein_coding | TCGA-A2-A0EO-01 | Breast | breast invasive carcinoma | Female | <65 | I/II | Hormone Therapy | tamoxiphen | SD | ||
| IVNS1ABP | SNV | Missense_Mutation | novel | c.142G>T | p.Ala48Ser | p.A48S | Q9Y6Y0 | protein_coding | deleterious(0.03) | probably_damaging(0.998) | TCGA-2W-A8YY-01 | Cervix | cervical & endocervical cancer | Female | <65 | I/II | Chemotherapy | cisplatin | CR |
| IVNS1ABP | SNV | Missense_Mutation | novel | c.1309G>A | p.Asp437Asn | p.D437N | Q9Y6Y0 | protein_coding | tolerated(0.32) | benign(0.013) | TCGA-VS-A958-01 | Cervix | cervical & endocervical cancer | Female | <65 | I/II | Chemotherapy | cisplatin | CR |
| IVNS1ABP | SNV | Missense_Mutation | novel | c.1696N>A | p.Gly566Ser | p.G566S | Q9Y6Y0 | protein_coding | deleterious(0) | probably_damaging(1) | TCGA-VS-A9UI-01 | Cervix | cervical & endocervical cancer | Female | >=65 | I/II | Unknown | Unknown | SD |
| IVNS1ABP | SNV | Missense_Mutation | novel | c.1912N>C | p.Lys638Gln | p.K638Q | Q9Y6Y0 | protein_coding | tolerated_low_confidence(0.18) | benign(0.001) | TCGA-AA-3984-01 | Colorectum | colon adenocarcinoma | Female | <65 | I/II | Unknown | Unknown | SD |
| Page: 1 2 3 4 5 6 7 8 |
Top |
Related drugs of malignant transformation related genes |
| Identification of chemicals and drugs interact with genes involved in malignant transfromation |
| (DGIdb 4.0) |
| Entrez ID | Symbol | Category | Interaction Types | Drug Claim Name | Drug Name | PMIDs |
| Page: 1 |

Copyright 2023-Present -The University of Texas Health Science Center at Houston |