
|
|||||
|
 | |
| |
| |
| |
| |
| |
|
Gene: ITPR2 |
Gene summary for ITPR2 |
| Gene information | Species | Human | Gene symbol | ITPR2 | Gene ID | 3709 |
| Gene name | inositol 1,4,5-trisphosphate receptor type 2 | |
| Gene Alias | ANHD | |
| Cytomap | 12p11.23 | |
| Gene Type | protein-coding | GO ID | GO:0001666 | UniProtAcc | Q14571 |
Top |
Malignant transformation analysis |
| Identification of the aberrant gene expression in precancerous and cancerous lesions by comparing the gene expression of stem-like cells in diseased tissues with normal stem cells |
| Entrez ID | Symbol | Replicates | Species | Organ | Tissue | Adj P-value | Log2FC | Malignancy |
| 3709 | ITPR2 | HTA11_411_2000001011 | Human | Colorectum | SER | 2.82e-06 | 3.98e-01 | -0.2602 |
| 3709 | ITPR2 | HTA11_99999970781_79442 | Human | Colorectum | MSS | 5.65e-05 | -3.31e-01 | 0.294 |
| 3709 | ITPR2 | HTA11_99999965062_69753 | Human | Colorectum | MSI-H | 2.92e-18 | 1.71e+00 | 0.3487 |
| 3709 | ITPR2 | F007 | Human | Colorectum | FAP | 1.57e-10 | 6.05e-01 | 0.1176 |
| 3709 | ITPR2 | A002-C-010 | Human | Colorectum | FAP | 3.41e-08 | 3.88e-01 | 0.242 |
| 3709 | ITPR2 | A001-C-207 | Human | Colorectum | FAP | 3.85e-26 | 8.53e-01 | 0.1278 |
| 3709 | ITPR2 | A015-C-203 | Human | Colorectum | FAP | 7.90e-29 | 4.30e-01 | -0.1294 |
| 3709 | ITPR2 | A015-C-204 | Human | Colorectum | FAP | 3.59e-06 | 8.95e-02 | -0.0228 |
| 3709 | ITPR2 | A014-C-040 | Human | Colorectum | FAP | 2.48e-06 | 4.87e-01 | -0.1184 |
| 3709 | ITPR2 | A002-C-201 | Human | Colorectum | FAP | 1.32e-12 | 2.38e-01 | 0.0324 |
| 3709 | ITPR2 | A001-C-119 | Human | Colorectum | FAP | 1.25e-66 | 1.26e+00 | -0.1557 |
| 3709 | ITPR2 | A001-C-108 | Human | Colorectum | FAP | 3.32e-46 | 8.59e-01 | -0.0272 |
| 3709 | ITPR2 | A002-C-021 | Human | Colorectum | FAP | 2.95e-20 | 6.60e-01 | 0.1171 |
| 3709 | ITPR2 | A002-C-205 | Human | Colorectum | FAP | 2.93e-39 | 6.92e-01 | -0.1236 |
| 3709 | ITPR2 | A014-C-108 | Human | Colorectum | FAP | 6.68e-03 | 2.97e-01 | -0.124 |
| 3709 | ITPR2 | A001-C-104 | Human | Colorectum | FAP | 1.24e-38 | 8.41e-01 | 0.0184 |
| 3709 | ITPR2 | A015-C-006 | Human | Colorectum | FAP | 2.60e-34 | 7.79e-01 | -0.0994 |
| 3709 | ITPR2 | A015-C-106 | Human | Colorectum | FAP | 2.32e-15 | 3.58e-01 | -0.0511 |
| 3709 | ITPR2 | A002-C-114 | Human | Colorectum | FAP | 2.31e-15 | 1.20e-01 | -0.1561 |
| 3709 | ITPR2 | A015-C-104 | Human | Colorectum | FAP | 5.67e-46 | 7.08e-01 | -0.1899 |
| Page: 1 2 3 4 5 6 7 8 |
| Tissue | Expression Dynamics | Abbreviation |
| Colorectum (GSE201348) |  | FAP: Familial adenomatous polyposis |
| CRC: Colorectal cancer | ||
| Colorectum (HTA11) |  | AD: Adenomas |
| SER: Sessile serrated lesions | ||
| MSI-H: Microsatellite-high colorectal cancer | ||
| MSS: Microsatellite stable colorectal cancer | ||
| Esophagus |  | ESCC: Esophageal squamous cell carcinoma |
| HGIN: High-grade intraepithelial neoplasias | ||
| LGIN: Low-grade intraepithelial neoplasias | ||
| Liver | 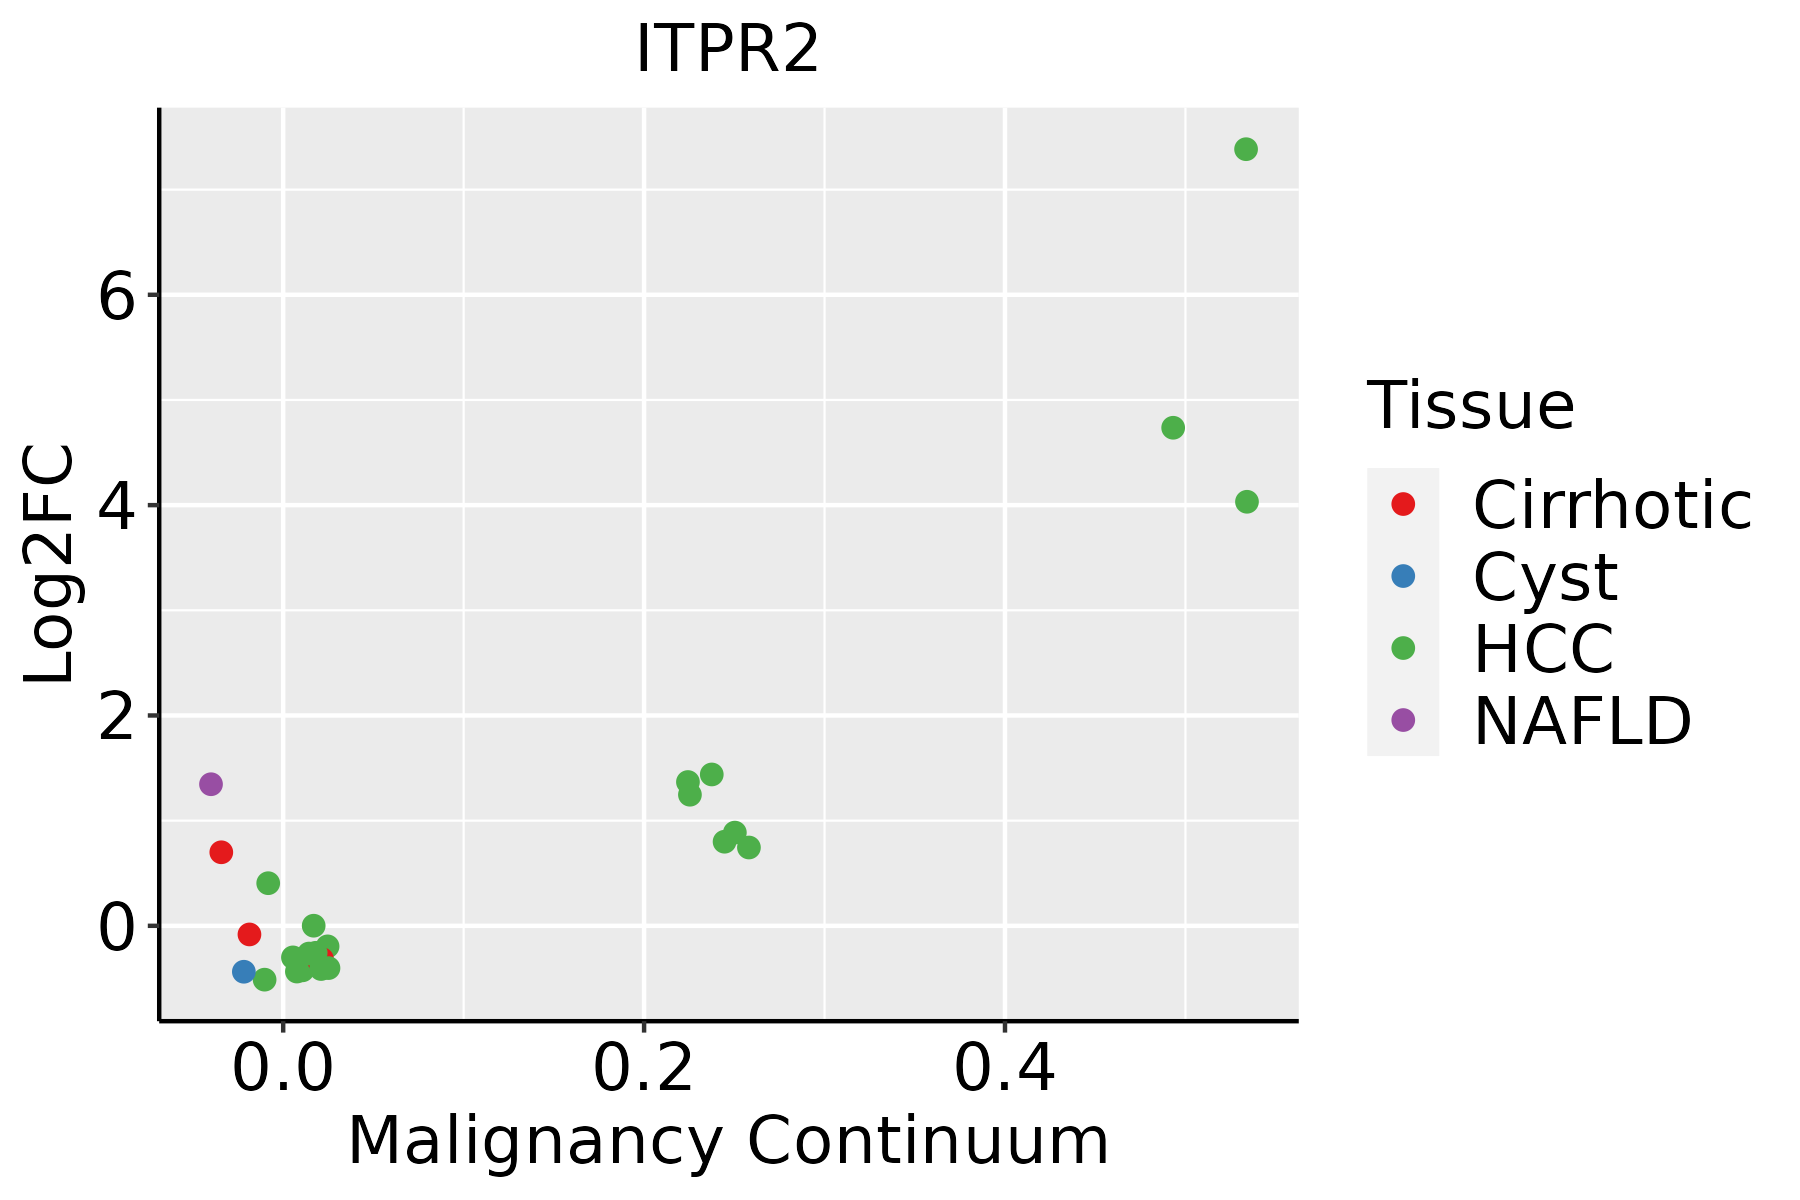 | HCC: Hepatocellular carcinoma |
| NAFLD: Non-alcoholic fatty liver disease | ||
| Lung | 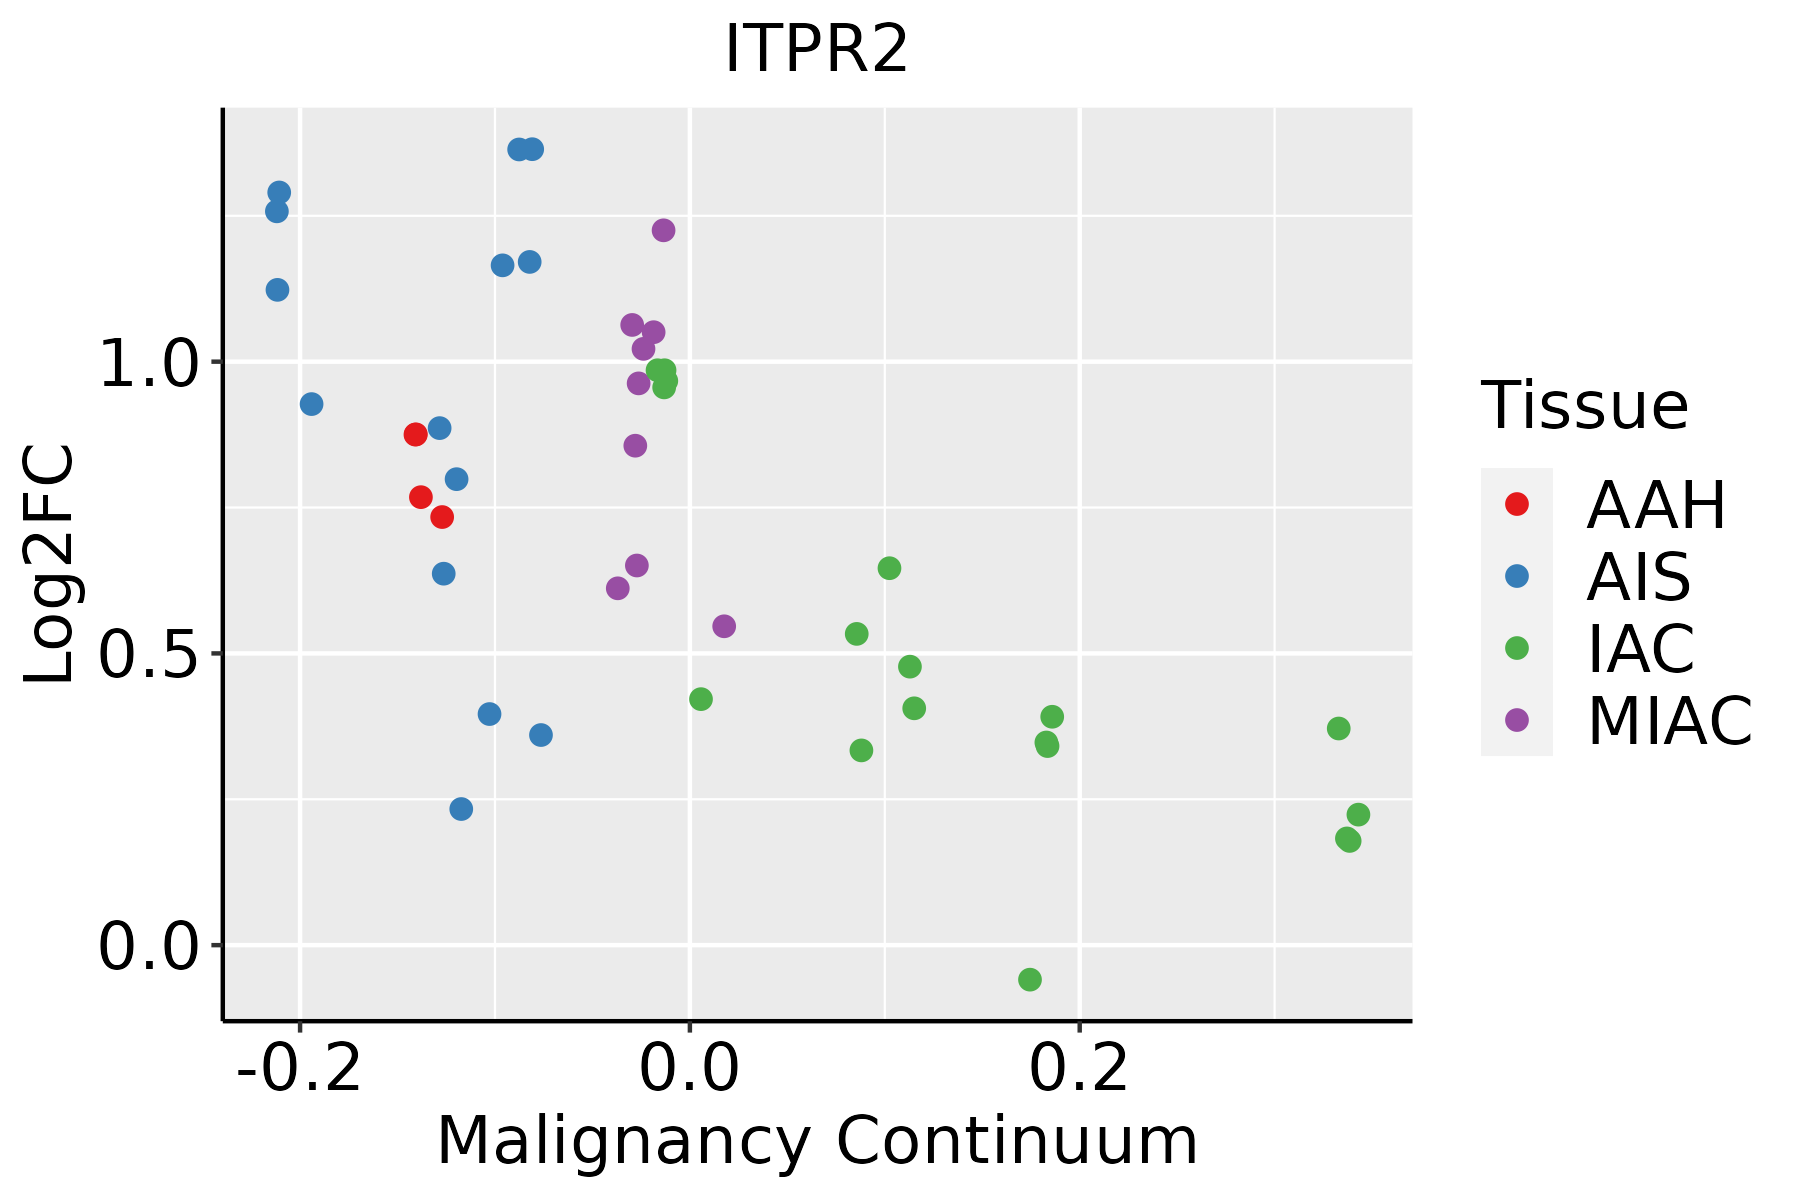 | AAH: Atypical adenomatous hyperplasia |
| AIS: Adenocarcinoma in situ | ||
| IAC: Invasive lung adenocarcinoma | ||
| MIA: Minimally invasive adenocarcinoma | ||
| Prostate | 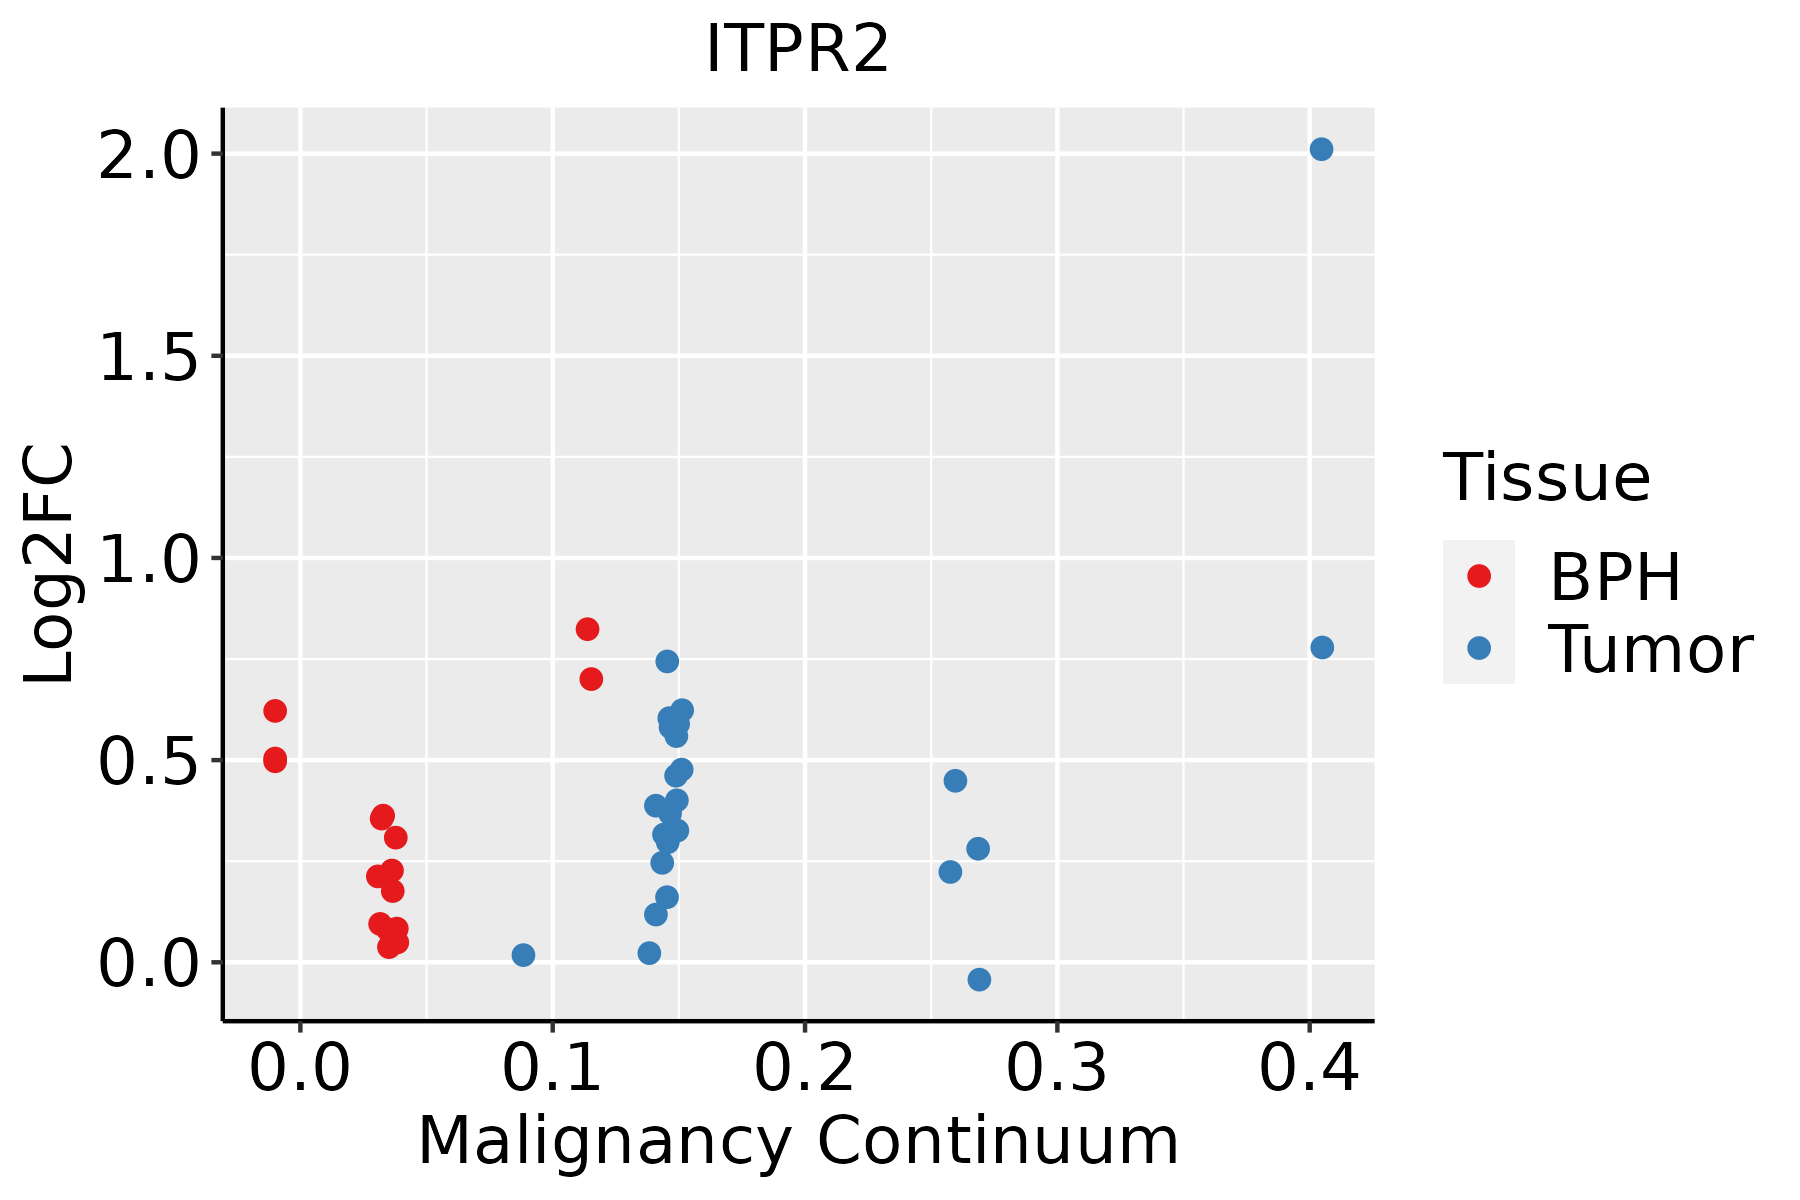 | BPH: Benign Prostatic Hyperplasia |
| Skin |  | AK: Actinic keratosis |
| cSCC: Cutaneous squamous cell carcinoma | ||
| SCCIS:squamous cell carcinoma in situ | ||
| Thyroid | 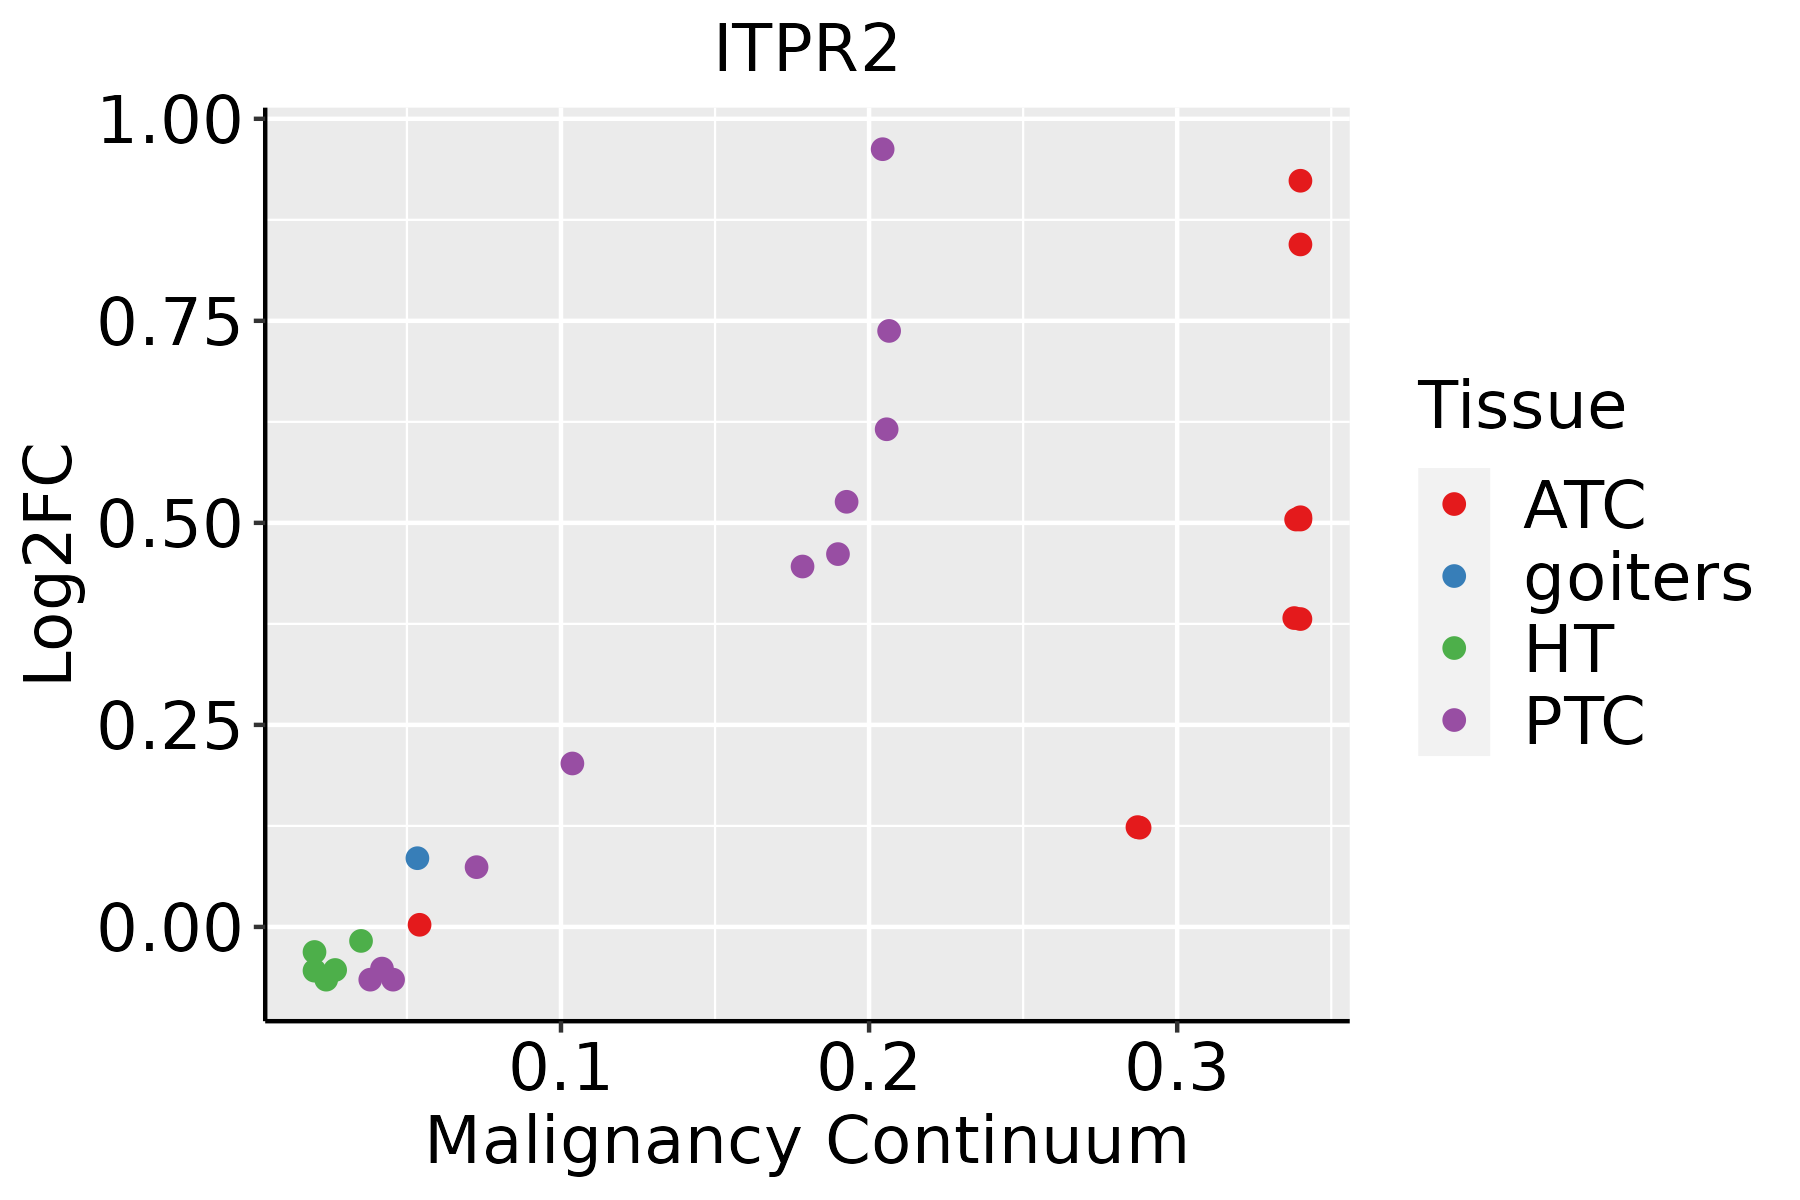 | ATC: Anaplastic thyroid cancer |
| HT: Hashimoto's thyroiditis | ||
| PTC: Papillary thyroid cancer |
| ∗log2FC in expression of this searched gene in stem-like cells from each diseased tissue sample relative to stem-like cells in normal samples in each tissue plotted against the malignancy continuum. Samples are colored based on if they are from different disease stage. |
Top |
Malignant transformation related pathway analysis |
| Find out the enriched GO biological processes and KEGG pathways involved in transition from healthy to precancer to cancer |
| Tissue | Disease Stage | Enriched GO biological Processes |
| Colorectum | AD |  |
| Colorectum | SER |  |
| Colorectum | MSS |  |
| Colorectum | MSI-H |  |
| Colorectum | FAP |  |
| ∗Top 15 enriched GO BP terms are showed in the bar plot of each disease state in each tissue. Each row represents a significant GO biological process which is colored according to the -log10(p.adjust). |
| Page: 1 2 3 4 5 6 7 8 9 |
| GO ID | Tissue | Disease Stage | Description | Gene Ratio | Bg Ratio | pvalue | p.adjust | Count |
| GO:005123516 | Prostate | BPH | maintenance of location | 80/3107 | 327/18723 | 1.55e-04 | 1.36e-03 | 80 |
| GO:005159118 | Prostate | BPH | response to cAMP | 29/3107 | 93/18723 | 3.66e-04 | 2.71e-03 | 29 |
| GO:001407416 | Prostate | BPH | response to purine-containing compound | 39/3107 | 148/18723 | 1.71e-03 | 9.84e-03 | 39 |
| GO:004668316 | Prostate | BPH | response to organophosphorus | 35/3107 | 131/18723 | 2.23e-03 | 1.23e-02 | 35 |
| GO:00480163 | Prostate | BPH | inositol phosphate-mediated signaling | 18/3107 | 55/18723 | 2.50e-03 | 1.34e-02 | 18 |
| GO:00973062 | Prostate | BPH | cellular response to alcohol | 25/3107 | 93/18723 | 8.12e-03 | 3.53e-02 | 25 |
| GO:007048218 | Prostate | Tumor | response to oxygen levels | 102/3246 | 347/18723 | 1.62e-08 | 5.75e-07 | 102 |
| GO:003629318 | Prostate | Tumor | response to decreased oxygen levels | 94/3246 | 322/18723 | 8.37e-08 | 2.29e-06 | 94 |
| GO:000166618 | Prostate | Tumor | response to hypoxia | 90/3246 | 307/18723 | 1.27e-07 | 3.28e-06 | 90 |
| GO:009730518 | Prostate | Tumor | response to alcohol | 68/3246 | 253/18723 | 9.02e-05 | 8.88e-04 | 68 |
| GO:005165119 | Prostate | Tumor | maintenance of location in cell | 56/3246 | 214/18723 | 7.31e-04 | 5.08e-03 | 56 |
| GO:005159119 | Prostate | Tumor | response to cAMP | 29/3246 | 93/18723 | 7.66e-04 | 5.24e-03 | 29 |
| GO:005123517 | Prostate | Tumor | maintenance of location | 78/3246 | 327/18723 | 1.56e-03 | 9.55e-03 | 78 |
| GO:001407417 | Prostate | Tumor | response to purine-containing compound | 40/3246 | 148/18723 | 2.07e-03 | 1.18e-02 | 40 |
| GO:004668317 | Prostate | Tumor | response to organophosphorus | 36/3246 | 131/18723 | 2.48e-03 | 1.38e-02 | 36 |
| GO:009730611 | Prostate | Tumor | cellular response to alcohol | 27/3246 | 93/18723 | 3.59e-03 | 1.85e-02 | 27 |
| GO:004801612 | Prostate | Tumor | inositol phosphate-mediated signaling | 18/3246 | 55/18723 | 4.08e-03 | 2.06e-02 | 18 |
| GO:005159120 | Skin | AK | response to cAMP | 25/1910 | 93/18723 | 4.33e-06 | 1.05e-04 | 25 |
| GO:005123526 | Skin | AK | maintenance of location | 56/1910 | 327/18723 | 7.44e-05 | 1.06e-03 | 56 |
| GO:004668319 | Skin | AK | response to organophosphorus | 27/1910 | 131/18723 | 2.87e-04 | 3.00e-03 | 27 |
| Page: 1 2 3 4 5 6 7 8 |
| Pathway ID | Tissue | Disease Stage | Description | Gene Ratio | Bg Ratio | pvalue | p.adjust | qvalue | Count |
| hsa050122 | Colorectum | SER | Parkinson disease | 132/1580 | 266/8465 | 2.72e-31 | 9.03e-29 | 6.55e-29 | 132 |
| hsa050202 | Colorectum | SER | Prion disease | 119/1580 | 273/8465 | 4.61e-22 | 3.06e-20 | 2.22e-20 | 119 |
| hsa050102 | Colorectum | SER | Alzheimer disease | 146/1580 | 384/8465 | 6.52e-20 | 2.40e-18 | 1.75e-18 | 146 |
| hsa050222 | Colorectum | SER | Pathways of neurodegeneration - multiple diseases | 168/1580 | 476/8465 | 6.23e-19 | 2.07e-17 | 1.50e-17 | 168 |
| hsa051312 | Colorectum | SER | Shigellosis | 87/1580 | 247/8465 | 3.07e-10 | 7.27e-09 | 5.28e-09 | 87 |
| hsa049222 | Colorectum | SER | Glucagon signaling pathway | 38/1580 | 107/8465 | 2.57e-05 | 3.28e-04 | 2.38e-04 | 38 |
| hsa050172 | Colorectum | SER | Spinocerebellar ataxia | 46/1580 | 143/8465 | 6.78e-05 | 7.51e-04 | 5.45e-04 | 46 |
| hsa047232 | Colorectum | SER | Retrograde endocannabinoid signaling | 47/1580 | 148/8465 | 8.10e-05 | 8.68e-04 | 6.30e-04 | 47 |
| hsa049712 | Colorectum | SER | Gastric acid secretion | 27/1580 | 76/8465 | 3.65e-04 | 3.27e-03 | 2.38e-03 | 27 |
| hsa052052 | Colorectum | SER | Proteoglycans in cancer | 58/1580 | 205/8465 | 4.37e-04 | 3.82e-03 | 2.77e-03 | 58 |
| hsa051702 | Colorectum | SER | Human immunodeficiency virus 1 infection | 58/1580 | 212/8465 | 1.08e-03 | 8.56e-03 | 6.21e-03 | 58 |
| hsa049282 | Colorectum | SER | Parathyroid hormone synthesis, secretion and action | 31/1580 | 106/8465 | 5.20e-03 | 3.28e-02 | 2.38e-02 | 31 |
| hsa047282 | Colorectum | SER | Dopaminergic synapse | 37/1580 | 132/8465 | 5.27e-03 | 3.28e-02 | 2.38e-02 | 37 |
| hsa049722 | Colorectum | SER | Pancreatic secretion | 30/1580 | 102/8465 | 5.41e-03 | 3.28e-02 | 2.38e-02 | 30 |
| hsa04915 | Colorectum | SER | Estrogen signaling pathway | 38/1580 | 138/8465 | 6.51e-03 | 3.68e-02 | 2.67e-02 | 38 |
| hsa051632 | Colorectum | SER | Human cytomegalovirus infection | 57/1580 | 225/8465 | 7.40e-03 | 3.84e-02 | 2.79e-02 | 57 |
| hsa047202 | Colorectum | SER | Long-term potentiation | 21/1580 | 67/8465 | 8.52e-03 | 4.26e-02 | 3.09e-02 | 21 |
| hsa049122 | Colorectum | SER | GnRH signaling pathway | 27/1580 | 93/8465 | 9.68e-03 | 4.72e-02 | 3.43e-02 | 27 |
| hsa050123 | Colorectum | SER | Parkinson disease | 132/1580 | 266/8465 | 2.72e-31 | 9.03e-29 | 6.55e-29 | 132 |
| hsa050203 | Colorectum | SER | Prion disease | 119/1580 | 273/8465 | 4.61e-22 | 3.06e-20 | 2.22e-20 | 119 |
| Page: 1 2 3 4 5 6 7 8 9 10 11 12 13 14 15 16 17 18 19 20 21 22 |
Top |
Cell-cell communication analysis |
| Identification of potential cell-cell interactions between two cell types and their ligand-receptor pairs for different disease states |
| Ligand | Receptor | LRpair | Pathway | Tissue | Disease Stage |
| Page: 1 |
Top |
Single-cell gene regulatory network inference analysis |
| Find out the significant the regulons (TFs) and the target genes of each regulon across cell types for different disease states |
| TF | Cell Type | Tissue | Disease Stage | Target Gene | RSS | Regulon Activity |
| ∗The dot plots of a searched regulon are shown for all cell subpopulations in each disease state of each tissue based on the regulon specific score inferred using pySCENIC and by calculating the average expression. |
| Page: 1 |
Top |
Somatic mutation of malignant transformation related genes |
| Annotation of somatic variants for genes involved in malignant transformation |
| Hugo Symbol | Variant Class | Variant Classification | dbSNP RS | HGVSc | HGVSp | HGVSp Short | SWISSPROT | BIOTYPE | SIFT | PolyPhen | Tumor Sample Barcode | Tissue | Histology | Sex | Age | Stage | Therapy Types | Drugs | Outcome |
| ITPR2 | SNV | Missense_Mutation | novel | c.771G>C | p.Glu257Asp | p.E257D | Q14571 | protein_coding | tolerated(0.08) | benign(0.186) | TCGA-5L-AAT1-01 | Breast | breast invasive carcinoma | Female | <65 | III/IV | Hormone Therapy | letrozol | SD |
| ITPR2 | SNV | Missense_Mutation | c.3469A>G | p.Asn1157Asp | p.N1157D | Q14571 | protein_coding | tolerated(0.7) | benign(0) | TCGA-A2-A25D-01 | Breast | breast invasive carcinoma | Female | >=65 | III/IV | Hormone Therapy | tamoxiphen | SD | |
| ITPR2 | SNV | Missense_Mutation | c.7276N>A | p.Asp2426Asn | p.D2426N | Q14571 | protein_coding | deleterious(0.04) | probably_damaging(0.936) | TCGA-A8-A06Q-01 | Breast | breast invasive carcinoma | Female | <65 | III/IV | Unknown | Unknown | SD | |
| ITPR2 | SNV | Missense_Mutation | c.3884N>G | p.His1295Arg | p.H1295R | Q14571 | protein_coding | deleterious(0) | probably_damaging(0.999) | TCGA-AC-A23H-01 | Breast | breast invasive carcinoma | Female | >=65 | I/II | Unknown | Unknown | PD | |
| ITPR2 | SNV | Missense_Mutation | c.4252N>A | p.Glu1418Lys | p.E1418K | Q14571 | protein_coding | deleterious(0) | possibly_damaging(0.871) | TCGA-AO-A0JA-01 | Breast | breast invasive carcinoma | Female | <65 | III/IV | Hormone Therapy | leuprolide | SD | |
| ITPR2 | SNV | Missense_Mutation | c.365A>T | p.Gln122Leu | p.Q122L | Q14571 | protein_coding | deleterious(0) | possibly_damaging(0.893) | TCGA-AR-A256-01 | Breast | breast invasive carcinoma | Female | <65 | I/II | Chemotherapy | doxorubicin | PD | |
| ITPR2 | SNV | Missense_Mutation | c.3934N>A | p.Phe1312Ile | p.F1312I | Q14571 | protein_coding | deleterious(0) | probably_damaging(0.99) | TCGA-B6-A0I9-01 | Breast | breast invasive carcinoma | Female | <65 | III/IV | Unknown | Unknown | PD | |
| ITPR2 | SNV | Missense_Mutation | c.3704N>C | p.Met1235Thr | p.M1235T | Q14571 | protein_coding | deleterious(0) | possibly_damaging(0.602) | TCGA-BH-A18G-01 | Breast | breast invasive carcinoma | Female | >=65 | I/II | Unknown | Unknown | SD | |
| ITPR2 | SNV | Missense_Mutation | c.1527N>A | p.Met509Ile | p.M509I | Q14571 | protein_coding | tolerated(0.08) | probably_damaging(0.949) | TCGA-BH-A1EY-01 | Breast | breast invasive carcinoma | Female | >=65 | I/II | Unknown | Unknown | PD | |
| ITPR2 | SNV | Missense_Mutation | c.5021N>A | p.Ile1674Asn | p.I1674N | Q14571 | protein_coding | deleterious(0) | possibly_damaging(0.905) | TCGA-D8-A1XK-01 | Breast | breast invasive carcinoma | Female | <65 | I/II | Chemotherapy | doxorubicine+cyclophosphamide | SD |
| Page: 1 2 3 4 5 6 7 8 9 10 11 12 13 14 15 16 17 18 19 20 21 22 23 24 25 26 27 28 29 30 31 |
Top |
Related drugs of malignant transformation related genes |
| Identification of chemicals and drugs interact with genes involved in malignant transfromation |
| (DGIdb 4.0) |
| Entrez ID | Symbol | Category | Interaction Types | Drug Claim Name | Drug Name | PMIDs |
| 3709 | ITPR2 | ION CHANNEL, DRUGGABLE GENOME | activator | 178101040 | ||
| 3709 | ITPR2 | ION CHANNEL, DRUGGABLE GENOME | antagonist | 135652750 | ||
| 3709 | ITPR2 | ION CHANNEL, DRUGGABLE GENOME | activator | 178101039 | ||
| 3709 | ITPR2 | ION CHANNEL, DRUGGABLE GENOME | activator | 178100946 | ||
| 3709 | ITPR2 | ION CHANNEL, DRUGGABLE GENOME | activator | 135652731 |
| Page: 1 |

Copyright 2023-Present -The University of Texas Health Science Center at Houston |