
|
|||||
|
 | |
| |
| |
| |
| |
| |
|
Gene: IL20RB |
Gene summary for IL20RB |
| Gene information | Species | Human | Gene symbol | IL20RB | Gene ID | 53833 |
| Gene name | interleukin 20 receptor subunit beta | |
| Gene Alias | DIRS1 | |
| Cytomap | 3q22.3 | |
| Gene Type | protein-coding | GO ID | GO:0001775 | UniProtAcc | Q6UXL0 |
Top |
Malignant transformation analysis |
| Identification of the aberrant gene expression in precancerous and cancerous lesions by comparing the gene expression of stem-like cells in diseased tissues with normal stem cells |
| Entrez ID | Symbol | Replicates | Species | Organ | Tissue | Adj P-value | Log2FC | Malignancy |
| 53833 | IL20RB | CA_HPV_3 | Human | Cervix | CC | 5.23e-11 | 3.13e-01 | 0.0414 |
| 53833 | IL20RB | N_HPV_2 | Human | Cervix | N_HPV | 1.01e-03 | 2.01e-01 | -0.0131 |
| 53833 | IL20RB | CCI_1 | Human | Cervix | CC | 3.41e-15 | 1.01e+00 | 0.528 |
| 53833 | IL20RB | CCI_2 | Human | Cervix | CC | 5.61e-14 | 9.83e-01 | 0.5249 |
| 53833 | IL20RB | CCI_3 | Human | Cervix | CC | 3.84e-31 | 1.63e+00 | 0.516 |
| 53833 | IL20RB | CCII_1 | Human | Cervix | CC | 9.56e-09 | 4.08e-01 | 0.3249 |
| 53833 | IL20RB | Tumor | Human | Cervix | CC | 2.82e-34 | 6.59e-01 | 0.1241 |
| 53833 | IL20RB | sample1 | Human | Cervix | CC | 3.19e-03 | 3.33e-01 | 0.0959 |
| 53833 | IL20RB | sample3 | Human | Cervix | CC | 2.76e-43 | 6.79e-01 | 0.1387 |
| 53833 | IL20RB | L1 | Human | Cervix | CC | 3.61e-02 | 2.97e-01 | 0.0802 |
| 53833 | IL20RB | T1 | Human | Cervix | CC | 9.86e-04 | 2.43e-01 | 0.0918 |
| 53833 | IL20RB | T3 | Human | Cervix | CC | 2.28e-39 | 6.86e-01 | 0.1389 |
| 53833 | IL20RB | LZE8T | Human | Esophagus | ESCC | 3.64e-02 | 2.77e-01 | 0.067 |
| 53833 | IL20RB | LZE24T | Human | Esophagus | ESCC | 4.25e-02 | -7.13e-02 | 0.0596 |
| 53833 | IL20RB | LZE21T | Human | Esophagus | ESCC | 2.54e-02 | 1.15e-01 | 0.0655 |
| 53833 | IL20RB | P4T-E | Human | Esophagus | ESCC | 6.28e-03 | -2.84e-02 | 0.1323 |
| 53833 | IL20RB | P5T-E | Human | Esophagus | ESCC | 1.92e-07 | 1.66e-01 | 0.1327 |
| 53833 | IL20RB | P8T-E | Human | Esophagus | ESCC | 1.86e-03 | -1.34e-01 | 0.0889 |
| 53833 | IL20RB | P9T-E | Human | Esophagus | ESCC | 4.32e-02 | -1.26e-01 | 0.1131 |
| 53833 | IL20RB | P12T-E | Human | Esophagus | ESCC | 6.54e-06 | -9.92e-02 | 0.1122 |
| Page: 1 2 3 4 |
| Tissue | Expression Dynamics | Abbreviation |
| Cervix | 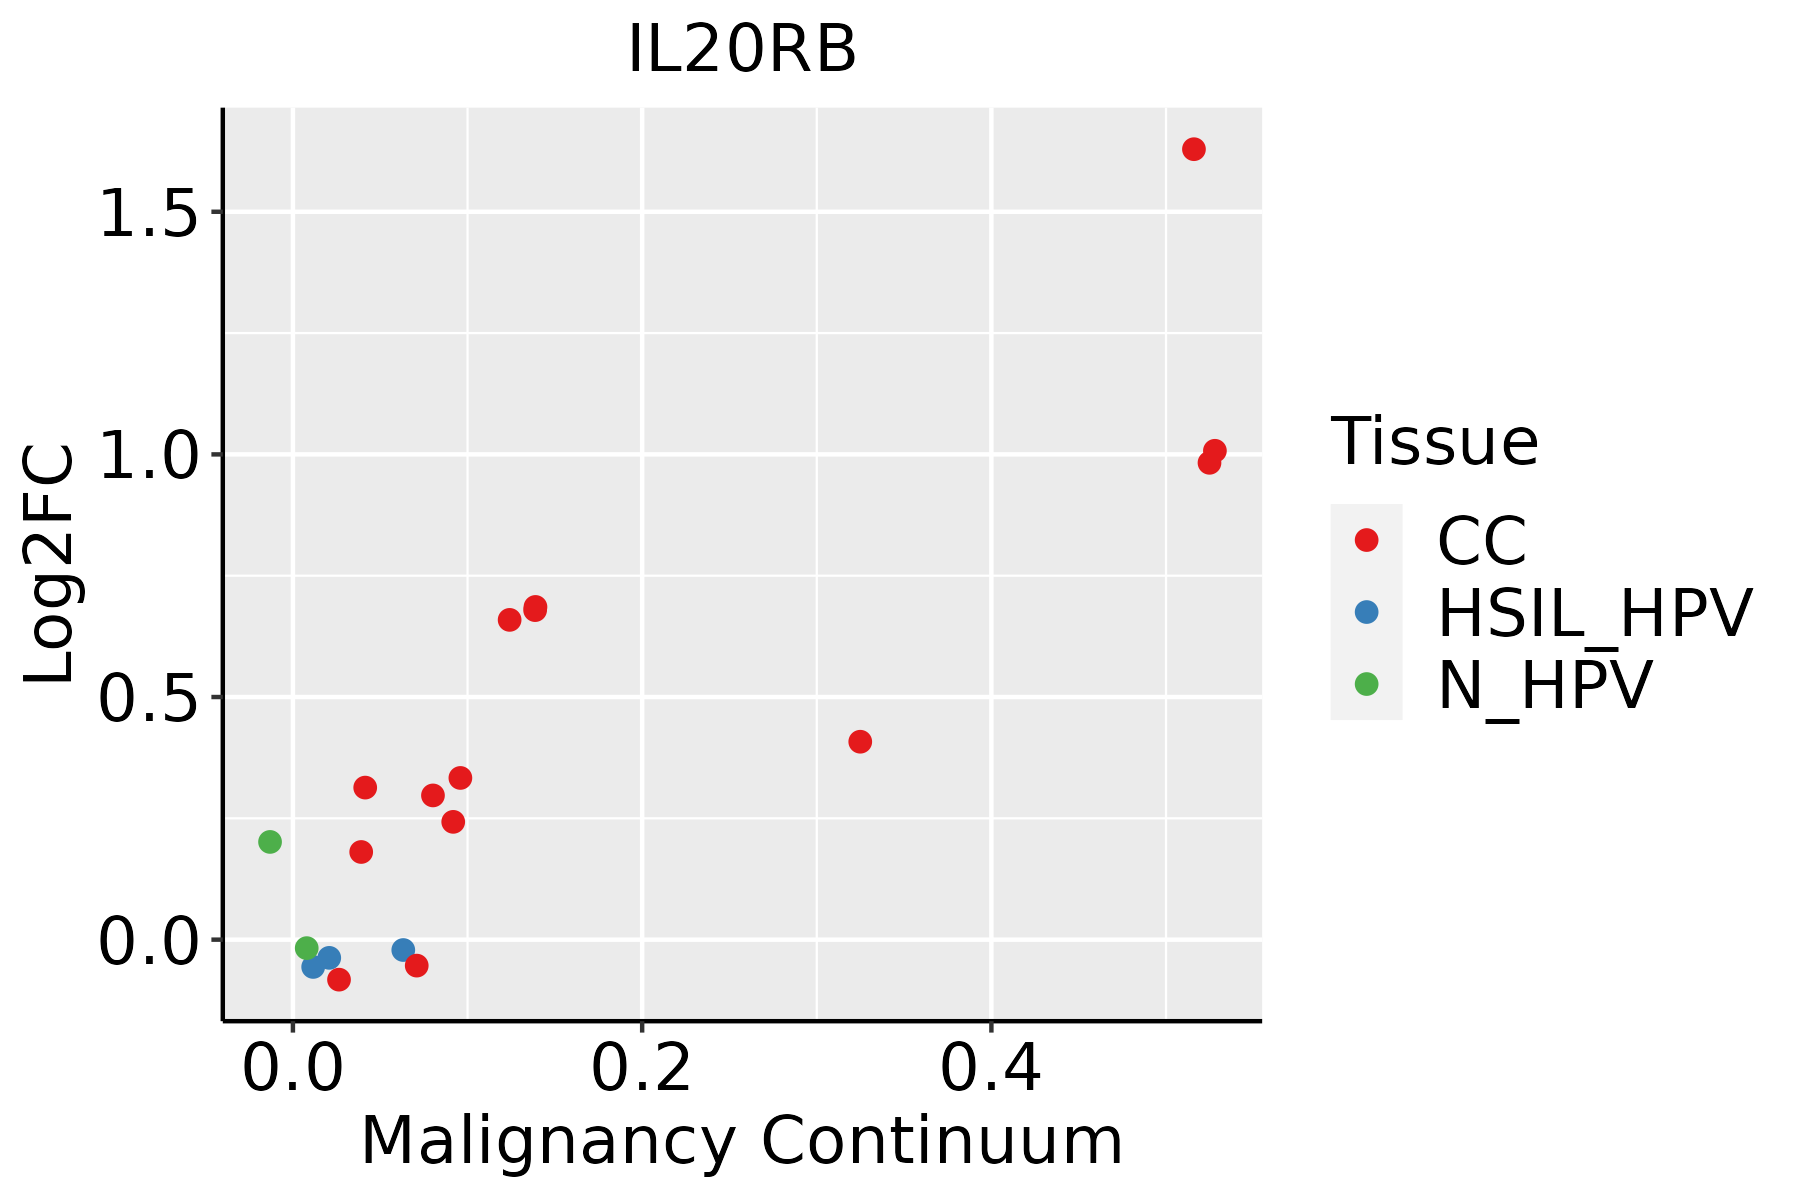 | CC: Cervix cancer |
| HSIL_HPV: HPV-infected high-grade squamous intraepithelial lesions | ||
| N_HPV: HPV-infected normal cervix | ||
| Esophagus | 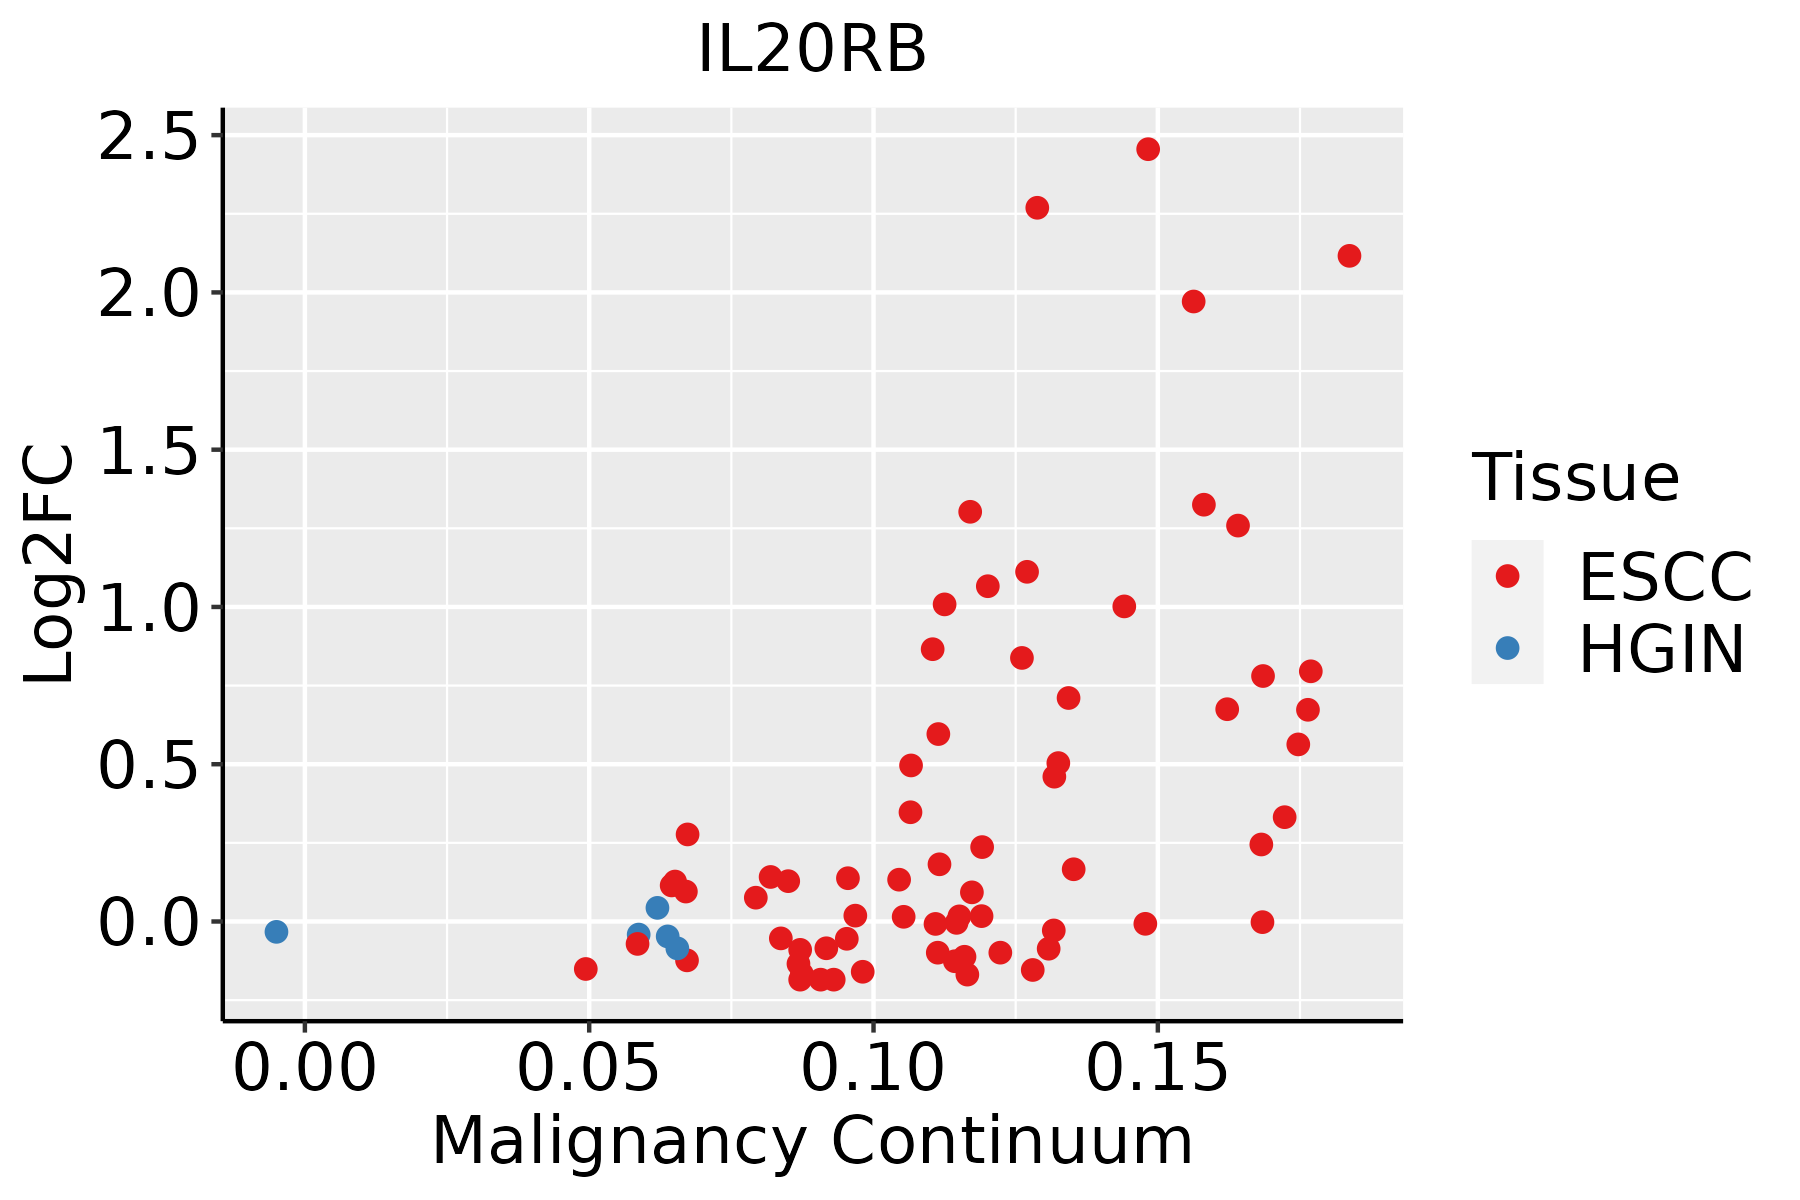 | ESCC: Esophageal squamous cell carcinoma |
| HGIN: High-grade intraepithelial neoplasias | ||
| LGIN: Low-grade intraepithelial neoplasias | ||
| Oral Cavity | 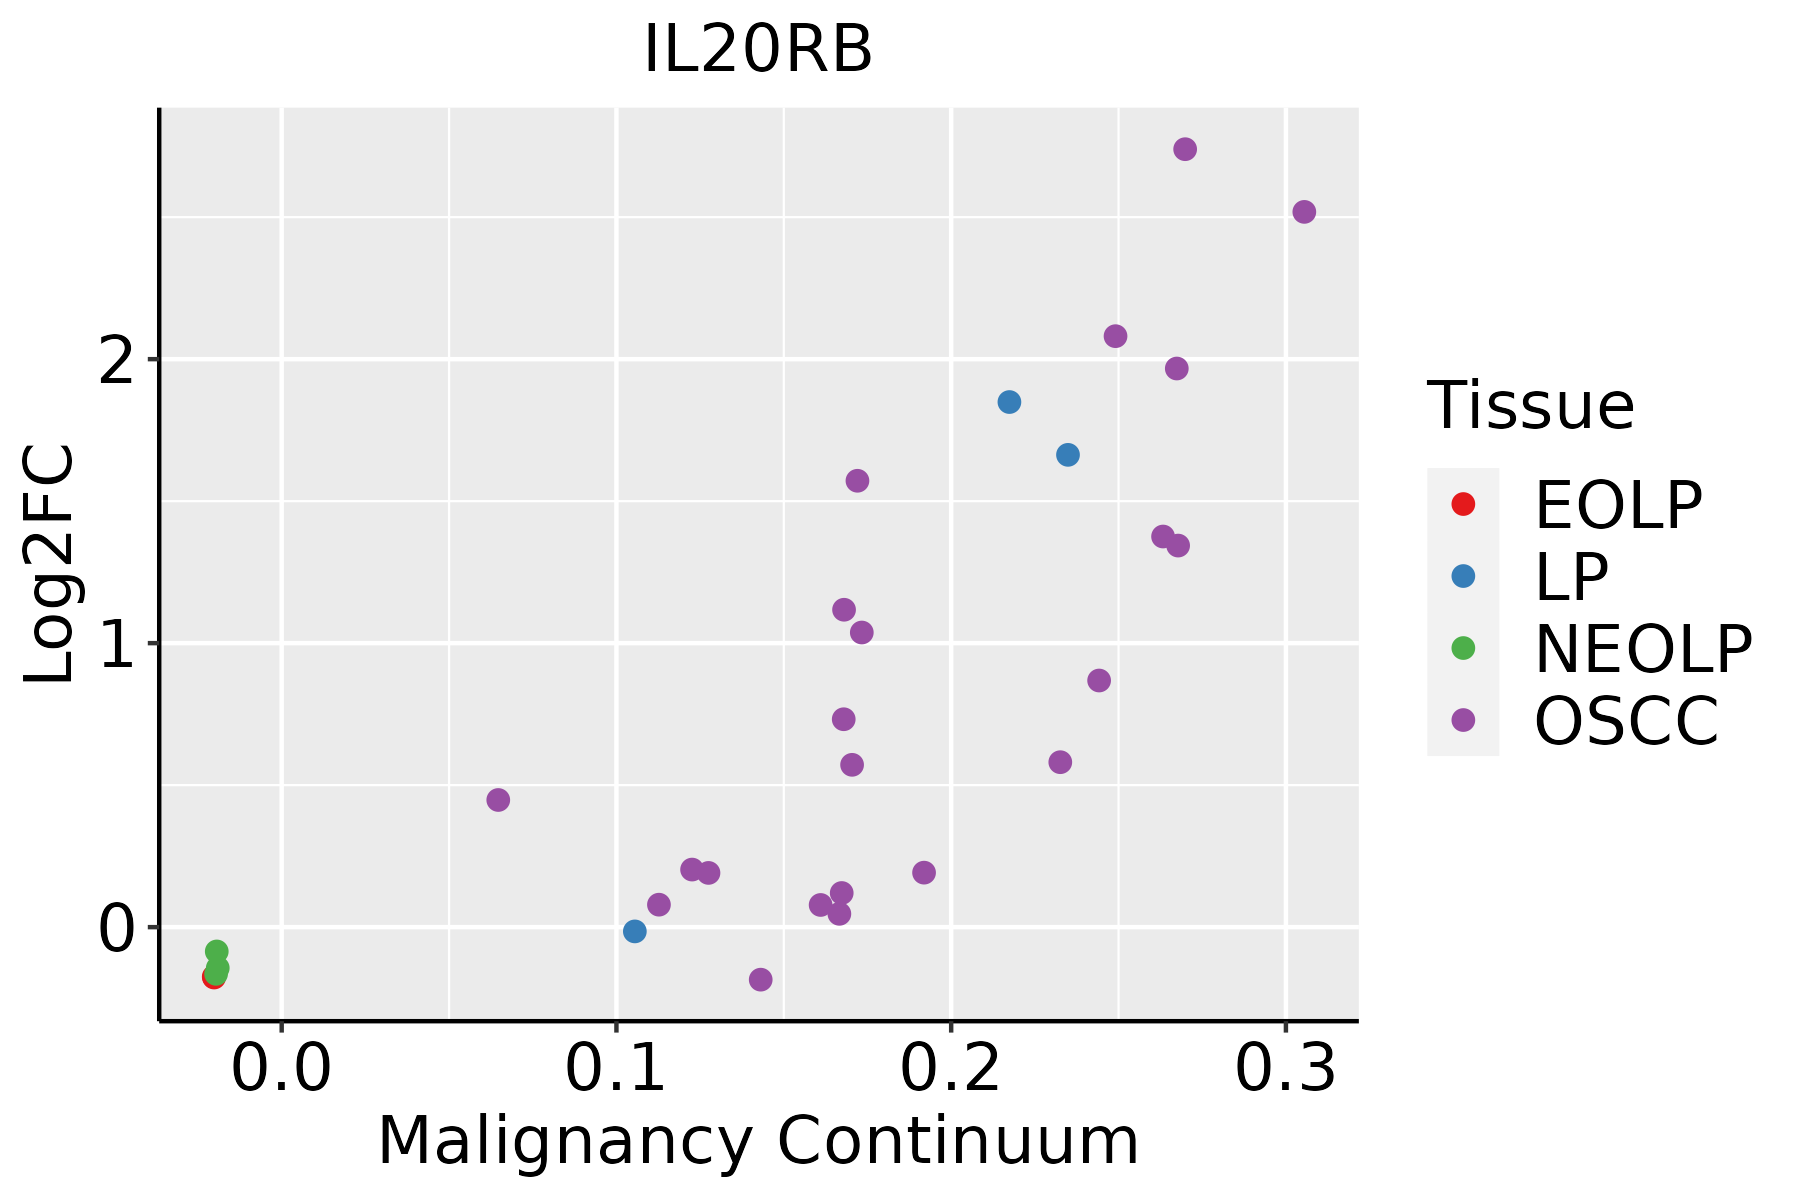 | EOLP: Erosive Oral lichen planus |
| LP: leukoplakia | ||
| NEOLP: Non-erosive oral lichen planus | ||
| OSCC: Oral squamous cell carcinoma | ||
| Skin | 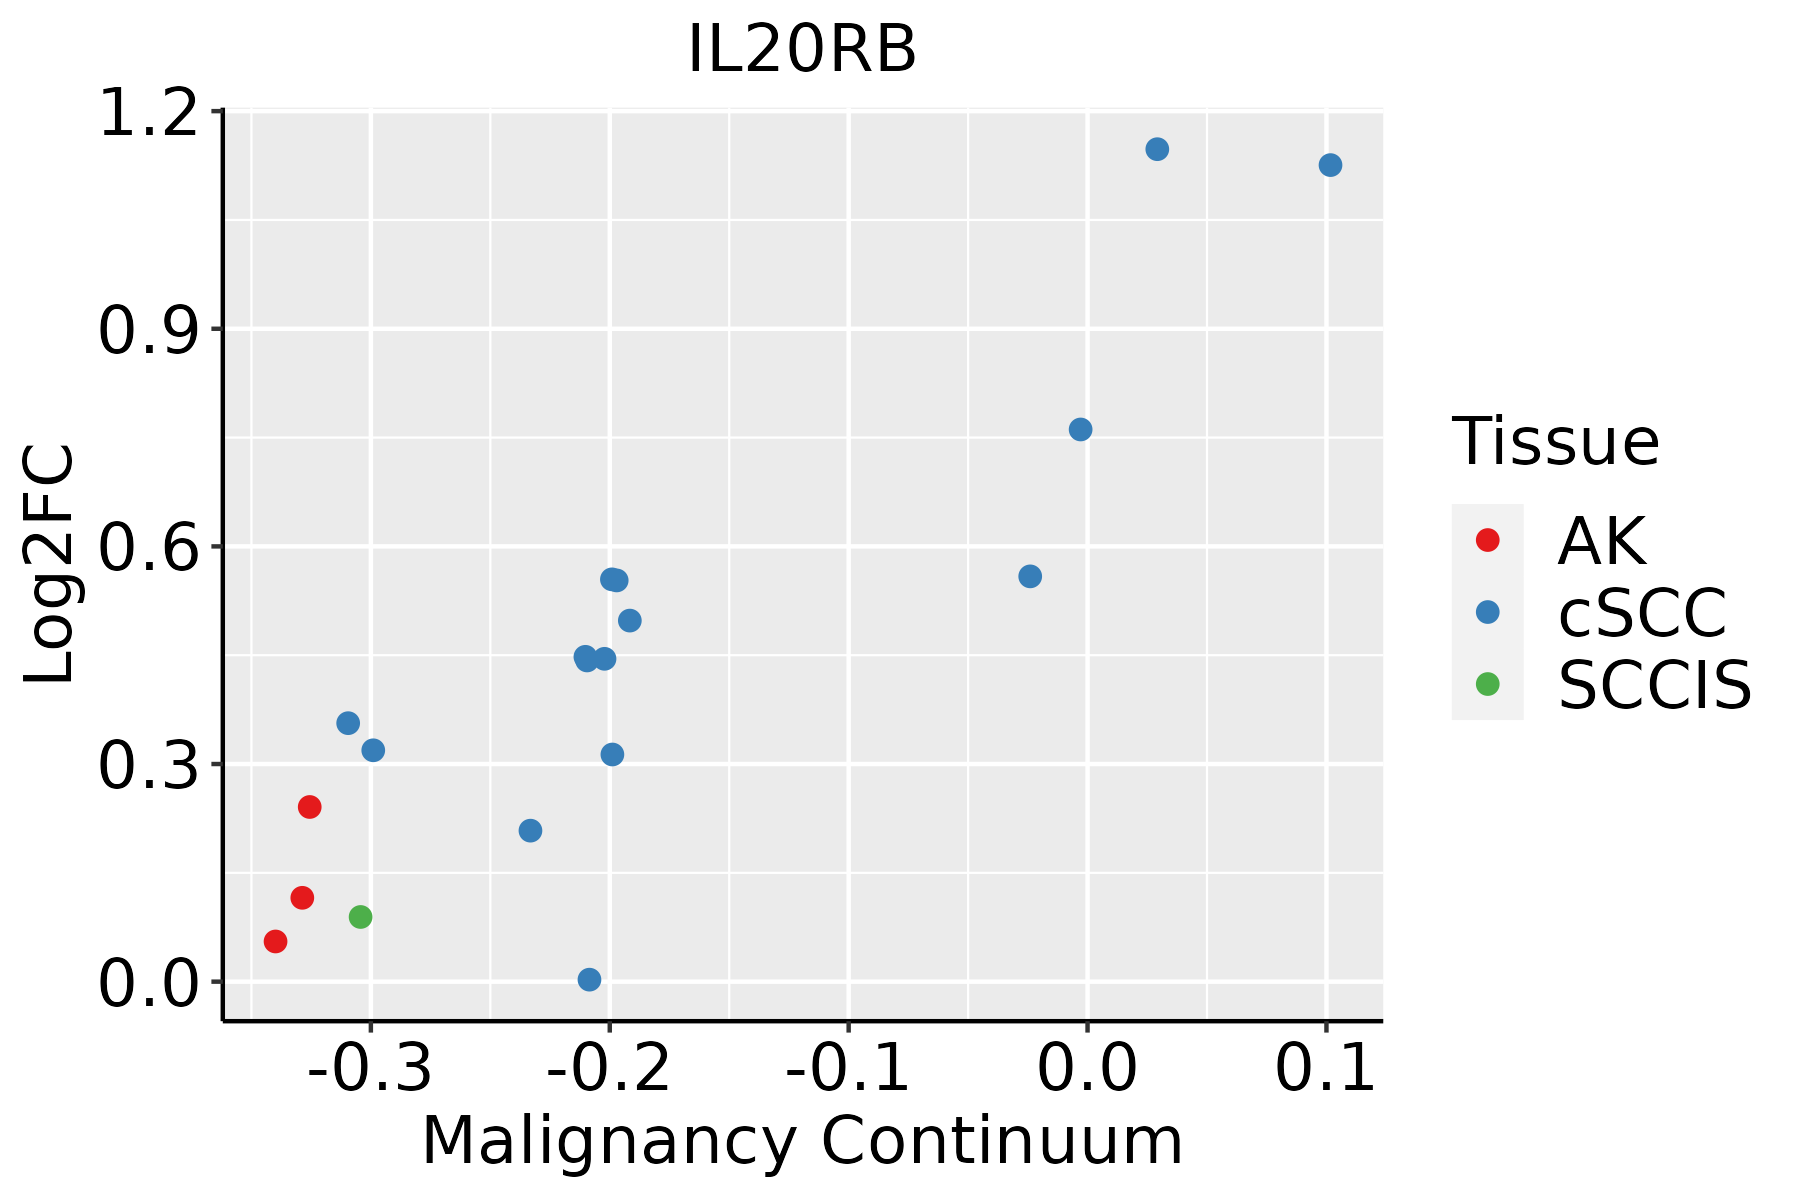 | AK: Actinic keratosis |
| cSCC: Cutaneous squamous cell carcinoma | ||
| SCCIS:squamous cell carcinoma in situ |
| ∗log2FC in expression of this searched gene in stem-like cells from each diseased tissue sample relative to stem-like cells in normal samples in each tissue plotted against the malignancy continuum. Samples are colored based on if they are from different disease stage. |
Top |
Malignant transformation related pathway analysis |
| Find out the enriched GO biological processes and KEGG pathways involved in transition from healthy to precancer to cancer |
| Tissue | Disease Stage | Enriched GO biological Processes |
| Colorectum | AD |  |
| Colorectum | SER |  |
| Colorectum | MSS |  |
| Colorectum | MSI-H |  |
| Colorectum | FAP |  |
| ∗Top 15 enriched GO BP terms are showed in the bar plot of each disease state in each tissue. Each row represents a significant GO biological process which is colored according to the -log10(p.adjust). |
| Page: 1 2 3 4 5 6 7 8 9 |
| GO ID | Tissue | Disease Stage | Description | Gene Ratio | Bg Ratio | pvalue | p.adjust | Count |
| GO:000181916 | Esophagus | ESCC | positive regulation of cytokine production | 244/8552 | 467/18723 | 2.29e-03 | 1.01e-02 | 244 |
| GO:000715918 | Esophagus | ESCC | leukocyte cell-cell adhesion | 192/8552 | 371/18723 | 1.03e-02 | 3.51e-02 | 192 |
| GO:190303717 | Esophagus | ESCC | regulation of leukocyte cell-cell adhesion | 174/8552 | 336/18723 | 1.36e-02 | 4.43e-02 | 174 |
| GO:004887220 | Oral cavity | OSCC | homeostasis of number of cells | 152/7305 | 272/18723 | 1.08e-08 | 2.23e-07 | 152 |
| GO:004211016 | Oral cavity | OSCC | T cell activation | 245/7305 | 487/18723 | 2.00e-07 | 3.22e-06 | 245 |
| GO:002240718 | Oral cavity | OSCC | regulation of cell-cell adhesion | 218/7305 | 448/18723 | 1.71e-05 | 1.68e-04 | 218 |
| GO:005086315 | Oral cavity | OSCC | regulation of T cell activation | 161/7305 | 329/18723 | 1.44e-04 | 1.02e-03 | 161 |
| GO:00192214 | Oral cavity | OSCC | cytokine-mediated signaling pathway | 222/7305 | 472/18723 | 2.02e-04 | 1.35e-03 | 222 |
| GO:000715916 | Oral cavity | OSCC | leukocyte cell-cell adhesion | 178/7305 | 371/18723 | 2.44e-04 | 1.57e-03 | 178 |
| GO:190303715 | Oral cavity | OSCC | regulation of leukocyte cell-cell adhesion | 162/7305 | 336/18723 | 3.39e-04 | 2.08e-03 | 162 |
| GO:000268310 | Oral cavity | OSCC | negative regulation of immune system process | 204/7305 | 434/18723 | 3.72e-04 | 2.27e-03 | 204 |
| GO:004209816 | Oral cavity | OSCC | T cell proliferation | 100/7305 | 199/18723 | 7.93e-04 | 4.27e-03 | 100 |
| GO:00071629 | Oral cavity | OSCC | negative regulation of cell adhesion | 145/7305 | 303/18723 | 9.95e-04 | 5.18e-03 | 145 |
| GO:00507774 | Oral cavity | OSCC | negative regulation of immune response | 97/7305 | 194/18723 | 1.16e-03 | 5.91e-03 | 97 |
| GO:000181910 | Oral cavity | OSCC | positive regulation of cytokine production | 213/7305 | 467/18723 | 1.93e-03 | 8.96e-03 | 213 |
| GO:00027646 | Oral cavity | OSCC | immune response-regulating signaling pathway | 212/7305 | 468/18723 | 2.93e-03 | 1.27e-02 | 212 |
| GO:00706618 | Oral cavity | OSCC | leukocyte proliferation | 145/7305 | 318/18723 | 9.31e-03 | 3.33e-02 | 145 |
| GO:00224086 | Oral cavity | OSCC | negative regulation of cell-cell adhesion | 92/7305 | 196/18723 | 1.41e-02 | 4.64e-02 | 92 |
| GO:00466517 | Oral cavity | OSCC | lymphocyte proliferation | 131/7305 | 288/18723 | 1.41e-02 | 4.67e-02 | 131 |
| GO:005077711 | Oral cavity | LP | negative regulation of immune response | 65/4623 | 194/18723 | 3.47e-03 | 2.32e-02 | 65 |
| Page: 1 2 3 4 5 6 7 8 9 |
| Pathway ID | Tissue | Disease Stage | Description | Gene Ratio | Bg Ratio | pvalue | p.adjust | qvalue | Count |
| Page: 1 |
Top |
Cell-cell communication analysis |
| Identification of potential cell-cell interactions between two cell types and their ligand-receptor pairs for different disease states |
| Ligand | Receptor | LRpair | Pathway | Tissue | Disease Stage |
| IL24 | IL20RA_IL20RB | IL24_IL20RA_IL20RB | IL10 | HNSCC | OSCC |
| IL24 | IL20RA_IL20RB | IL24_IL20RA_IL20RB | IL10 | HNSCC | Precancer |
| IL24 | IL22RA1_IL20RB | IL24_IL22RA1_IL20RB | IL10 | HNSCC | Precancer |
| Page: 1 |
Top |
Single-cell gene regulatory network inference analysis |
| Find out the significant the regulons (TFs) and the target genes of each regulon across cell types for different disease states |
| TF | Cell Type | Tissue | Disease Stage | Target Gene | RSS | Regulon Activity |
| ∗The dot plots of a searched regulon are shown for all cell subpopulations in each disease state of each tissue based on the regulon specific score inferred using pySCENIC and by calculating the average expression. |
| Page: 1 |
Top |
Somatic mutation of malignant transformation related genes |
| Annotation of somatic variants for genes involved in malignant transformation |
| Hugo Symbol | Variant Class | Variant Classification | dbSNP RS | HGVSc | HGVSp | HGVSp Short | SWISSPROT | BIOTYPE | SIFT | PolyPhen | Tumor Sample Barcode | Tissue | Histology | Sex | Age | Stage | Therapy Types | Drugs | Outcome |
| IL20RB | SNV | Missense_Mutation | c.432N>C | p.Glu144Asp | p.E144D | Q6UXL0 | protein_coding | tolerated(0.15) | benign(0.185) | TCGA-EK-A2PM-01 | Cervix | cervical & endocervical cancer | Female | >=65 | I/II | Unknown | Unknown | SD | |
| IL20RB | SNV | Missense_Mutation | c.402N>G | p.Asn134Lys | p.N134K | Q6UXL0 | protein_coding | tolerated(0.93) | benign(0.109) | TCGA-A6-3807-01 | Colorectum | colon adenocarcinoma | Female | <65 | III/IV | Ancillary | leucovorin | SD | |
| IL20RB | SNV | Missense_Mutation | rs770195073 | c.23T>C | p.Leu8Pro | p.L8P | Q6UXL0 | protein_coding | tolerated_low_confidence(0.06) | benign(0.006) | TCGA-CK-4951-01 | Colorectum | colon adenocarcinoma | Female | >=65 | I/II | Unknown | Unknown | PD |
| IL20RB | SNV | Missense_Mutation | rs763416984 | c.890N>T | p.Thr297Met | p.T297M | Q6UXL0 | protein_coding | tolerated(0.19) | benign(0) | TCGA-D5-6931-01 | Colorectum | colon adenocarcinoma | Male | >=65 | III/IV | Unknown | Unknown | SD |
| IL20RB | SNV | Missense_Mutation | novel | c.346A>G | p.Thr116Ala | p.T116A | Q6UXL0 | protein_coding | tolerated(0.72) | benign(0.039) | TCGA-AJ-A3EK-01 | Endometrium | uterine corpus endometrioid carcinoma | Female | <65 | I/II | Chemotherapy | carboplatin | CR |
| IL20RB | SNV | Missense_Mutation | rs116592904 | c.892N>A | p.Ala298Thr | p.A298T | Q6UXL0 | protein_coding | tolerated(0.61) | benign(0.001) | TCGA-AJ-A3NE-01 | Endometrium | uterine corpus endometrioid carcinoma | Female | <65 | I/II | Unknown | Unknown | SD |
| IL20RB | SNV | Missense_Mutation | c.338N>C | p.Val113Ala | p.V113A | Q6UXL0 | protein_coding | deleterious(0) | probably_damaging(0.978) | TCGA-AP-A0LM-01 | Endometrium | uterine corpus endometrioid carcinoma | Female | <65 | III/IV | Chemotherapy | cisplatin | SD | |
| IL20RB | SNV | Missense_Mutation | novel | c.860G>A | p.Cys287Tyr | p.C287Y | Q6UXL0 | protein_coding | tolerated(0.17) | benign(0.13) | TCGA-AP-A1DK-01 | Endometrium | uterine corpus endometrioid carcinoma | Female | <65 | I/II | Unknown | Unknown | SD |
| IL20RB | SNV | Missense_Mutation | rs759673856 | c.748N>A | p.Val250Met | p.V250M | Q6UXL0 | protein_coding | deleterious(0.02) | benign(0.015) | TCGA-AP-A1DV-01 | Endometrium | uterine corpus endometrioid carcinoma | Female | <65 | I/II | Unknown | Unknown | SD |
| IL20RB | SNV | Missense_Mutation | novel | c.184G>A | p.Glu62Lys | p.E62K | Q6UXL0 | protein_coding | tolerated(0.13) | benign(0.047) | TCGA-AX-A1C9-01 | Endometrium | uterine corpus endometrioid carcinoma | Female | >=65 | I/II | Unknown | Unknown | SD |
| Page: 1 2 3 |
Top |
Related drugs of malignant transformation related genes |
| Identification of chemicals and drugs interact with genes involved in malignant transfromation |
| (DGIdb 4.0) |
| Entrez ID | Symbol | Category | Interaction Types | Drug Claim Name | Drug Name | PMIDs |
| Page: 1 |

Copyright 2023-Present -The University of Texas Health Science Center at Houston |