
|
|||||
|
 | |
| |
| |
| |
| |
| |
|
Gene: IGFBP4 |
Gene summary for IGFBP4 |
| Gene information | Species | Human | Gene symbol | IGFBP4 | Gene ID | 3487 |
| Gene name | insulin like growth factor binding protein 4 | |
| Gene Alias | BP-4 | |
| Cytomap | 17q21.2 | |
| Gene Type | protein-coding | GO ID | GO:0000165 | UniProtAcc | A0A024R1U8 |
Top |
Malignant transformation analysis |
| Identification of the aberrant gene expression in precancerous and cancerous lesions by comparing the gene expression of stem-like cells in diseased tissues with normal stem cells |
| Entrez ID | Symbol | Replicates | Species | Organ | Tissue | Adj P-value | Log2FC | Malignancy |
| 3487 | IGFBP4 | HTA11_3410_2000001011 | Human | Colorectum | AD | 1.34e-06 | 3.10e-01 | 0.0155 |
| 3487 | IGFBP4 | HTA11_2487_2000001011 | Human | Colorectum | SER | 6.39e-19 | 7.86e-01 | -0.1808 |
| 3487 | IGFBP4 | HTA11_1938_2000001011 | Human | Colorectum | AD | 6.24e-14 | 6.01e-01 | -0.0811 |
| 3487 | IGFBP4 | HTA11_78_2000001011 | Human | Colorectum | AD | 2.95e-07 | 4.17e-01 | -0.1088 |
| 3487 | IGFBP4 | HTA11_347_2000001011 | Human | Colorectum | AD | 1.30e-45 | 1.02e+00 | -0.1954 |
| 3487 | IGFBP4 | HTA11_411_2000001011 | Human | Colorectum | SER | 2.54e-02 | 8.14e-01 | -0.2602 |
| 3487 | IGFBP4 | HTA11_3361_2000001011 | Human | Colorectum | AD | 1.77e-17 | 8.18e-01 | -0.1207 |
| 3487 | IGFBP4 | HTA11_83_2000001011 | Human | Colorectum | SER | 3.13e-16 | 8.76e-01 | -0.1526 |
| 3487 | IGFBP4 | HTA11_696_2000001011 | Human | Colorectum | AD | 1.27e-25 | 8.55e-01 | -0.1464 |
| 3487 | IGFBP4 | HTA11_866_2000001011 | Human | Colorectum | AD | 3.21e-12 | 5.94e-01 | -0.1001 |
| 3487 | IGFBP4 | HTA11_1391_2000001011 | Human | Colorectum | AD | 5.81e-17 | 6.82e-01 | -0.059 |
| 3487 | IGFBP4 | HTA11_2992_2000001011 | Human | Colorectum | SER | 1.63e-06 | 7.79e-01 | -0.1706 |
| 3487 | IGFBP4 | HTA11_5212_2000001011 | Human | Colorectum | AD | 2.12e-04 | 6.30e-01 | -0.2061 |
| 3487 | IGFBP4 | HTA11_5216_2000001011 | Human | Colorectum | SER | 7.77e-08 | 7.12e-01 | -0.1462 |
| 3487 | IGFBP4 | HTA11_546_2000001011 | Human | Colorectum | AD | 1.56e-15 | 8.64e-01 | -0.0842 |
| 3487 | IGFBP4 | HTA11_7862_2000001011 | Human | Colorectum | AD | 2.70e-03 | 4.51e-01 | -0.0179 |
| 3487 | IGFBP4 | HTA11_866_3004761011 | Human | Colorectum | AD | 1.35e-10 | 4.90e-01 | 0.096 |
| 3487 | IGFBP4 | HTA11_9408_2000001011 | Human | Colorectum | AD | 7.96e-04 | 6.57e-01 | 0.0451 |
| 3487 | IGFBP4 | HTA11_8622_2000001021 | Human | Colorectum | SER | 1.27e-05 | 4.63e-01 | 0.0528 |
| 3487 | IGFBP4 | HTA11_7663_2000001011 | Human | Colorectum | SER | 7.10e-08 | 8.84e-01 | 0.0131 |
| Page: 1 2 3 4 5 6 7 8 9 10 11 |
| Tissue | Expression Dynamics | Abbreviation |
| Colorectum (GSE201348) | 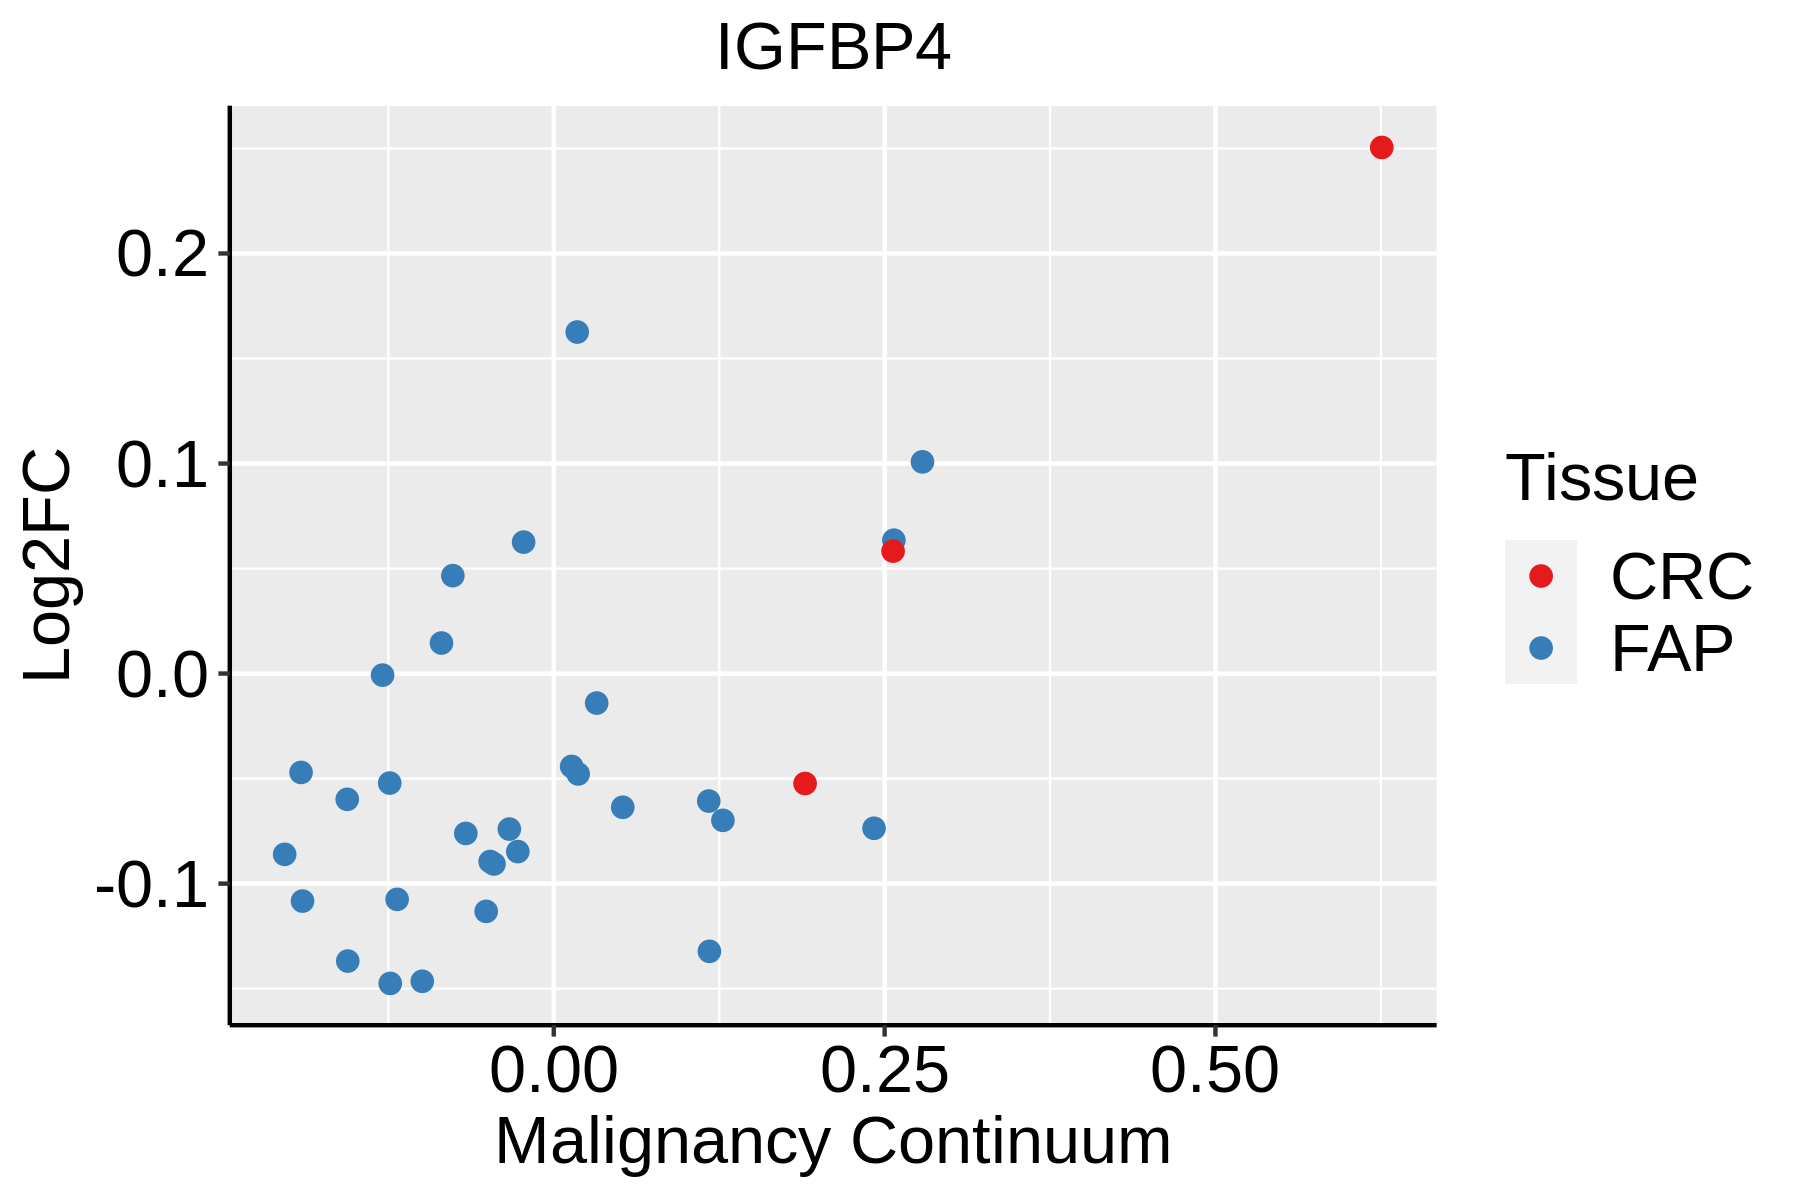 | FAP: Familial adenomatous polyposis |
| CRC: Colorectal cancer | ||
| Colorectum (HTA11) |  | AD: Adenomas |
| SER: Sessile serrated lesions | ||
| MSI-H: Microsatellite-high colorectal cancer | ||
| MSS: Microsatellite stable colorectal cancer | ||
| Endometrium |  | AEH: Atypical endometrial hyperplasia |
| EEC: Endometrioid Cancer | ||
| Esophagus | 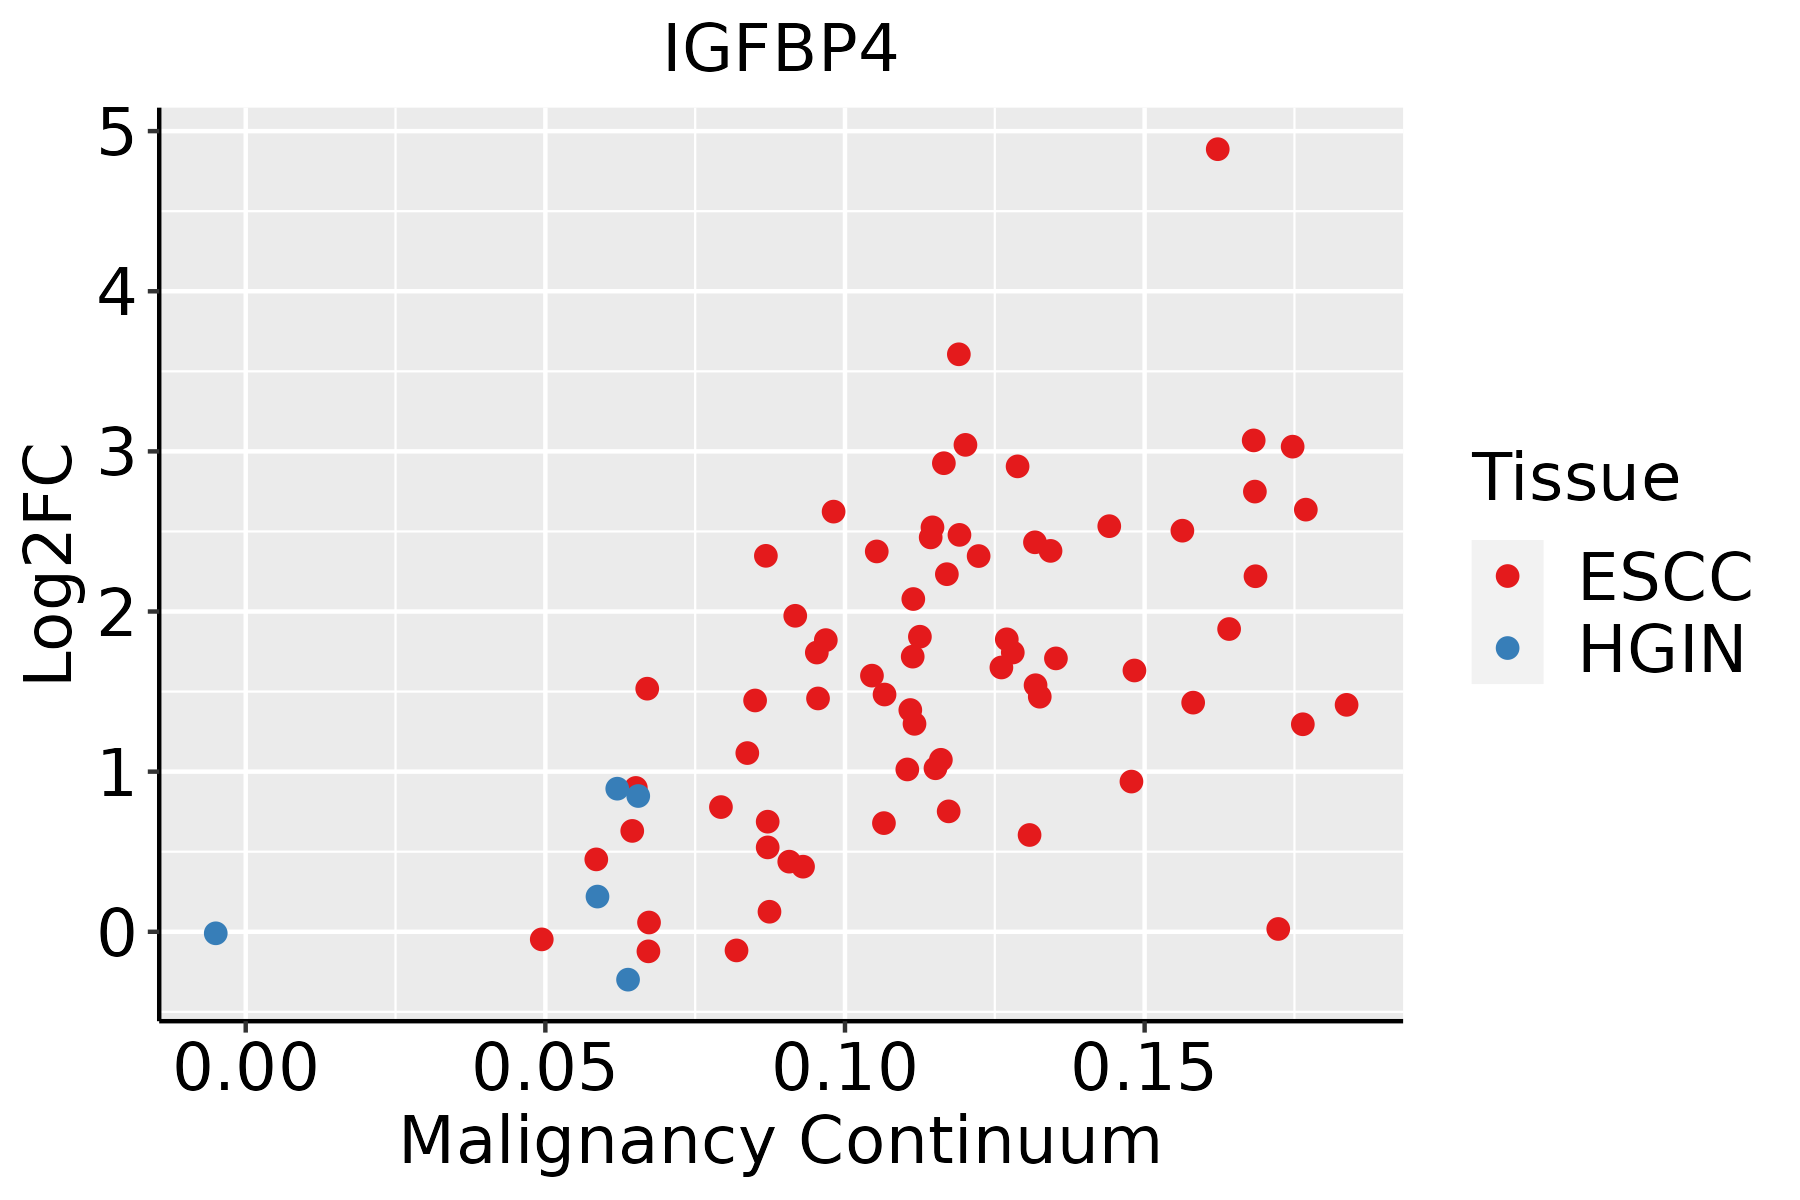 | ESCC: Esophageal squamous cell carcinoma |
| HGIN: High-grade intraepithelial neoplasias | ||
| LGIN: Low-grade intraepithelial neoplasias | ||
| Liver | 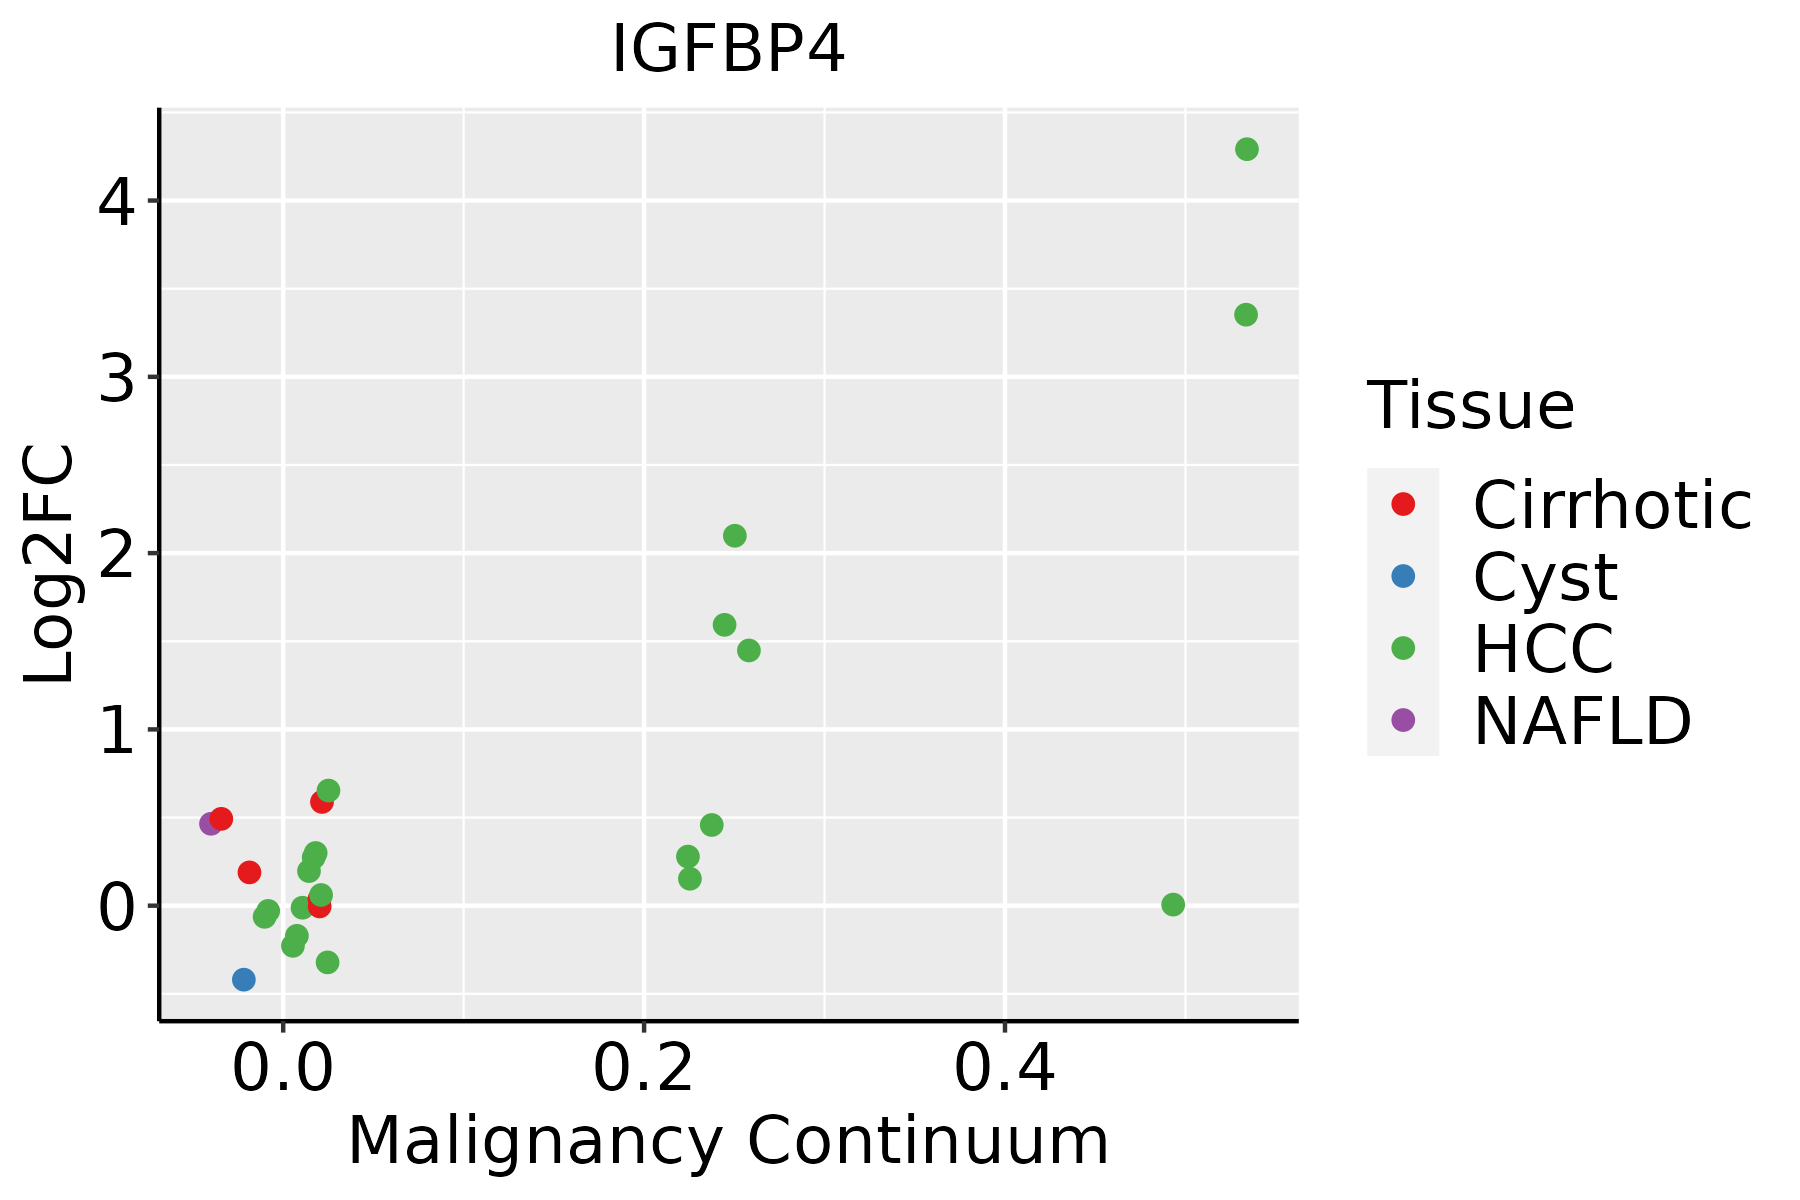 | HCC: Hepatocellular carcinoma |
| NAFLD: Non-alcoholic fatty liver disease | ||
| Lung | 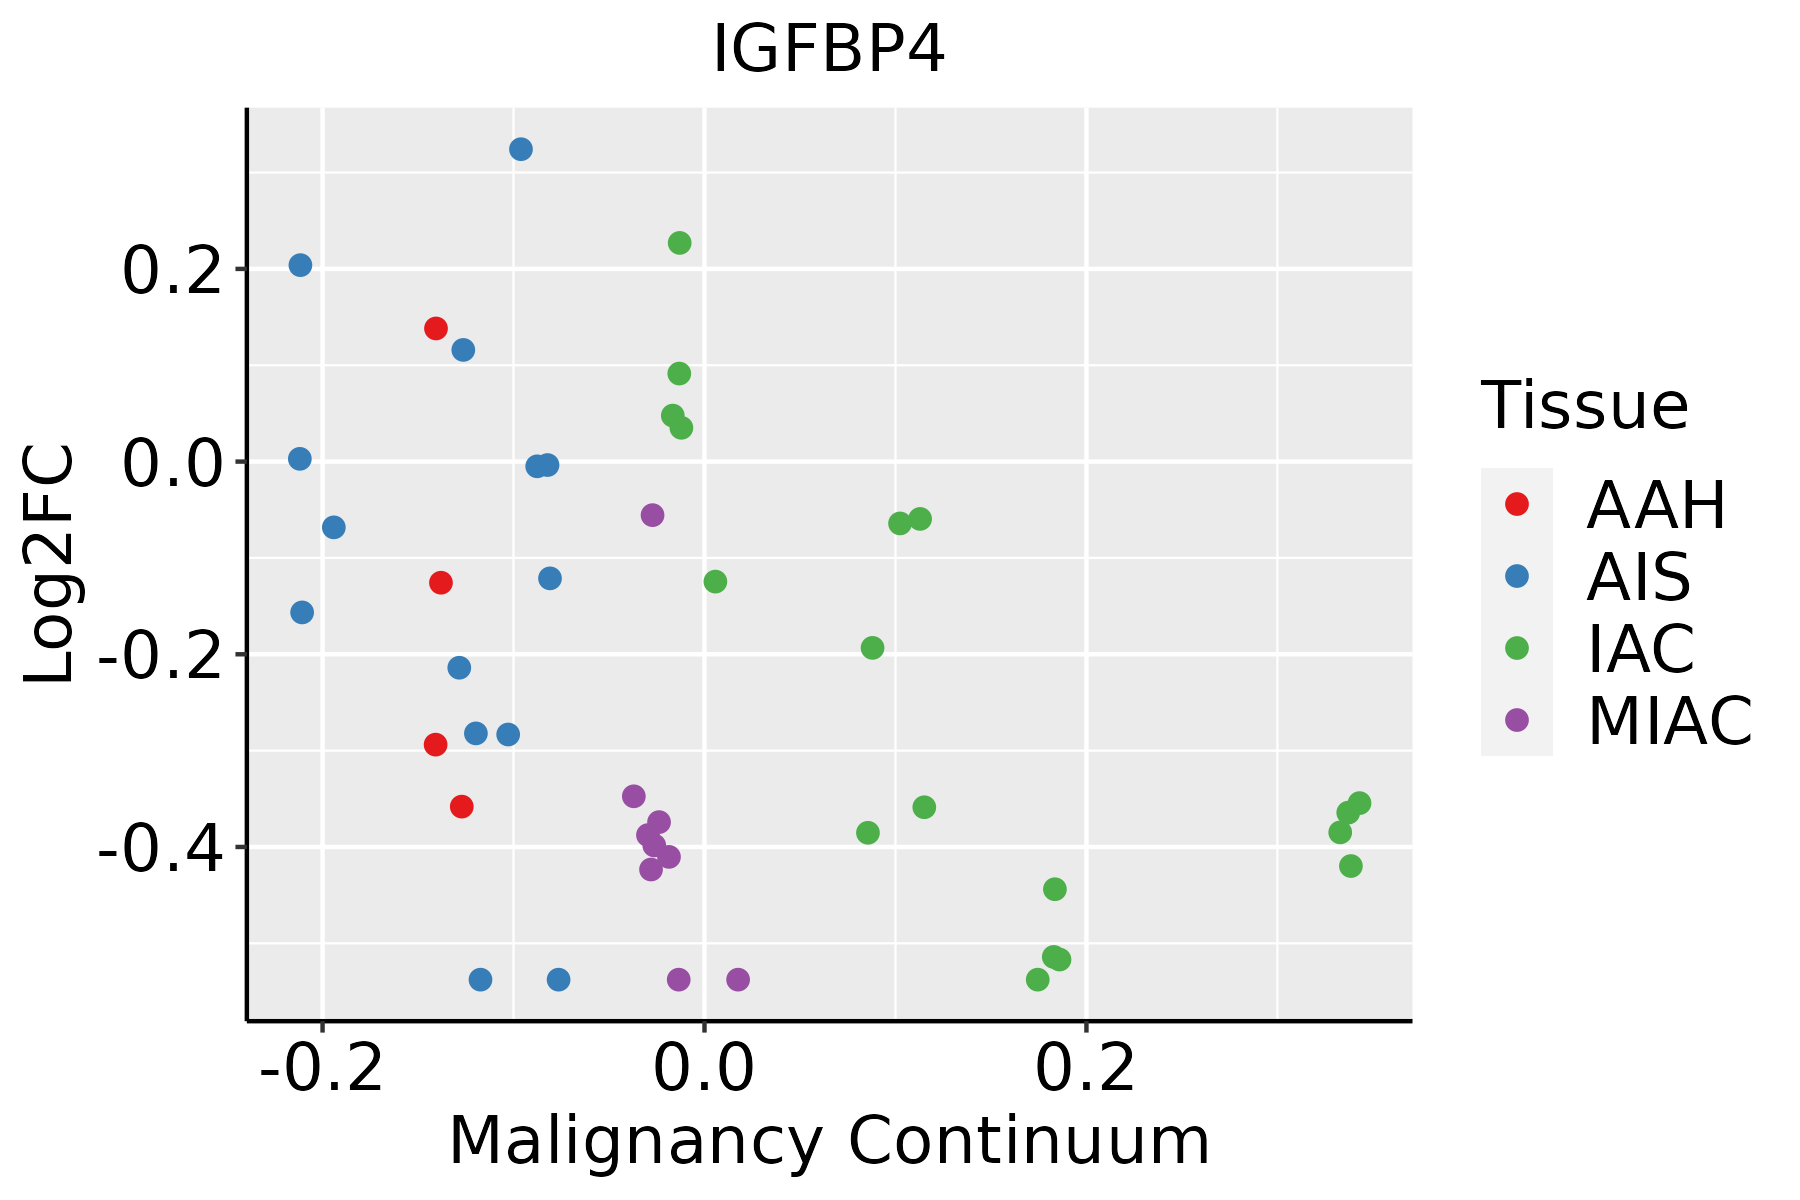 | AAH: Atypical adenomatous hyperplasia |
| AIS: Adenocarcinoma in situ | ||
| IAC: Invasive lung adenocarcinoma | ||
| MIA: Minimally invasive adenocarcinoma | ||
| Oral Cavity |  | EOLP: Erosive Oral lichen planus |
| LP: leukoplakia | ||
| NEOLP: Non-erosive oral lichen planus | ||
| OSCC: Oral squamous cell carcinoma | ||
| Prostate | 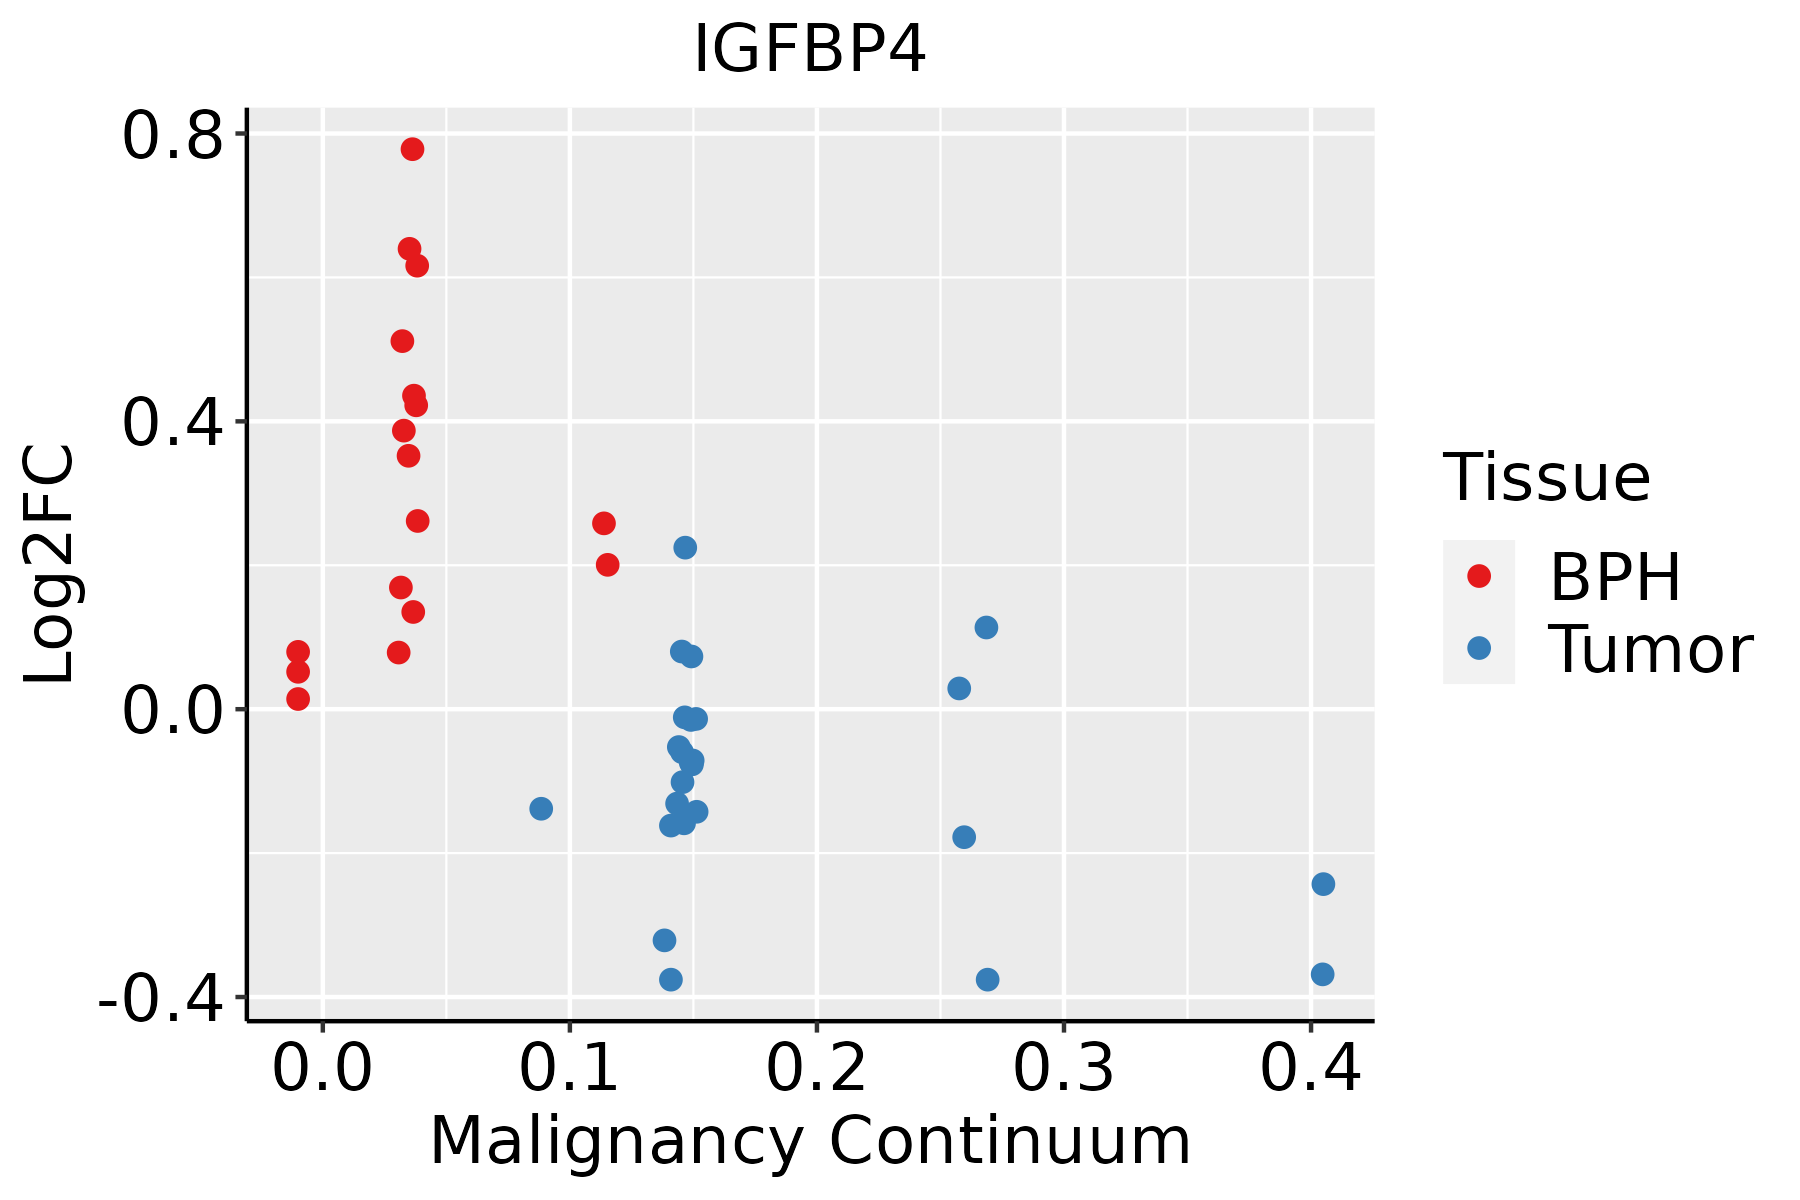 | BPH: Benign Prostatic Hyperplasia |
| Skin |  | AK: Actinic keratosis |
| cSCC: Cutaneous squamous cell carcinoma | ||
| SCCIS:squamous cell carcinoma in situ | ||
| Thyroid | 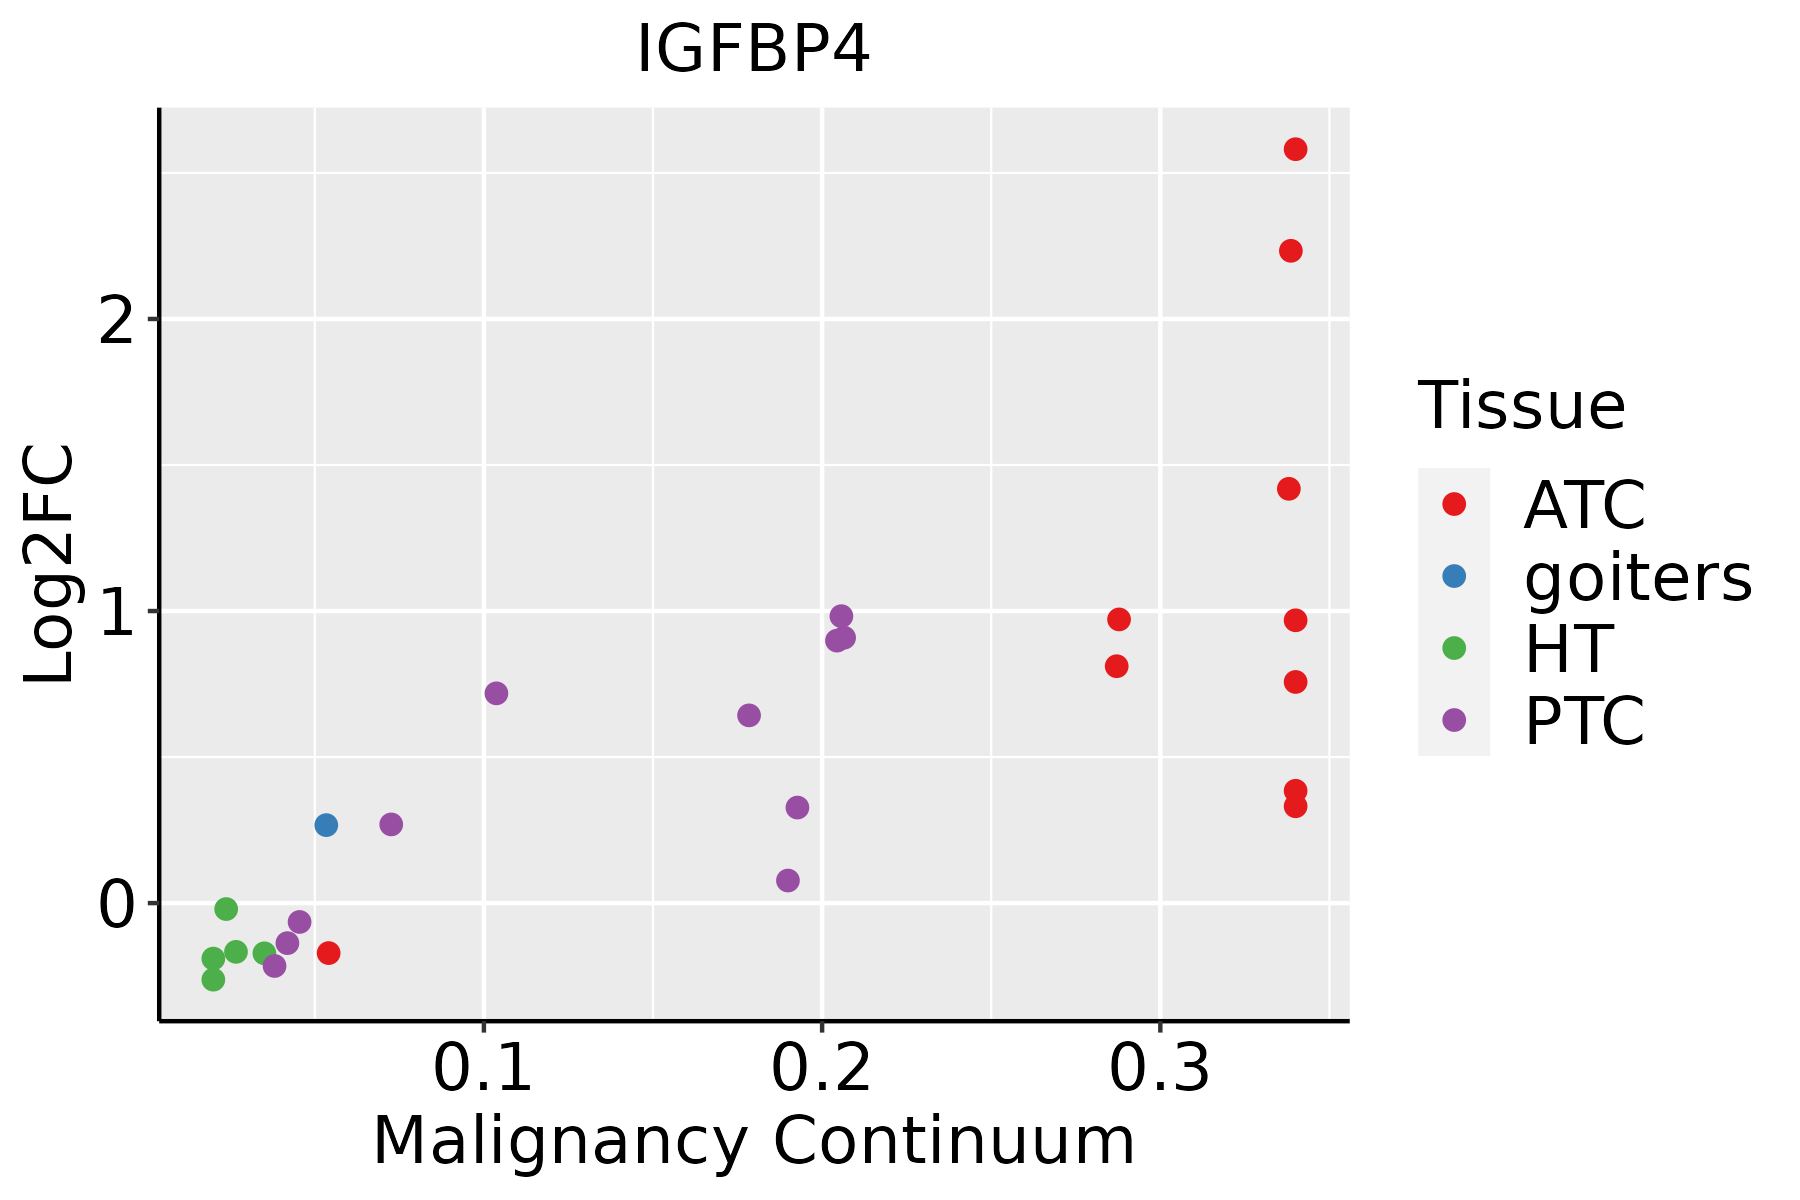 | ATC: Anaplastic thyroid cancer |
| HT: Hashimoto's thyroiditis | ||
| PTC: Papillary thyroid cancer |
| ∗log2FC in expression of this searched gene in stem-like cells from each diseased tissue sample relative to stem-like cells in normal samples in each tissue plotted against the malignancy continuum. Samples are colored based on if they are from different disease stage. |
Top |
Malignant transformation related pathway analysis |
| Find out the enriched GO biological processes and KEGG pathways involved in transition from healthy to precancer to cancer |
| Tissue | Disease Stage | Enriched GO biological Processes |
| Colorectum | AD |  |
| Colorectum | SER |  |
| Colorectum | MSS |  |
| Colorectum | MSI-H |  |
| Colorectum | FAP |  |
| ∗Top 15 enriched GO BP terms are showed in the bar plot of each disease state in each tissue. Each row represents a significant GO biological process which is colored according to the -log10(p.adjust). |
| Page: 1 2 3 4 5 6 7 8 9 |
| GO ID | Tissue | Disease Stage | Description | Gene Ratio | Bg Ratio | pvalue | p.adjust | Count |
| GO:00443423 | Esophagus | ESCC | type B pancreatic cell proliferation | 15/8552 | 21/18723 | 1.54e-02 | 4.96e-02 | 15 |
| GO:00160495 | Liver | NAFLD | cell growth | 85/1882 | 482/18723 | 1.75e-07 | 1.25e-05 | 85 |
| GO:00059965 | Liver | NAFLD | monosaccharide metabolic process | 53/1882 | 257/18723 | 2.89e-07 | 1.92e-05 | 53 |
| GO:00620125 | Liver | NAFLD | regulation of small molecule metabolic process | 63/1882 | 334/18723 | 6.55e-07 | 3.79e-05 | 63 |
| GO:00193185 | Liver | NAFLD | hexose metabolic process | 49/1882 | 237/18723 | 7.41e-07 | 4.12e-05 | 49 |
| GO:00442623 | Liver | NAFLD | cellular carbohydrate metabolic process | 55/1882 | 283/18723 | 1.27e-06 | 6.01e-05 | 55 |
| GO:00060065 | Liver | NAFLD | glucose metabolic process | 42/1882 | 196/18723 | 1.70e-06 | 7.47e-05 | 42 |
| GO:00061093 | Liver | NAFLD | regulation of carbohydrate metabolic process | 38/1882 | 178/18723 | 5.71e-06 | 2.04e-04 | 38 |
| GO:00160555 | Liver | NAFLD | Wnt signaling pathway | 74/1882 | 444/18723 | 8.98e-06 | 2.96e-04 | 74 |
| GO:01987385 | Liver | NAFLD | cell-cell signaling by wnt | 74/1882 | 446/18723 | 1.05e-05 | 3.33e-04 | 74 |
| GO:00301115 | Liver | NAFLD | regulation of Wnt signaling pathway | 57/1882 | 328/18723 | 2.79e-05 | 7.46e-04 | 57 |
| GO:00106753 | Liver | NAFLD | regulation of cellular carbohydrate metabolic process | 31/1882 | 146/18723 | 4.47e-05 | 1.08e-03 | 31 |
| GO:00109063 | Liver | NAFLD | regulation of glucose metabolic process | 26/1882 | 119/18723 | 1.09e-04 | 2.13e-03 | 26 |
| GO:00608285 | Liver | NAFLD | regulation of canonical Wnt signaling pathway | 44/1882 | 253/18723 | 2.14e-04 | 3.68e-03 | 44 |
| GO:00600705 | Liver | NAFLD | canonical Wnt signaling pathway | 50/1882 | 303/18723 | 3.08e-04 | 4.83e-03 | 50 |
| GO:00015585 | Liver | NAFLD | regulation of cell growth | 63/1882 | 414/18723 | 5.50e-04 | 7.46e-03 | 63 |
| GO:00480091 | Liver | NAFLD | insulin-like growth factor receptor signaling pathway | 10/1882 | 37/18723 | 2.82e-03 | 2.56e-02 | 10 |
| GO:000599612 | Liver | Cirrhotic | monosaccharide metabolic process | 104/4634 | 257/18723 | 1.74e-08 | 6.32e-07 | 104 |
| GO:001931812 | Liver | Cirrhotic | hexose metabolic process | 97/4634 | 237/18723 | 2.67e-08 | 9.16e-07 | 97 |
| GO:000600611 | Liver | Cirrhotic | glucose metabolic process | 82/4634 | 196/18723 | 1.01e-07 | 2.93e-06 | 82 |
| Page: 1 2 3 4 5 6 7 8 9 10 11 12 13 14 15 16 17 |
| Pathway ID | Tissue | Disease Stage | Description | Gene Ratio | Bg Ratio | pvalue | p.adjust | qvalue | Count |
| Page: 1 |
Top |
Cell-cell communication analysis |
| Identification of potential cell-cell interactions between two cell types and their ligand-receptor pairs for different disease states |
| Ligand | Receptor | LRpair | Pathway | Tissue | Disease Stage |
| Page: 1 |
Top |
Single-cell gene regulatory network inference analysis |
| Find out the significant the regulons (TFs) and the target genes of each regulon across cell types for different disease states |
| TF | Cell Type | Tissue | Disease Stage | Target Gene | RSS | Regulon Activity |
| ∗The dot plots of a searched regulon are shown for all cell subpopulations in each disease state of each tissue based on the regulon specific score inferred using pySCENIC and by calculating the average expression. |
| Page: 1 |
Top |
Somatic mutation of malignant transformation related genes |
| Annotation of somatic variants for genes involved in malignant transformation |
| Hugo Symbol | Variant Class | Variant Classification | dbSNP RS | HGVSc | HGVSp | HGVSp Short | SWISSPROT | BIOTYPE | SIFT | PolyPhen | Tumor Sample Barcode | Tissue | Histology | Sex | Age | Stage | Therapy Types | Drugs | Outcome |
| IGFBP4 | SNV | Missense_Mutation | c.529N>A | p.Glu177Lys | p.E177K | P22692 | protein_coding | deleterious(0.01) | probably_damaging(0.978) | TCGA-D8-A27W-01 | Breast | breast invasive carcinoma | Female | <65 | III/IV | Chemotherapy | doxorubicine+cyclophosphamide | SD | |
| IGFBP4 | insertion | Nonsense_Mutation | novel | c.382_383insAAGCCGAAGAA | p.Phe128Ter | p.F128* | P22692 | protein_coding | TCGA-A8-A07J-01 | Breast | breast invasive carcinoma | Female | <65 | I/II | Chemotherapy | 5-fluorouracil | CR | ||
| IGFBP4 | insertion | In_Frame_Ins | novel | c.383_384insCCC | p.Phe128_Ser129insPro | p.F128_S129insP | P22692 | protein_coding | TCGA-A8-A07J-01 | Breast | breast invasive carcinoma | Female | <65 | I/II | Chemotherapy | 5-fluorouracil | CR | ||
| IGFBP4 | SNV | Missense_Mutation | rs745961147 | c.482C>T | p.Ala161Val | p.A161V | P22692 | protein_coding | tolerated(0.52) | benign(0) | TCGA-A6-6780-01 | Colorectum | colon adenocarcinoma | Male | >=65 | I/II | Unknown | Unknown | SD |
| IGFBP4 | SNV | Missense_Mutation | c.617G>A | p.Arg206His | p.R206H | P22692 | protein_coding | tolerated(0.1) | probably_damaging(0.963) | TCGA-AA-3833-01 | Colorectum | colon adenocarcinoma | Female | <65 | I/II | Unknown | Unknown | SD | |
| IGFBP4 | SNV | Missense_Mutation | novel | c.740T>G | p.Leu247Arg | p.L247R | P22692 | protein_coding | tolerated(0.05) | probably_damaging(0.992) | TCGA-AU-6004-01 | Colorectum | colon adenocarcinoma | Female | >=65 | I/II | Unknown | Unknown | SD |
| IGFBP4 | SNV | Missense_Mutation | c.673A>G | p.Lys225Glu | p.K225E | P22692 | protein_coding | tolerated(0.1) | probably_damaging(0.998) | TCGA-CK-4951-01 | Colorectum | colon adenocarcinoma | Female | >=65 | I/II | Unknown | Unknown | PD | |
| IGFBP4 | deletion | Frame_Shift_Del | rs778799414 | c.123delC | p.Val42TrpfsTer52 | p.V42Wfs*52 | P22692 | protein_coding | TCGA-A6-6780-01 | Colorectum | colon adenocarcinoma | Male | >=65 | I/II | Unknown | Unknown | SD | ||
| IGFBP4 | deletion | Frame_Shift_Del | rs778799414 | c.117delN | p.Val42TrpfsTer52 | p.V42Wfs*52 | P22692 | protein_coding | TCGA-NH-A5IV-01 | Colorectum | colon adenocarcinoma | Female | >=65 | I/II | Unknown | Unknown | SD | ||
| IGFBP4 | SNV | Missense_Mutation | rs755831062 | c.430N>A | p.Ala144Thr | p.A144T | P22692 | protein_coding | tolerated(0.18) | benign(0.129) | TCGA-A5-A1OF-01 | Endometrium | uterine corpus endometrioid carcinoma | Female | <65 | I/II | Unknown | Unknown | SD |
| Page: 1 2 3 |
Top |
Related drugs of malignant transformation related genes |
| Identification of chemicals and drugs interact with genes involved in malignant transfromation |
| (DGIdb 4.0) |
| Entrez ID | Symbol | Category | Interaction Types | Drug Claim Name | Drug Name | PMIDs |
| 3487 | IGFBP4 | DRUGGABLE GENOME | PMSG | 9258879 |
| Page: 1 |

Copyright 2023-Present -The University of Texas Health Science Center at Houston |