
|
|||||
|
 | |
| |
| |
| |
| |
| |
|
Gene: HNRNPK |
Gene summary for HNRNPK |
| Gene information | Species | Human | Gene symbol | HNRNPK | Gene ID | 3190 |
| Gene name | heterogeneous nuclear ribonucleoprotein K | |
| Gene Alias | AUKS | |
| Cytomap | 9q21.32 | |
| Gene Type | protein-coding | GO ID | GO:0000375 | UniProtAcc | B4DUQ1 |
Top |
Malignant transformation analysis |
| Identification of the aberrant gene expression in precancerous and cancerous lesions by comparing the gene expression of stem-like cells in diseased tissues with normal stem cells |
| Entrez ID | Symbol | Replicates | Species | Organ | Tissue | Adj P-value | Log2FC | Malignancy |
| 3190 | HNRNPK | GSM4909282 | Human | Breast | IDC | 3.67e-03 | 2.09e-01 | -0.0288 |
| 3190 | HNRNPK | GSM4909286 | Human | Breast | IDC | 5.24e-05 | -1.74e-01 | 0.1081 |
| 3190 | HNRNPK | GSM4909287 | Human | Breast | IDC | 7.23e-03 | 1.05e-01 | 0.2057 |
| 3190 | HNRNPK | GSM4909288 | Human | Breast | IDC | 3.87e-04 | -3.14e-02 | 0.0988 |
| 3190 | HNRNPK | GSM4909294 | Human | Breast | IDC | 7.45e-08 | -1.94e-01 | 0.2022 |
| 3190 | HNRNPK | GSM4909296 | Human | Breast | IDC | 3.61e-17 | -3.26e-01 | 0.1524 |
| 3190 | HNRNPK | GSM4909297 | Human | Breast | IDC | 3.52e-29 | -1.56e-01 | 0.1517 |
| 3190 | HNRNPK | GSM4909309 | Human | Breast | IDC | 8.35e-03 | -3.12e-01 | 0.0483 |
| 3190 | HNRNPK | GSM4909311 | Human | Breast | IDC | 2.30e-51 | -4.77e-01 | 0.1534 |
| 3190 | HNRNPK | GSM4909312 | Human | Breast | IDC | 1.45e-13 | 2.31e-02 | 0.1552 |
| 3190 | HNRNPK | GSM4909313 | Human | Breast | IDC | 3.16e-03 | -1.16e-01 | 0.0391 |
| 3190 | HNRNPK | GSM4909319 | Human | Breast | IDC | 2.33e-69 | -6.84e-01 | 0.1563 |
| 3190 | HNRNPK | GSM4909320 | Human | Breast | IDC | 6.73e-17 | -7.43e-01 | 0.1575 |
| 3190 | HNRNPK | GSM4909321 | Human | Breast | IDC | 2.85e-20 | -2.50e-01 | 0.1559 |
| 3190 | HNRNPK | brca2 | Human | Breast | Precancer | 8.78e-10 | 3.55e-01 | -0.024 |
| 3190 | HNRNPK | brca3 | Human | Breast | Precancer | 2.60e-20 | 4.14e-01 | -0.0263 |
| 3190 | HNRNPK | M1 | Human | Breast | IDC | 6.92e-03 | 2.74e-01 | 0.1577 |
| 3190 | HNRNPK | M2 | Human | Breast | IDC | 6.41e-09 | 2.81e-01 | 0.21 |
| 3190 | HNRNPK | NCCBC14 | Human | Breast | DCIS | 7.55e-17 | -4.39e-02 | 0.2021 |
| 3190 | HNRNPK | NCCBC2 | Human | Breast | DCIS | 9.82e-03 | -1.96e-01 | 0.1554 |
| Page: 1 2 3 4 5 6 7 8 9 10 11 12 13 14 15 16 |
| Tissue | Expression Dynamics | Abbreviation |
| Breast | 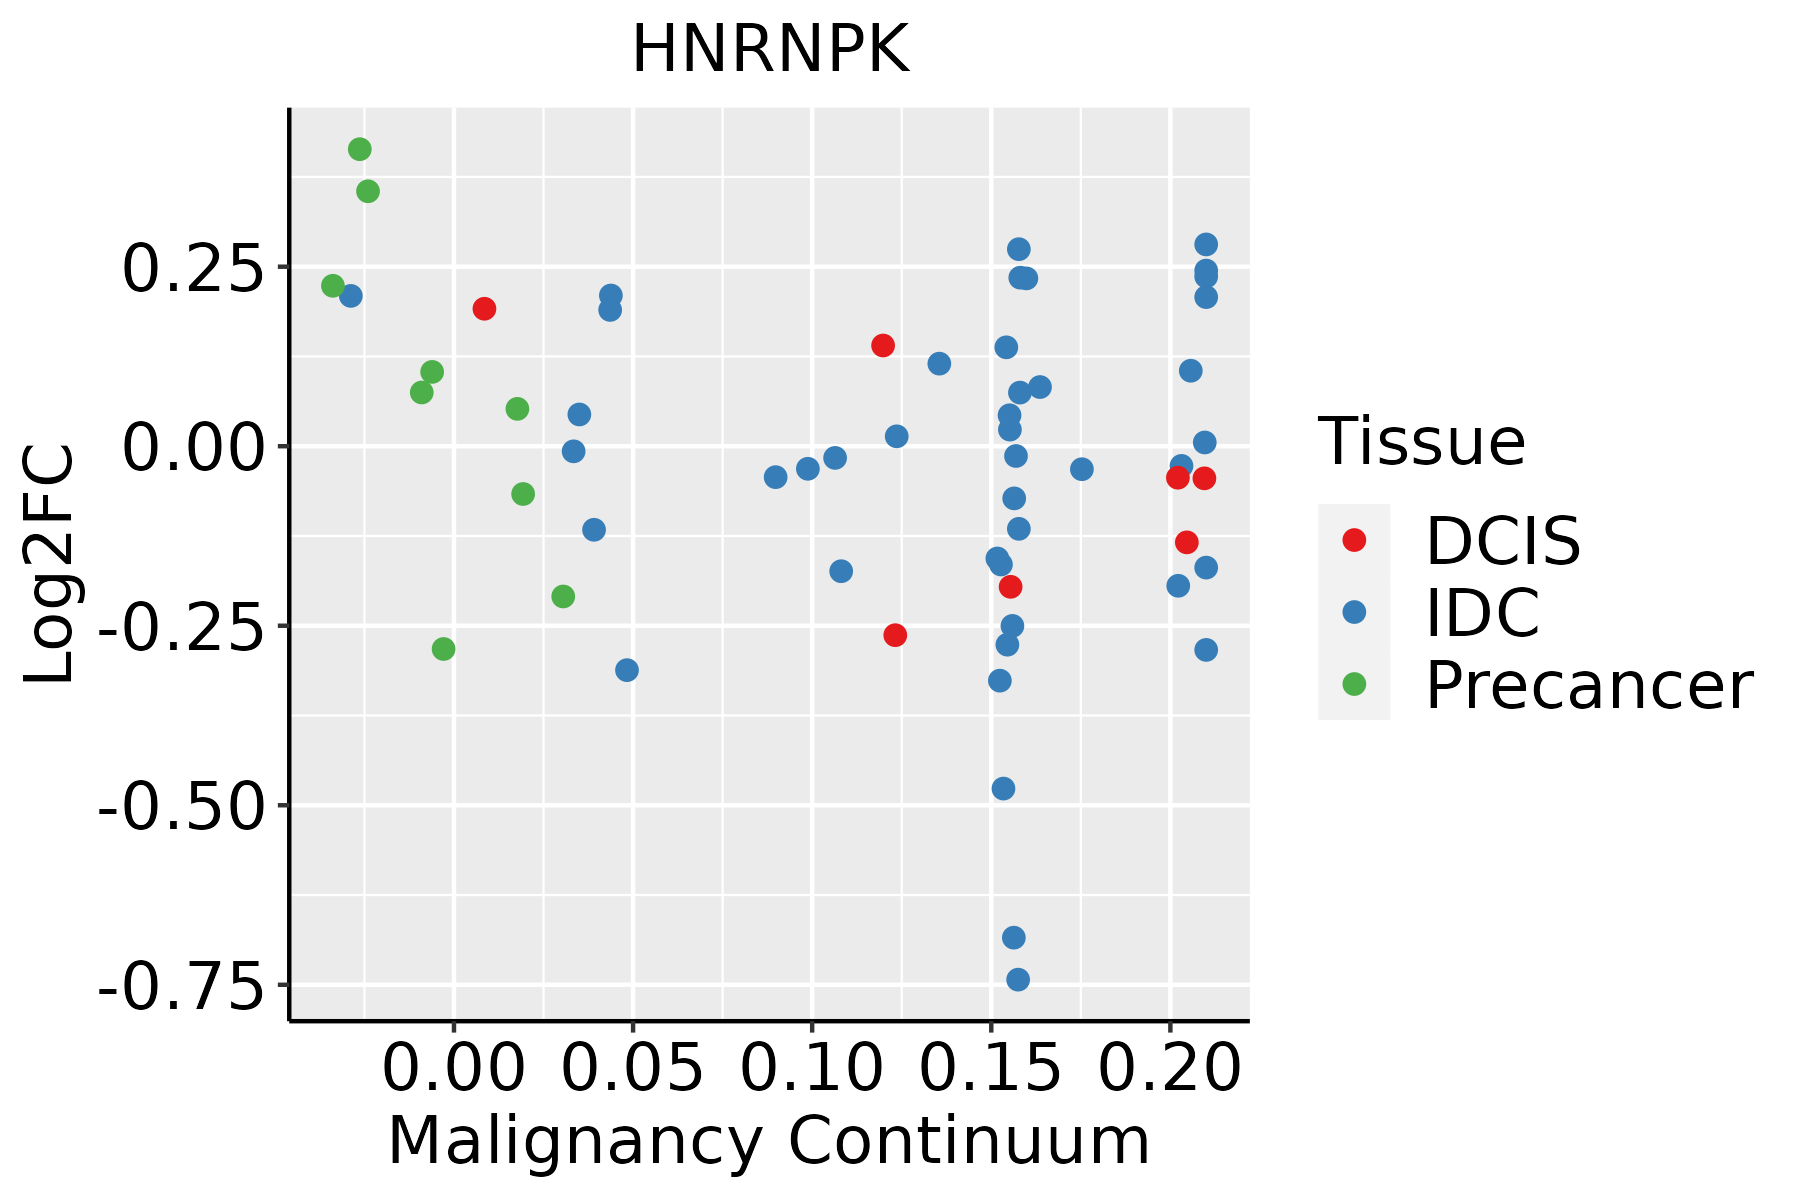 | IDC: Invasive ductal carcinoma |
| DCIS: Ductal carcinoma in situ | ||
| Precancer(BRCA1-mut): Precancerous lesion from BRCA1 mutation carriers | ||
| Cervix | 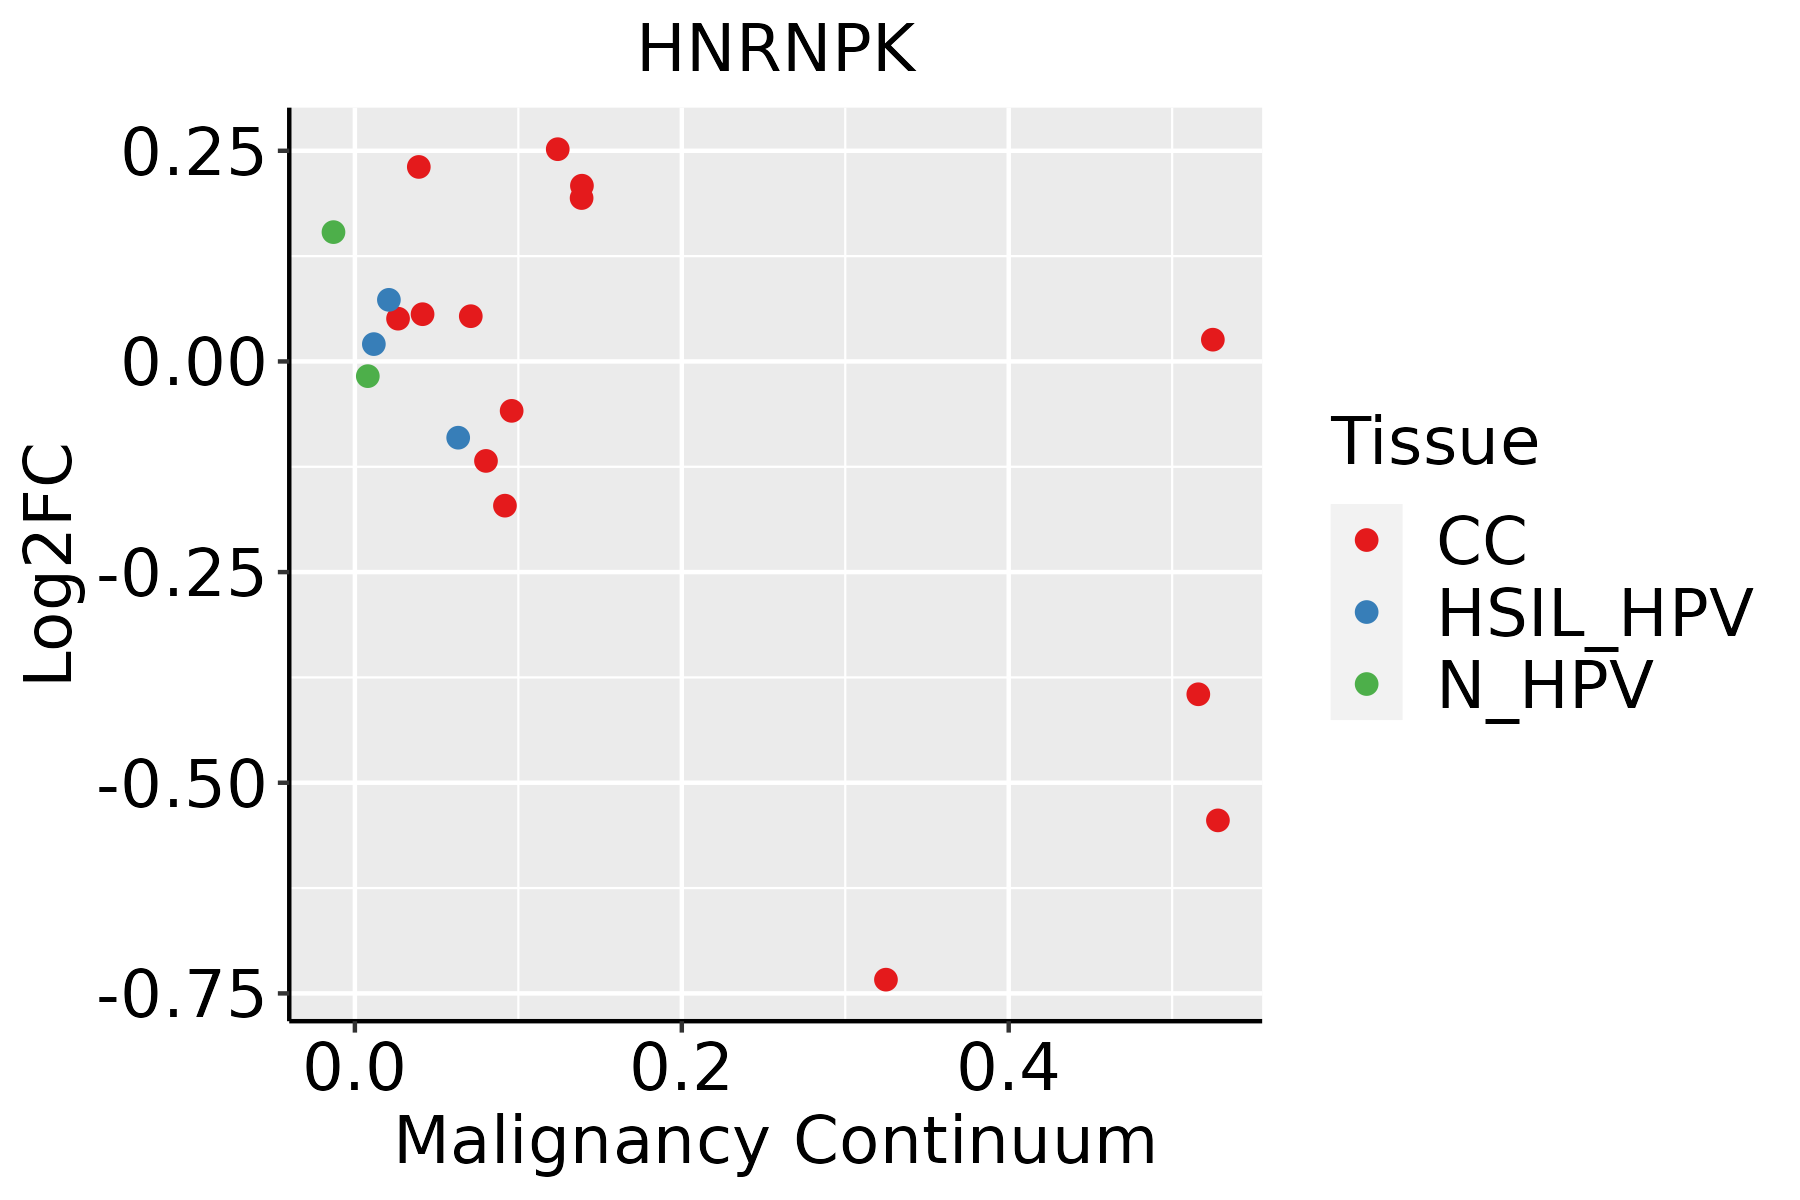 | CC: Cervix cancer |
| HSIL_HPV: HPV-infected high-grade squamous intraepithelial lesions | ||
| N_HPV: HPV-infected normal cervix | ||
| Colorectum (GSE201348) |  | FAP: Familial adenomatous polyposis |
| CRC: Colorectal cancer | ||
| Colorectum (HTA11) |  | AD: Adenomas |
| SER: Sessile serrated lesions | ||
| MSI-H: Microsatellite-high colorectal cancer | ||
| MSS: Microsatellite stable colorectal cancer | ||
| Endometrium | 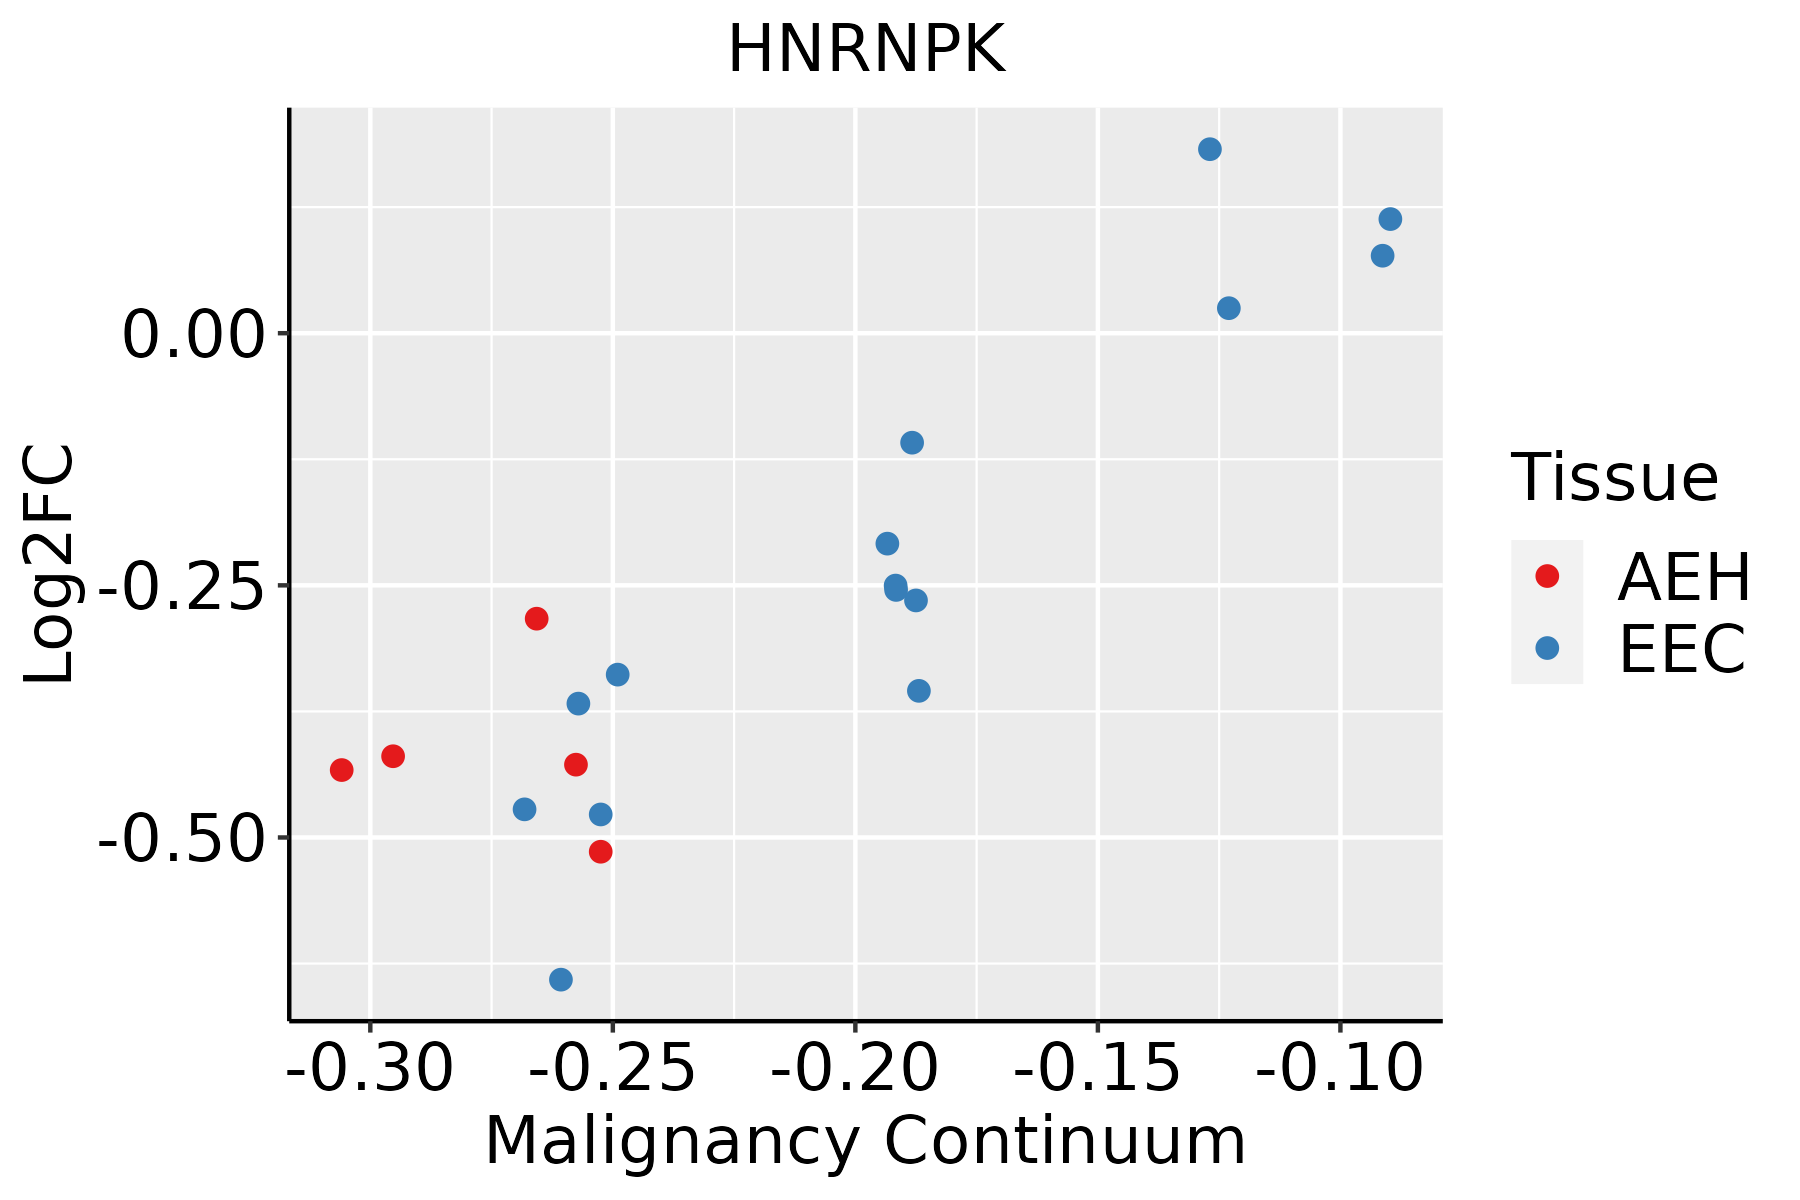 | AEH: Atypical endometrial hyperplasia |
| EEC: Endometrioid Cancer | ||
| Esophagus | 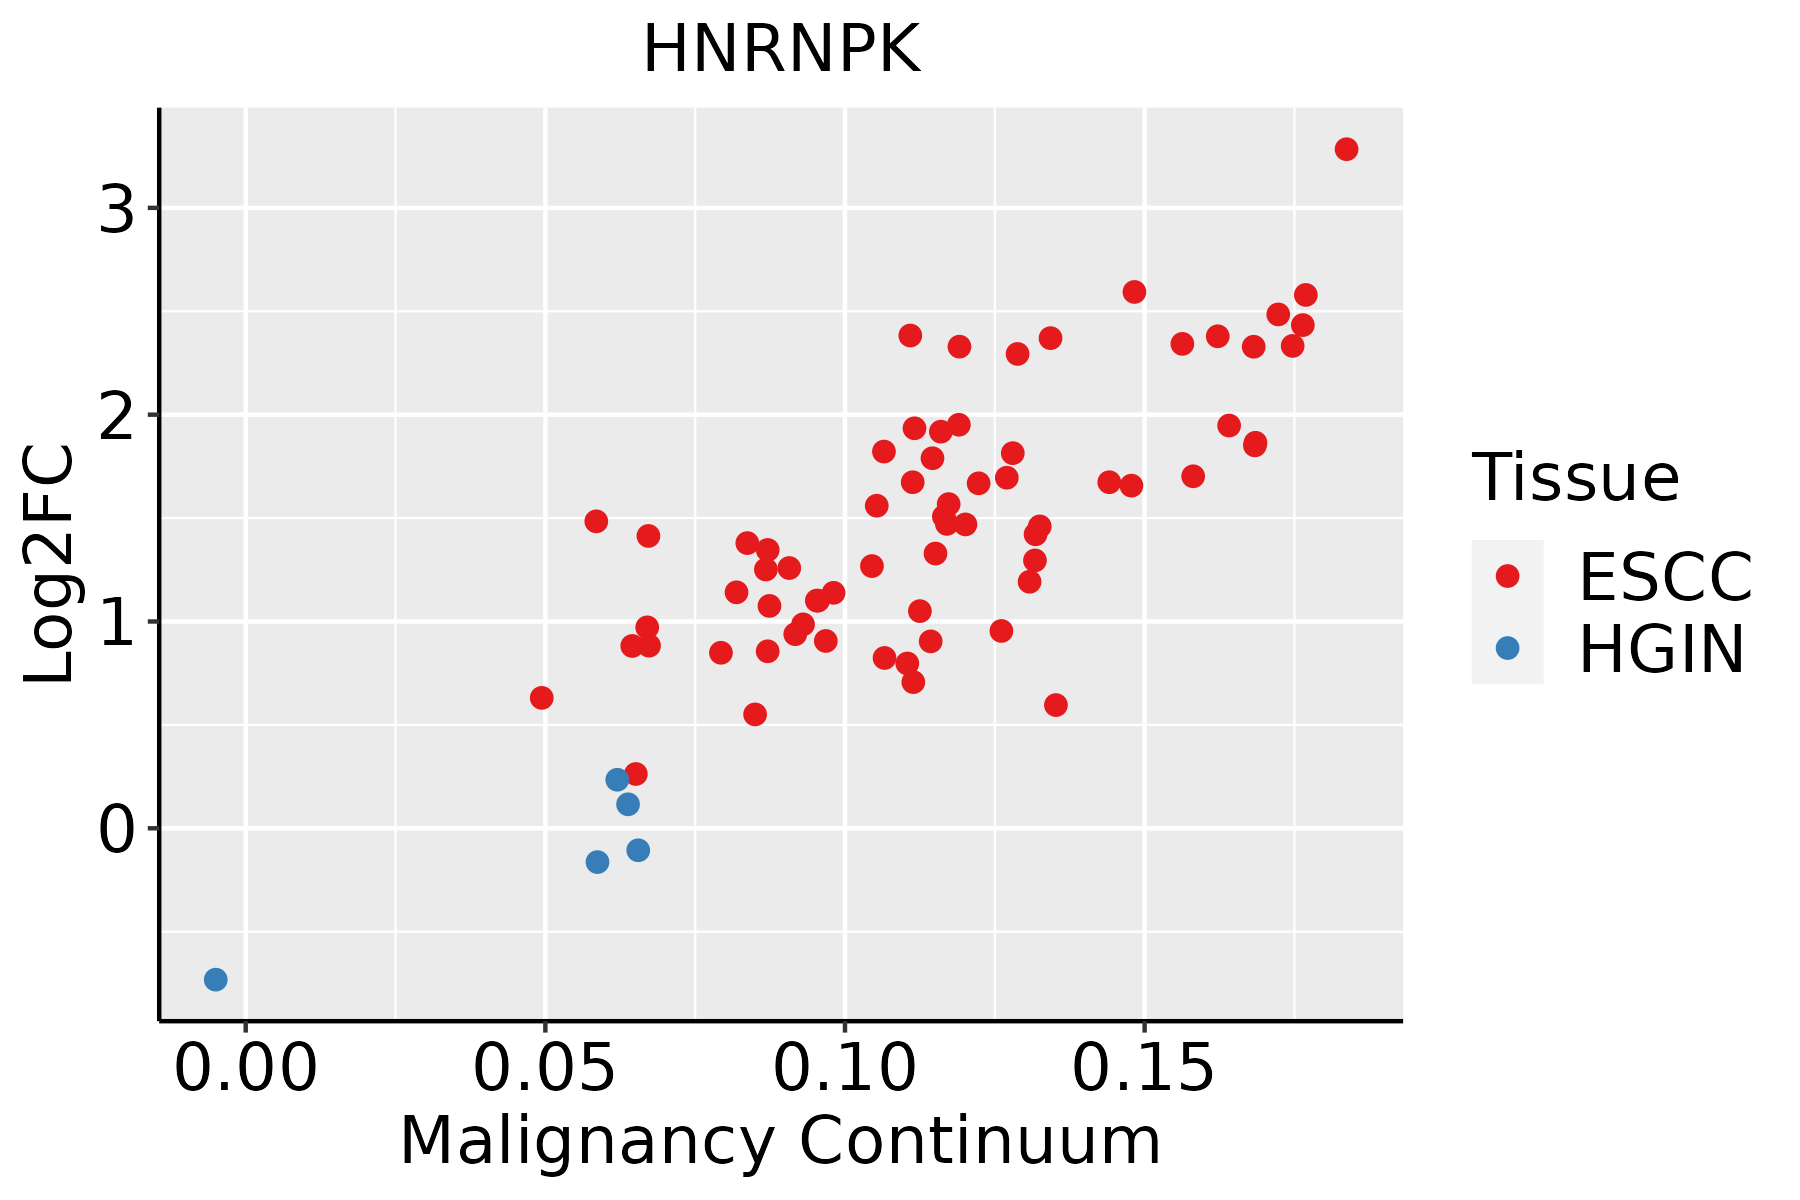 | ESCC: Esophageal squamous cell carcinoma |
| HGIN: High-grade intraepithelial neoplasias | ||
| LGIN: Low-grade intraepithelial neoplasias | ||
| GC | 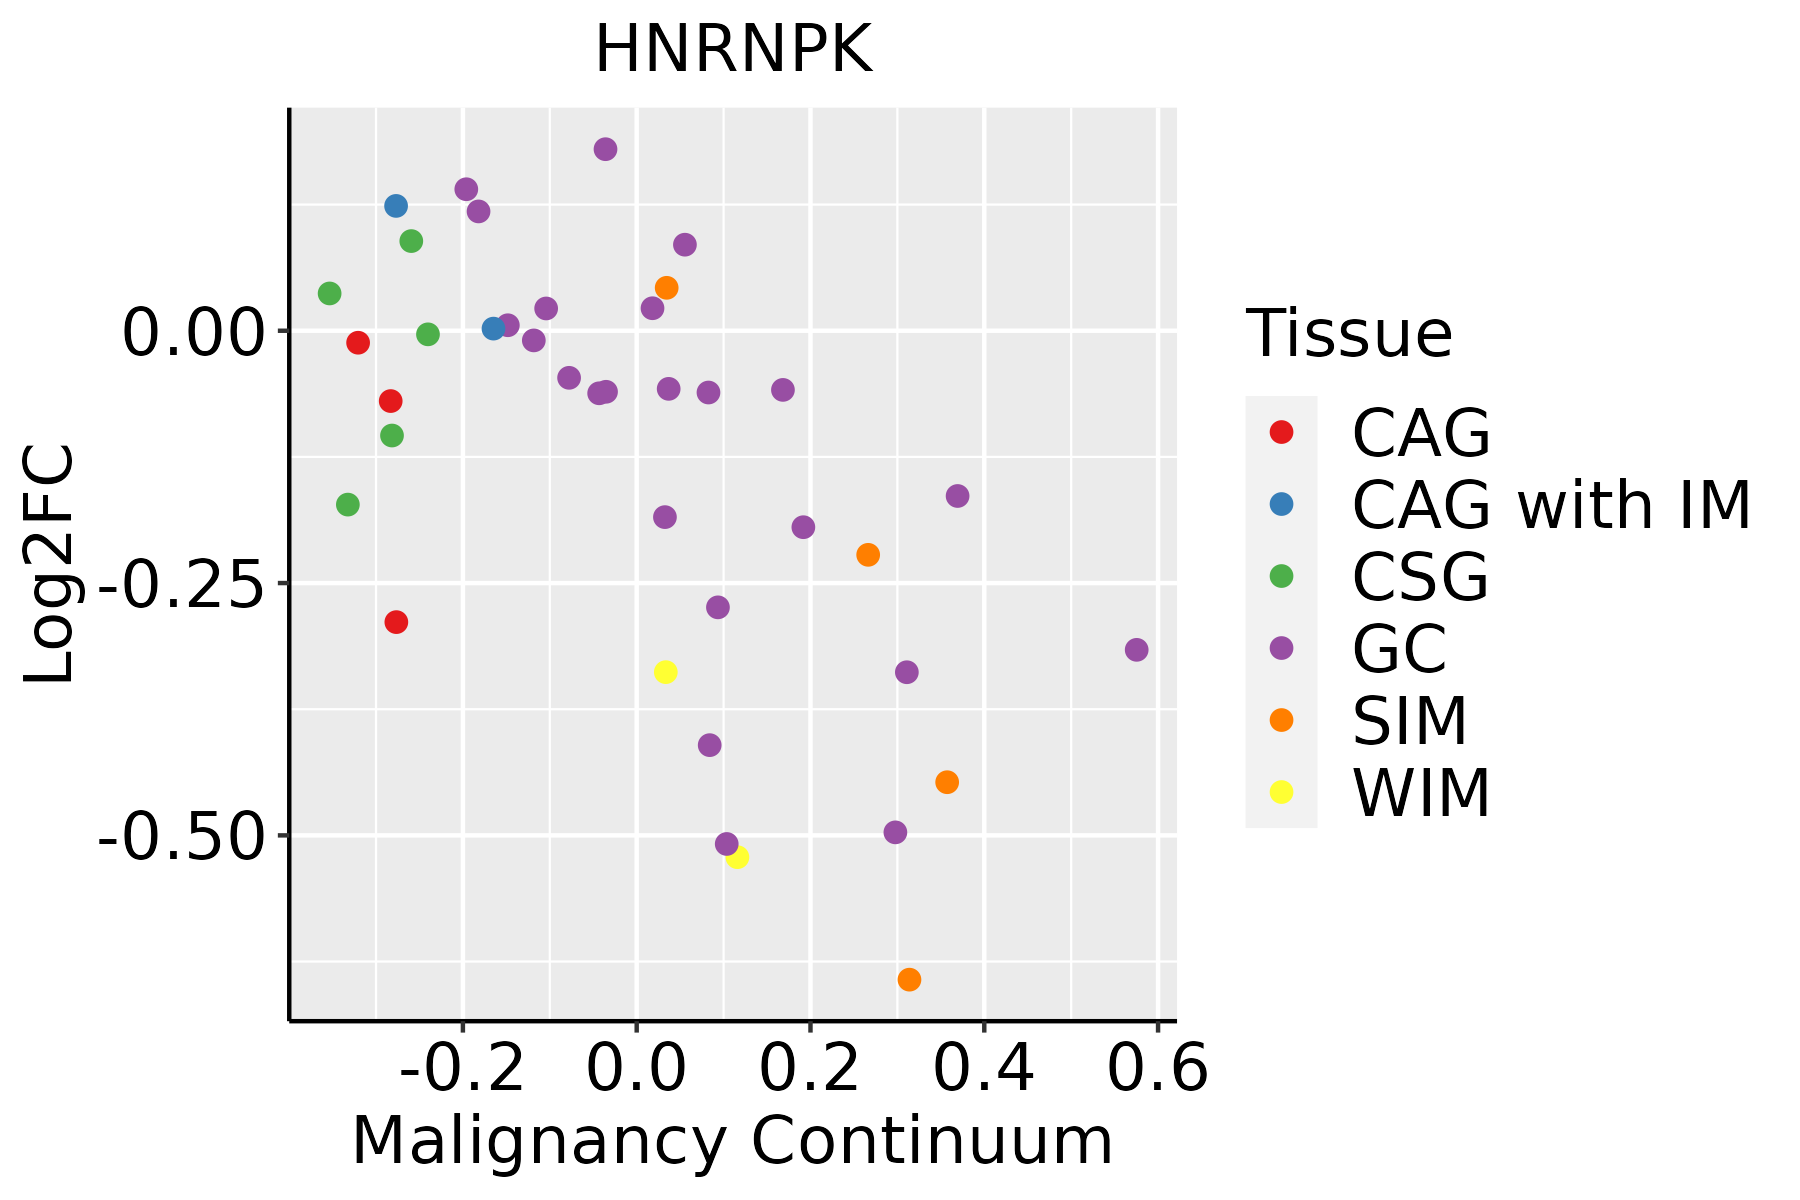 | CAG: Chronic atrophic gastritis |
| CAG with IM: Chronic atrophic gastritis with intestinal metaplasia | ||
| CSG: Chronic superficial gastritis | ||
| GC: Gastric cancer | ||
| SIM: Severe intestinal metaplasia | ||
| WIM: Wild intestinal metaplasia | ||
| Liver | 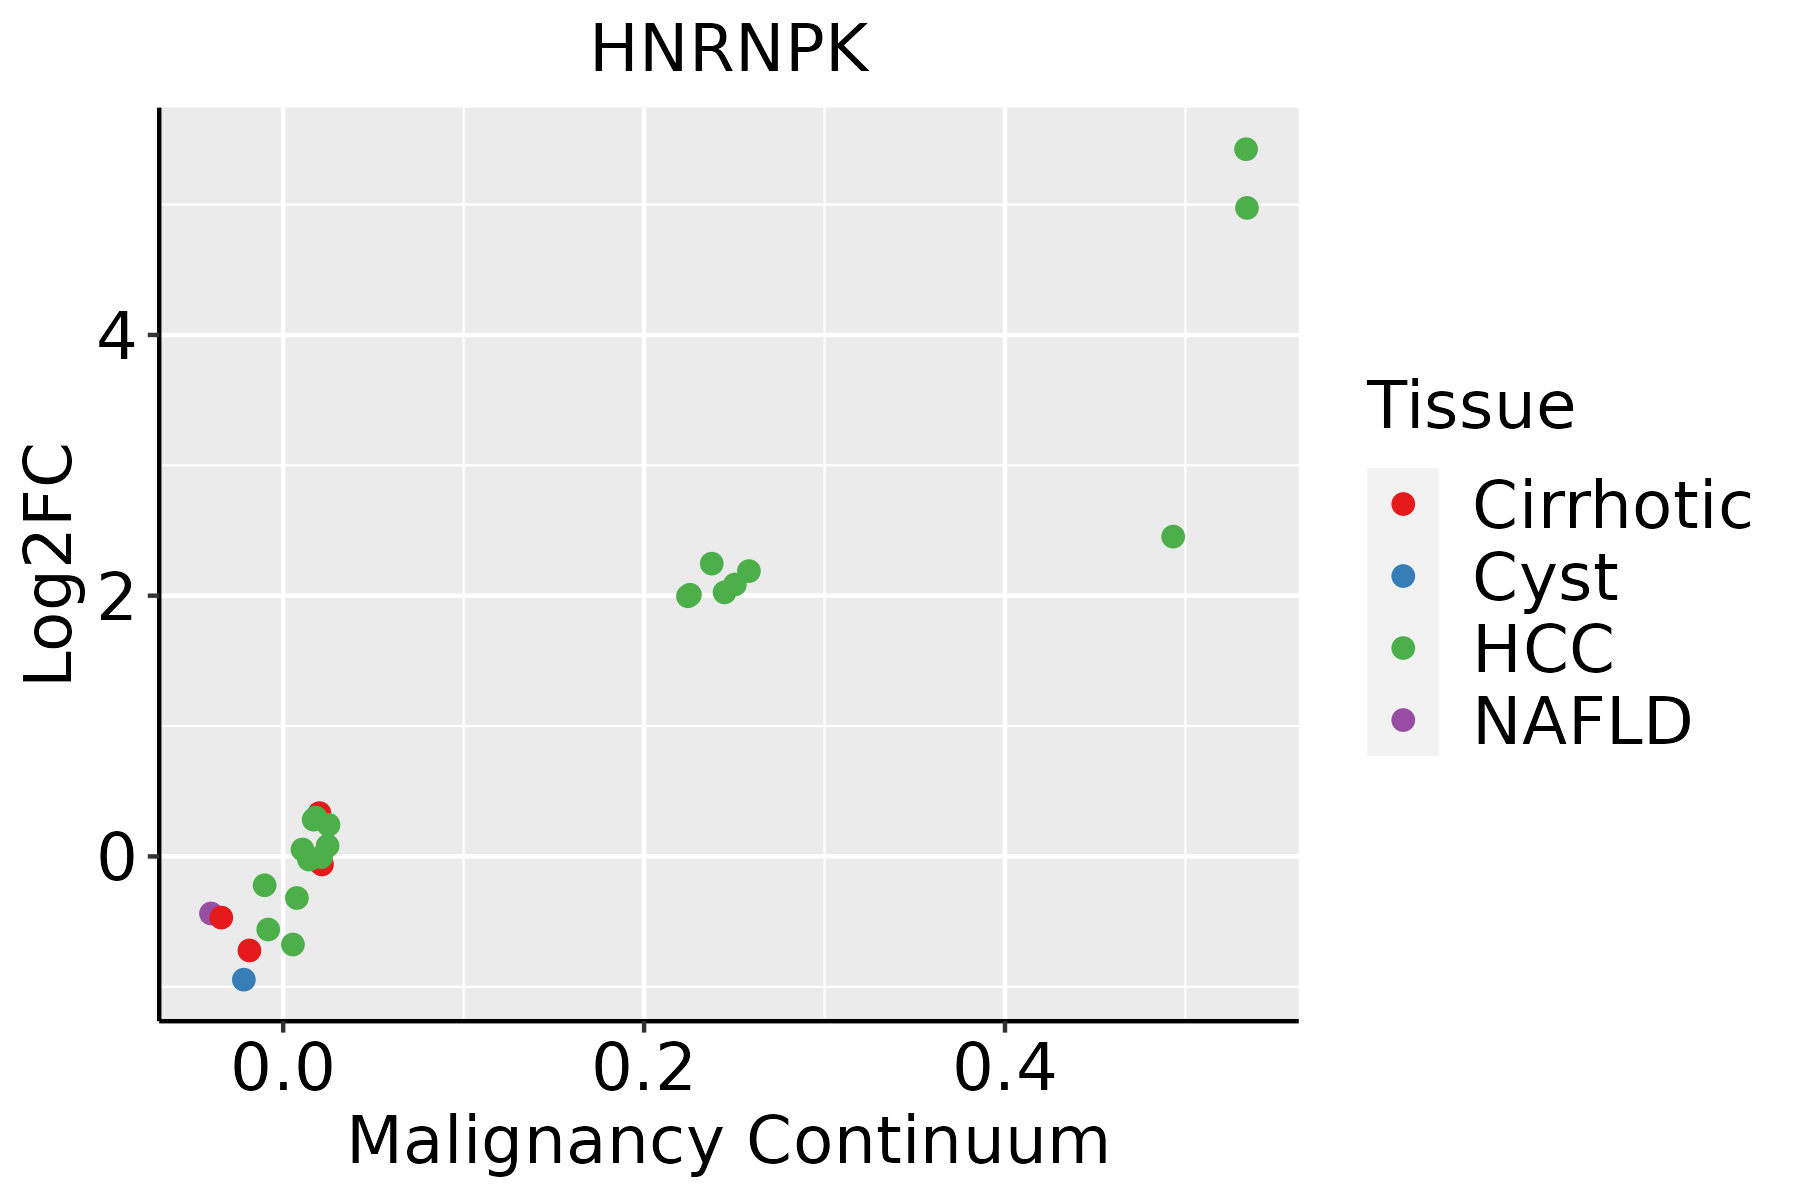 | HCC: Hepatocellular carcinoma |
| NAFLD: Non-alcoholic fatty liver disease | ||
| Lung |  | AAH: Atypical adenomatous hyperplasia |
| AIS: Adenocarcinoma in situ | ||
| IAC: Invasive lung adenocarcinoma | ||
| MIA: Minimally invasive adenocarcinoma | ||
| Oral Cavity | 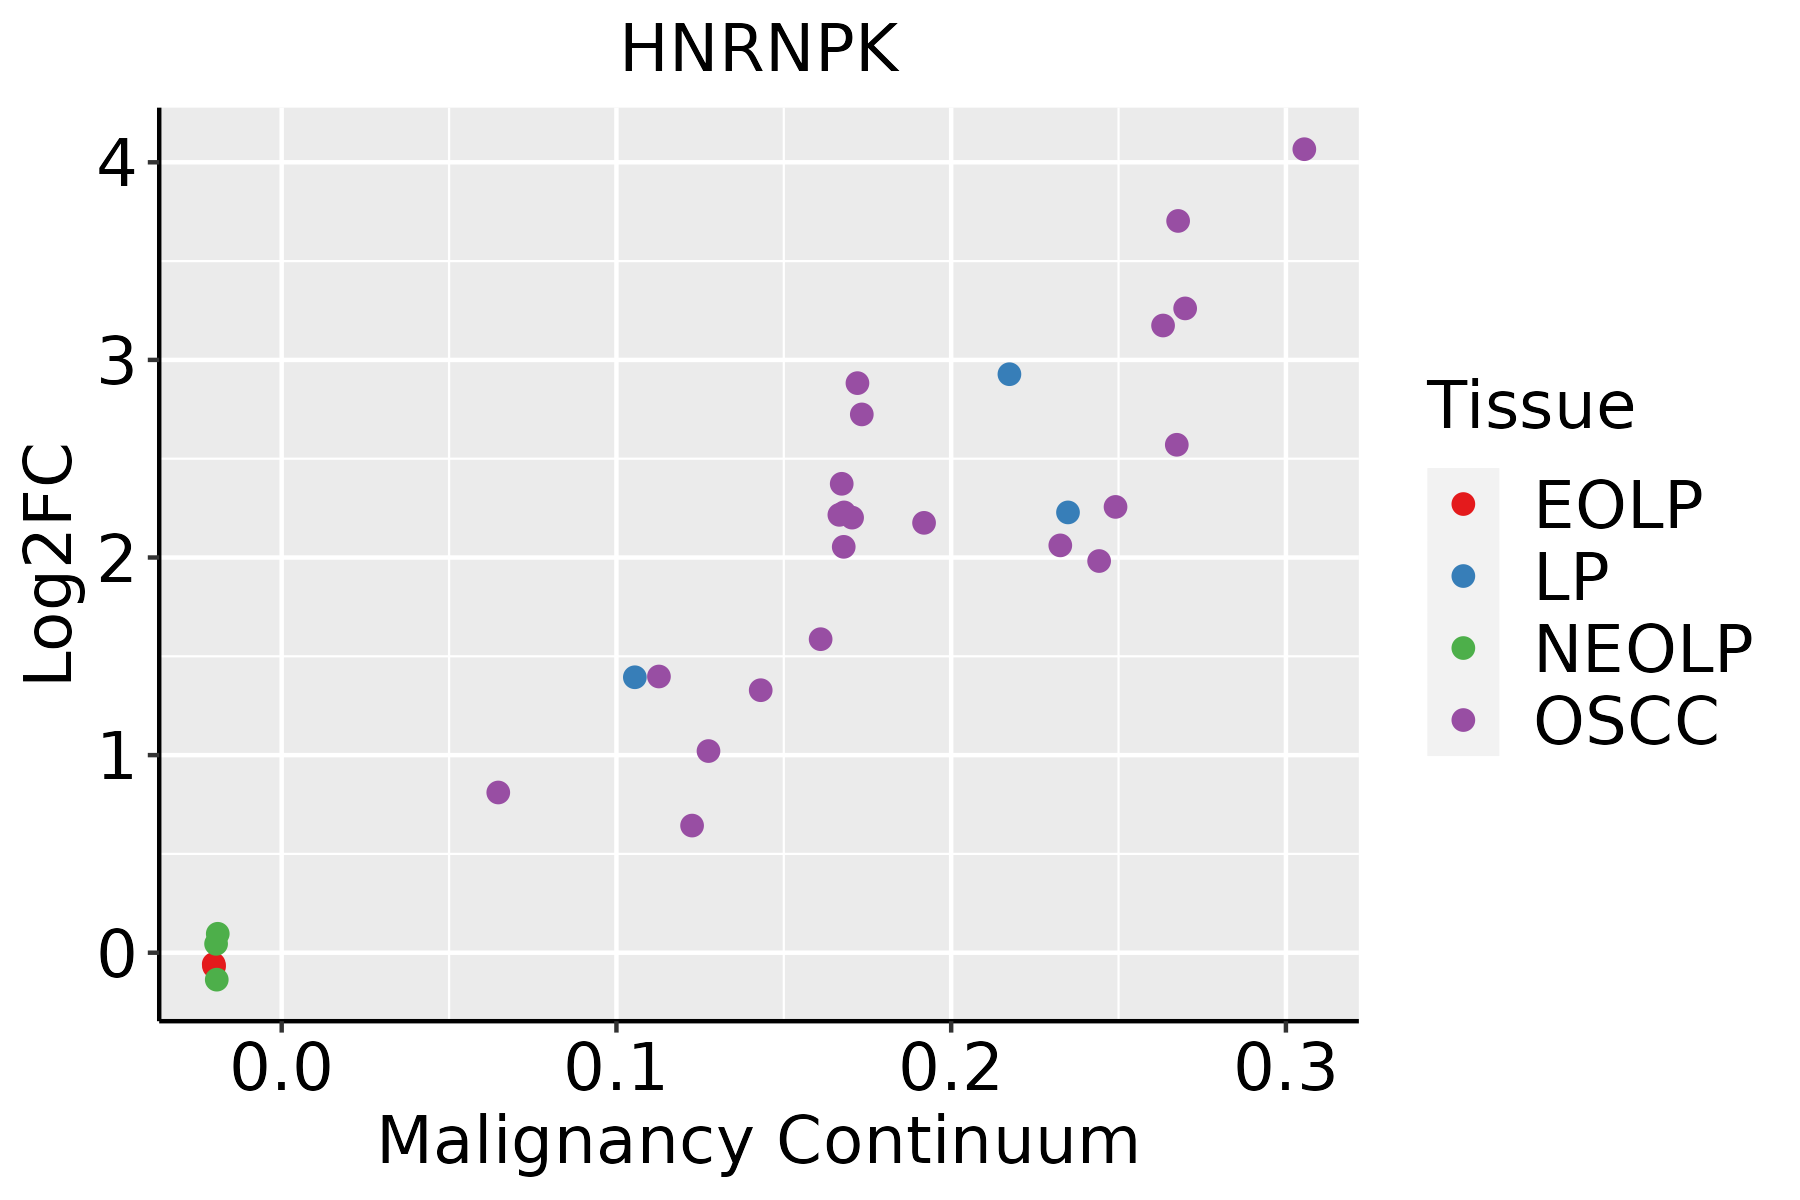 | EOLP: Erosive Oral lichen planus |
| LP: leukoplakia | ||
| NEOLP: Non-erosive oral lichen planus | ||
| OSCC: Oral squamous cell carcinoma | ||
| Prostate | 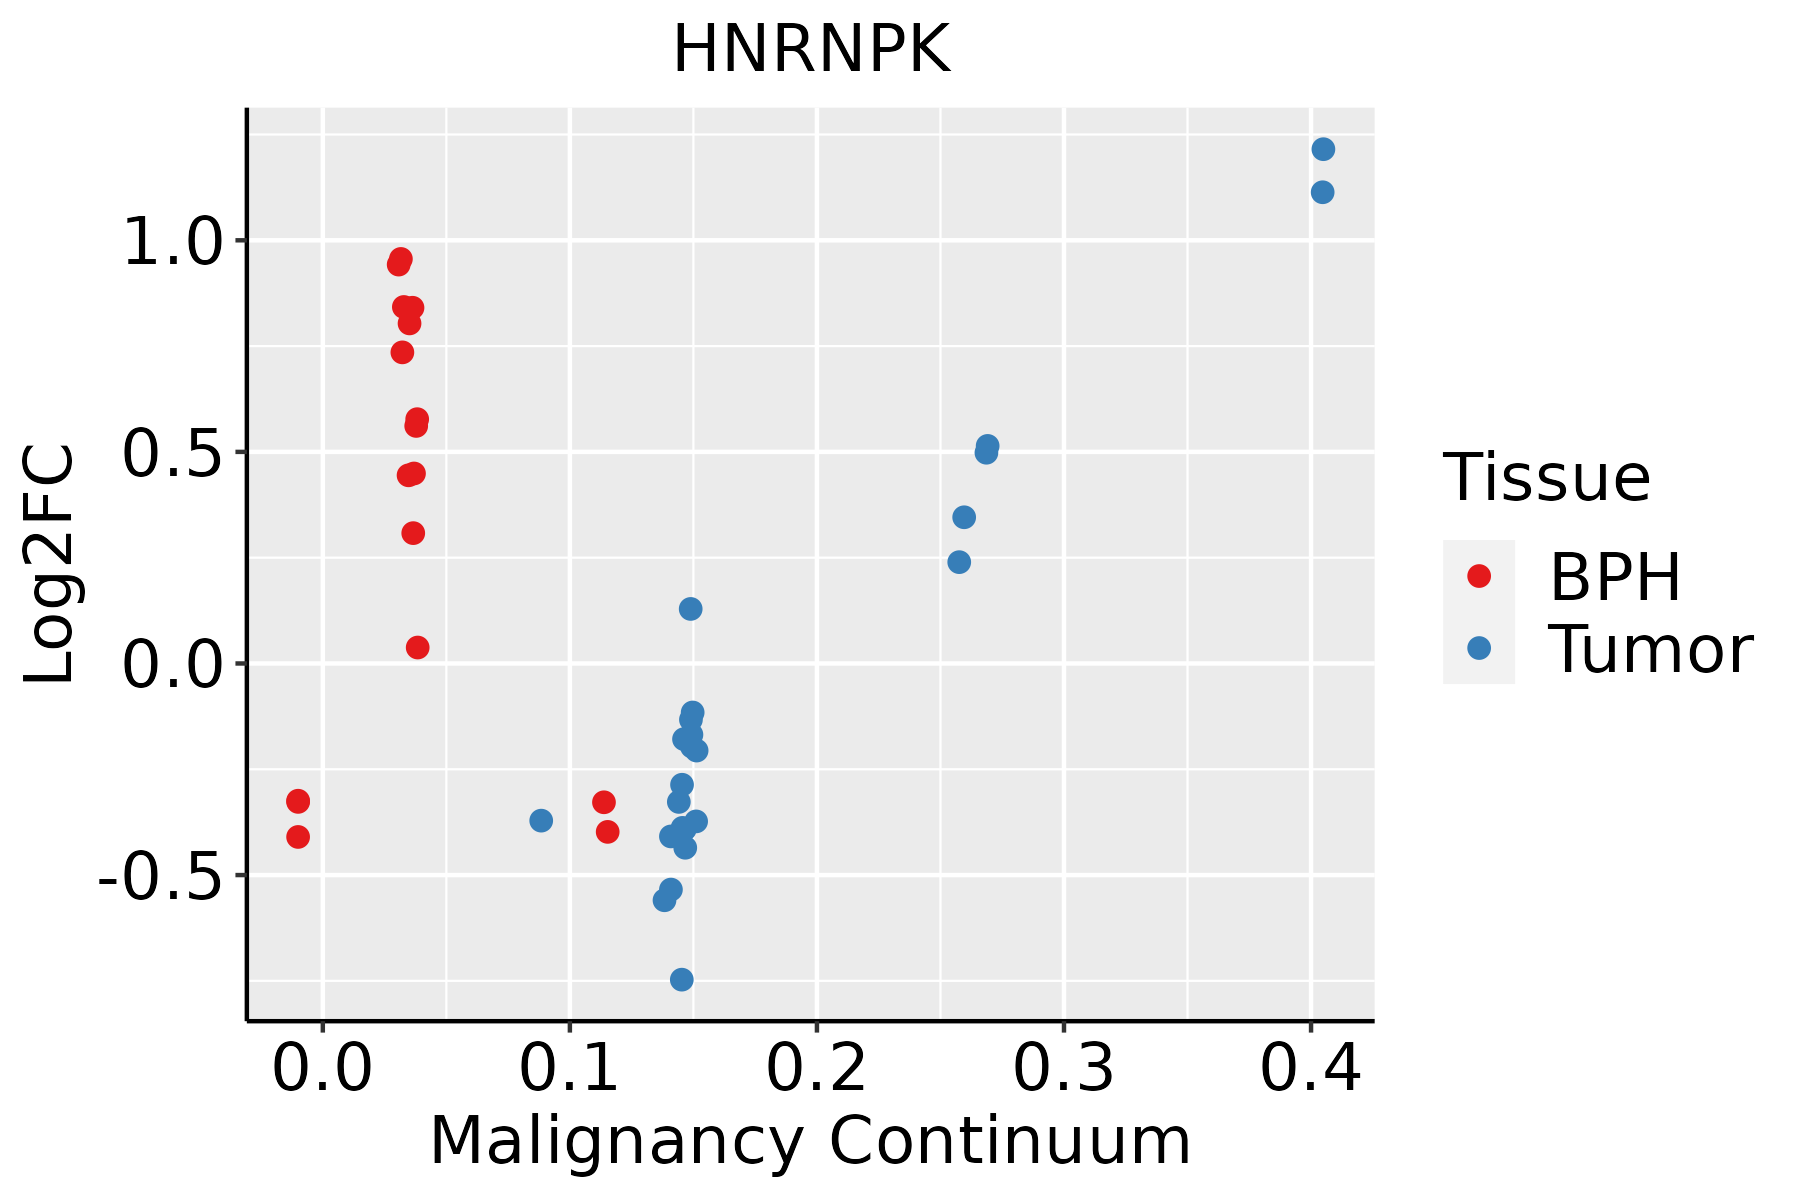 | BPH: Benign Prostatic Hyperplasia |
| Skin | 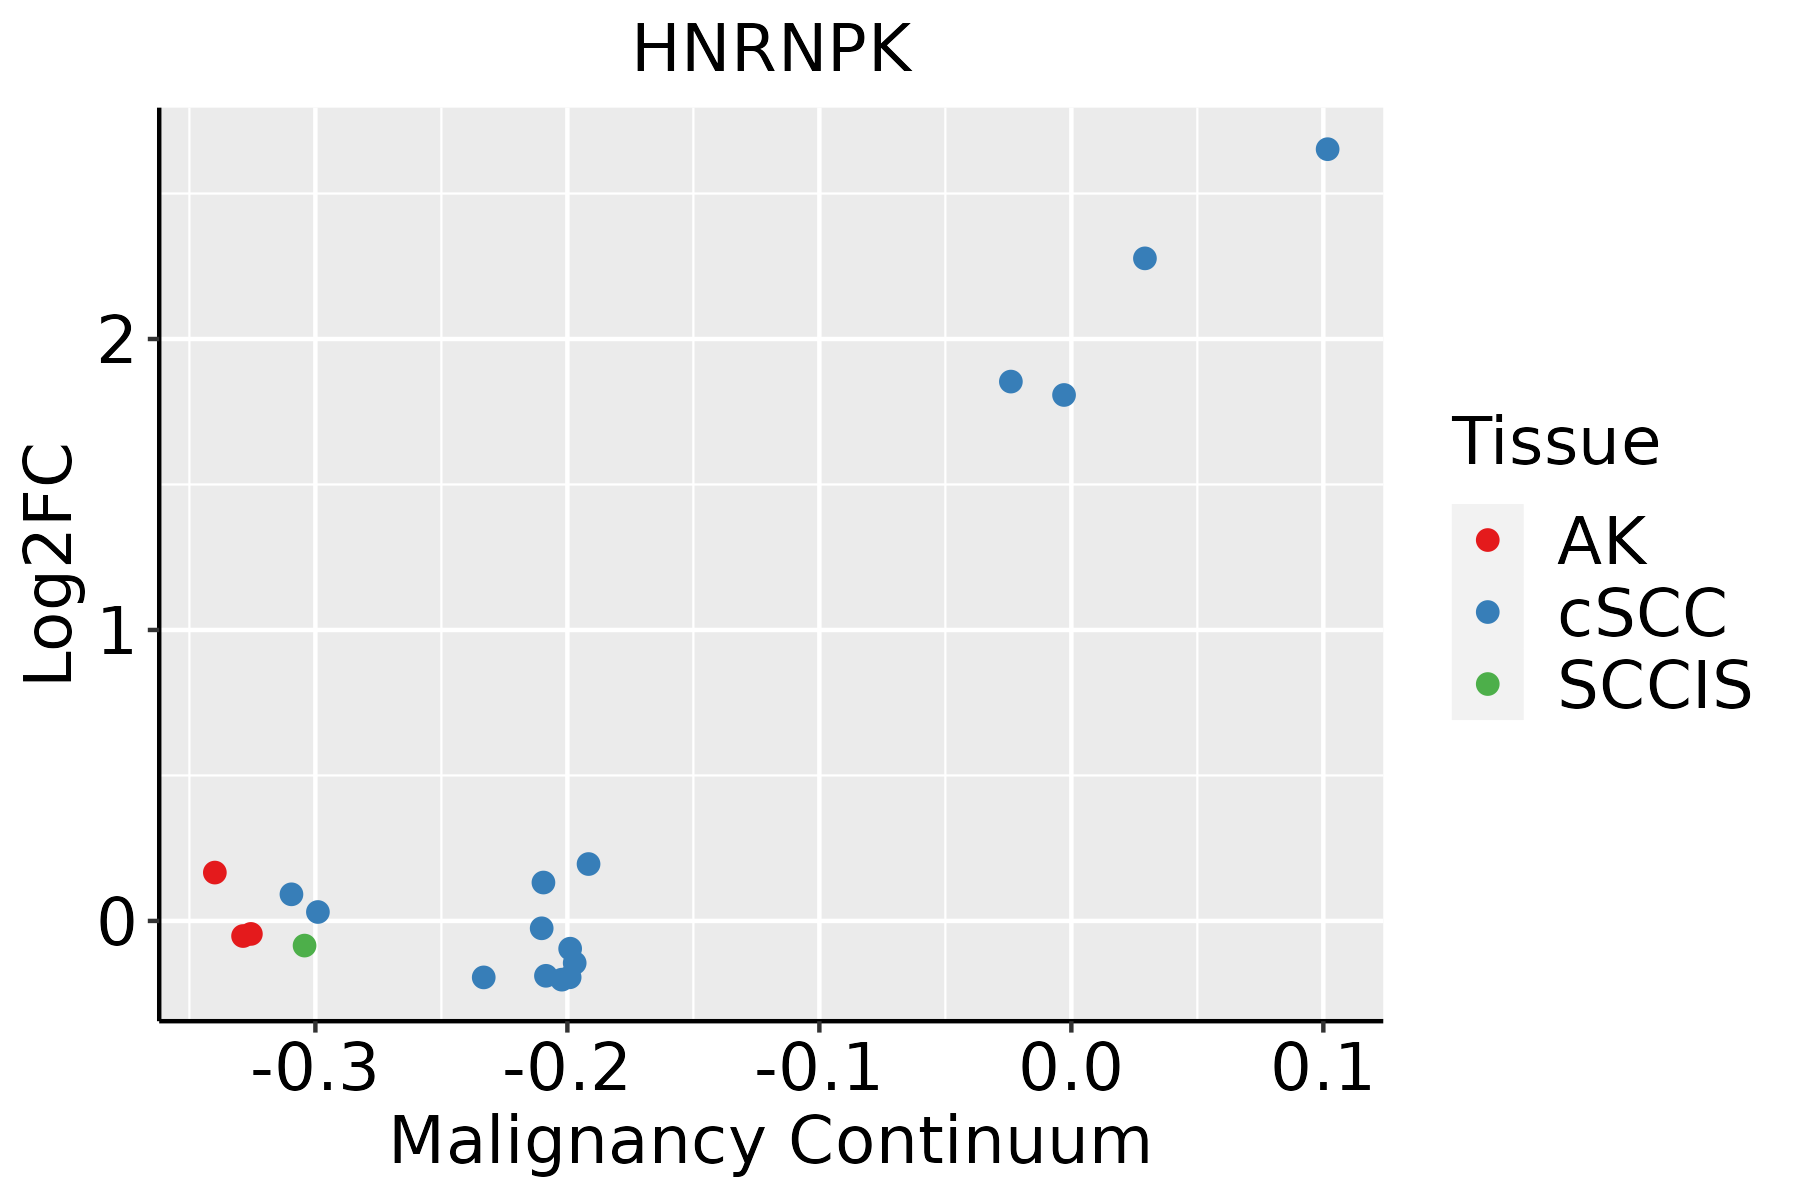 | AK: Actinic keratosis |
| cSCC: Cutaneous squamous cell carcinoma | ||
| SCCIS:squamous cell carcinoma in situ | ||
| Thyroid | 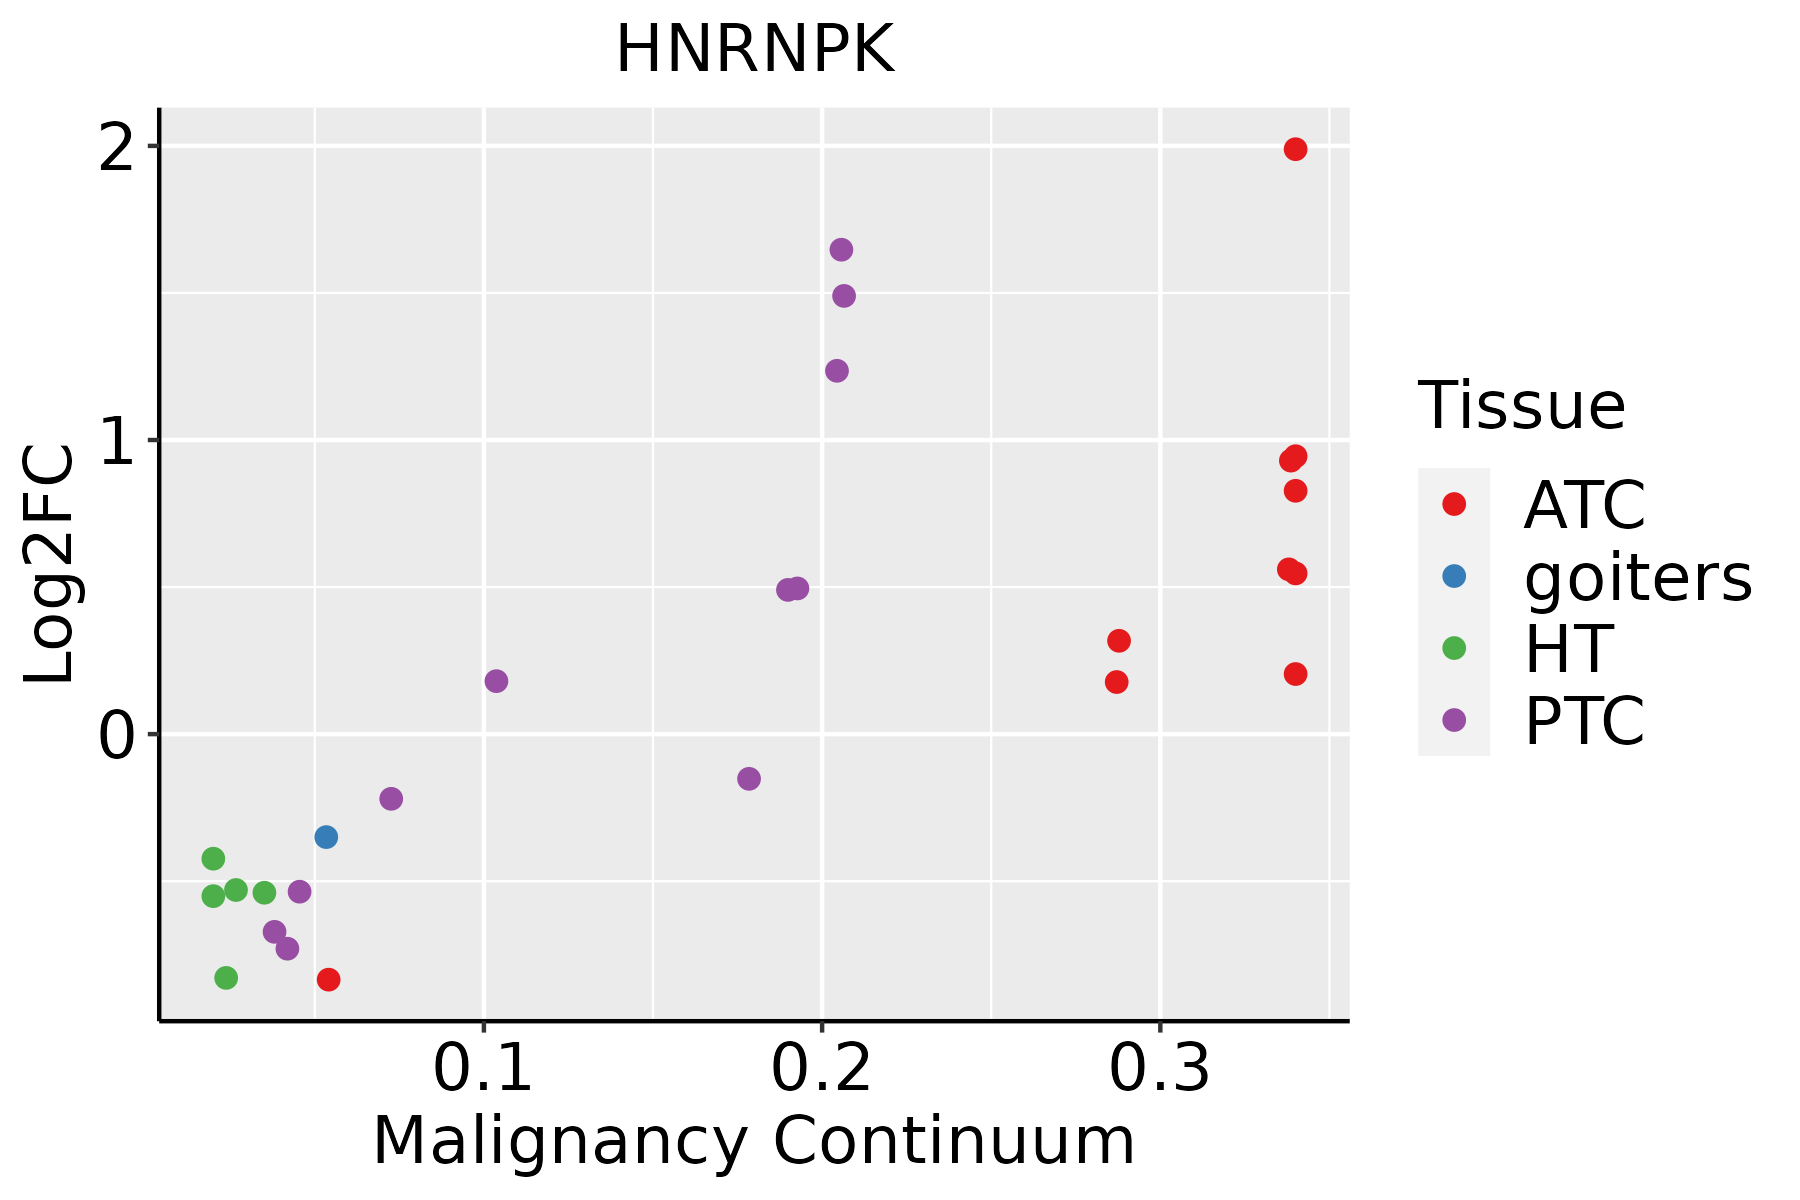 | ATC: Anaplastic thyroid cancer |
| HT: Hashimoto's thyroiditis | ||
| PTC: Papillary thyroid cancer |
| ∗log2FC in expression of this searched gene in stem-like cells from each diseased tissue sample relative to stem-like cells in normal samples in each tissue plotted against the malignancy continuum. Samples are colored based on if they are from different disease stage. |
Top |
Malignant transformation related pathway analysis |
| Find out the enriched GO biological processes and KEGG pathways involved in transition from healthy to precancer to cancer |
| Tissue | Disease Stage | Enriched GO biological Processes |
| Colorectum | AD |  |
| Colorectum | SER |  |
| Colorectum | MSS |  |
| Colorectum | MSI-H |  |
| Colorectum | FAP |  |
| ∗Top 15 enriched GO BP terms are showed in the bar plot of each disease state in each tissue. Each row represents a significant GO biological process which is colored according to the -log10(p.adjust). |
| Page: 1 2 3 4 5 6 7 8 9 |
| GO ID | Tissue | Disease Stage | Description | Gene Ratio | Bg Ratio | pvalue | p.adjust | Count |
| GO:00480256 | Cervix | CC | negative regulation of mRNA splicing, via spliceosome | 8/2311 | 20/18723 | 1.69e-03 | 1.29e-02 | 8 |
| GO:19022538 | Cervix | CC | regulation of intrinsic apoptotic signaling pathway by p53 class mediator | 10/2311 | 29/18723 | 1.74e-03 | 1.31e-02 | 10 |
| GO:00482597 | Cervix | CC | regulation of receptor-mediated endocytosis | 24/2311 | 110/18723 | 3.62e-03 | 2.31e-02 | 24 |
| GO:00427719 | Cervix | CC | intrinsic apoptotic signaling pathway in response to DNA damage by p53 class mediator | 12/2311 | 43/18723 | 4.71e-03 | 2.83e-02 | 12 |
| GO:00506866 | Cervix | CC | negative regulation of mRNA processing | 9/2311 | 29/18723 | 6.49e-03 | 3.61e-02 | 9 |
| GO:000037710 | Cervix | CC | RNA splicing, via transesterification reactions with bulged adenosine as nucleophile | 55/2311 | 320/18723 | 6.71e-03 | 3.70e-02 | 55 |
| GO:000039810 | Cervix | CC | mRNA splicing, via spliceosome | 55/2311 | 320/18723 | 6.71e-03 | 3.70e-02 | 55 |
| GO:000037510 | Cervix | CC | RNA splicing, via transesterification reactions | 55/2311 | 324/18723 | 8.61e-03 | 4.44e-02 | 55 |
| GO:19021656 | Cervix | CC | regulation of intrinsic apoptotic signaling pathway in response to DNA damage by p53 class mediator | 6/2311 | 16/18723 | 9.35e-03 | 4.66e-02 | 6 |
| GO:200123325 | Cervix | N_HPV | regulation of apoptotic signaling pathway | 36/534 | 356/18723 | 4.95e-11 | 5.63e-08 | 36 |
| GO:009719325 | Cervix | N_HPV | intrinsic apoptotic signaling pathway | 31/534 | 288/18723 | 2.39e-10 | 2.17e-07 | 31 |
| GO:200124225 | Cervix | N_HPV | regulation of intrinsic apoptotic signaling pathway | 23/534 | 164/18723 | 2.93e-10 | 2.21e-07 | 23 |
| GO:004348425 | Cervix | N_HPV | regulation of RNA splicing | 15/534 | 148/18723 | 2.23e-05 | 6.26e-04 | 15 |
| GO:007233225 | Cervix | N_HPV | intrinsic apoptotic signaling pathway by p53 class mediator | 10/534 | 76/18723 | 5.77e-05 | 1.28e-03 | 10 |
| GO:190225325 | Cervix | N_HPV | regulation of intrinsic apoptotic signaling pathway by p53 class mediator | 6/534 | 29/18723 | 1.42e-04 | 2.65e-03 | 6 |
| GO:190179625 | Cervix | N_HPV | regulation of signal transduction by p53 class mediator | 10/534 | 93/18723 | 3.17e-04 | 4.75e-03 | 10 |
| GO:003311915 | Cervix | N_HPV | negative regulation of RNA splicing | 5/534 | 25/18723 | 6.13e-04 | 7.96e-03 | 5 |
| GO:000689824 | Cervix | N_HPV | receptor-mediated endocytosis | 17/534 | 244/18723 | 6.68e-04 | 8.57e-03 | 17 |
| GO:007233125 | Cervix | N_HPV | signal transduction by p53 class mediator | 13/534 | 163/18723 | 8.20e-04 | 1.01e-02 | 13 |
| GO:190216522 | Cervix | N_HPV | regulation of intrinsic apoptotic signaling pathway in response to DNA damage by p53 class mediator | 4/534 | 16/18723 | 9.06e-04 | 1.08e-02 | 4 |
| Page: 1 2 3 4 5 6 7 8 9 10 11 12 13 14 15 16 17 18 19 20 21 22 23 24 25 26 27 28 29 30 31 32 33 34 35 36 37 38 39 40 41 42 43 44 45 46 47 |
| Pathway ID | Tissue | Disease Stage | Description | Gene Ratio | Bg Ratio | pvalue | p.adjust | qvalue | Count |
| hsa030408 | Breast | Precancer | Spliceosome | 39/684 | 217/8465 | 1.44e-06 | 2.27e-05 | 1.74e-05 | 39 |
| hsa052036 | Breast | Precancer | Viral carcinogenesis | 27/684 | 204/8465 | 7.19e-03 | 4.06e-02 | 3.11e-02 | 27 |
| hsa0304013 | Breast | Precancer | Spliceosome | 39/684 | 217/8465 | 1.44e-06 | 2.27e-05 | 1.74e-05 | 39 |
| hsa0520312 | Breast | Precancer | Viral carcinogenesis | 27/684 | 204/8465 | 7.19e-03 | 4.06e-02 | 3.11e-02 | 27 |
| hsa0304023 | Breast | IDC | Spliceosome | 40/867 | 217/8465 | 1.53e-04 | 1.42e-03 | 1.06e-03 | 40 |
| hsa0520322 | Breast | IDC | Viral carcinogenesis | 34/867 | 204/8465 | 2.82e-03 | 1.86e-02 | 1.39e-02 | 34 |
| hsa0304033 | Breast | IDC | Spliceosome | 40/867 | 217/8465 | 1.53e-04 | 1.42e-03 | 1.06e-03 | 40 |
| hsa0520332 | Breast | IDC | Viral carcinogenesis | 34/867 | 204/8465 | 2.82e-03 | 1.86e-02 | 1.39e-02 | 34 |
| hsa0304043 | Breast | DCIS | Spliceosome | 40/846 | 217/8465 | 8.97e-05 | 8.52e-04 | 6.28e-04 | 40 |
| hsa0520341 | Breast | DCIS | Viral carcinogenesis | 34/846 | 204/8465 | 1.88e-03 | 1.27e-02 | 9.33e-03 | 34 |
| hsa0304053 | Breast | DCIS | Spliceosome | 40/846 | 217/8465 | 8.97e-05 | 8.52e-04 | 6.28e-04 | 40 |
| hsa052035 | Breast | DCIS | Viral carcinogenesis | 34/846 | 204/8465 | 1.88e-03 | 1.27e-02 | 9.33e-03 | 34 |
| hsa03040 | Colorectum | AD | Spliceosome | 73/2092 | 217/8465 | 1.73e-03 | 9.68e-03 | 6.18e-03 | 73 |
| hsa030401 | Colorectum | AD | Spliceosome | 73/2092 | 217/8465 | 1.73e-03 | 9.68e-03 | 6.18e-03 | 73 |
| hsa030402 | Colorectum | MSS | Spliceosome | 66/1875 | 217/8465 | 2.58e-03 | 1.27e-02 | 7.81e-03 | 66 |
| hsa030403 | Colorectum | MSS | Spliceosome | 66/1875 | 217/8465 | 2.58e-03 | 1.27e-02 | 7.81e-03 | 66 |
| hsa030404 | Colorectum | MSI-H | Spliceosome | 37/797 | 217/8465 | 2.49e-04 | 3.23e-03 | 2.70e-03 | 37 |
| hsa030405 | Colorectum | MSI-H | Spliceosome | 37/797 | 217/8465 | 2.49e-04 | 3.23e-03 | 2.70e-03 | 37 |
| hsa030409 | Endometrium | AEH | Spliceosome | 54/1197 | 217/8465 | 1.47e-05 | 1.65e-04 | 1.21e-04 | 54 |
| hsa0304014 | Endometrium | AEH | Spliceosome | 54/1197 | 217/8465 | 1.47e-05 | 1.65e-04 | 1.21e-04 | 54 |
| Page: 1 2 3 4 |
Top |
Cell-cell communication analysis |
| Identification of potential cell-cell interactions between two cell types and their ligand-receptor pairs for different disease states |
| Ligand | Receptor | LRpair | Pathway | Tissue | Disease Stage |
| Page: 1 |
Top |
Single-cell gene regulatory network inference analysis |
| Find out the significant the regulons (TFs) and the target genes of each regulon across cell types for different disease states |
| TF | Cell Type | Tissue | Disease Stage | Target Gene | RSS | Regulon Activity |
| ∗The dot plots of a searched regulon are shown for all cell subpopulations in each disease state of each tissue based on the regulon specific score inferred using pySCENIC and by calculating the average expression. |
| Page: 1 |
Top |
Somatic mutation of malignant transformation related genes |
| Annotation of somatic variants for genes involved in malignant transformation |
| Hugo Symbol | Variant Class | Variant Classification | dbSNP RS | HGVSc | HGVSp | HGVSp Short | SWISSPROT | BIOTYPE | SIFT | PolyPhen | Tumor Sample Barcode | Tissue | Histology | Sex | Age | Stage | Therapy Types | Drugs | Outcome |
| HNRNPK | SNV | Missense_Mutation | novel | c.1120N>T | p.Ala374Ser | p.A374S | P61978 | protein_coding | tolerated(0.77) | benign(0.021) | TCGA-AC-A62V-01 | Breast | breast invasive carcinoma | Male | <65 | III/IV | Targeted Molecular therapy | denosumab | PD |
| HNRNPK | SNV | Missense_Mutation | c.224G>C | p.Ser75Thr | p.S75T | P61978 | protein_coding | tolerated(0.31) | benign(0.06) | TCGA-AN-A0AK-01 | Breast | breast invasive carcinoma | Female | >=65 | I/II | Unknown | Unknown | SD | |
| HNRNPK | SNV | Missense_Mutation | novel | c.38N>G | p.Thr13Ser | p.T13S | P61978 | protein_coding | tolerated_low_confidence(0.09) | benign(0.202) | TCGA-AR-A1AO-01 | Breast | breast invasive carcinoma | Female | <65 | I/II | Chemotherapy | doxorubicin | SD |
| HNRNPK | SNV | Missense_Mutation | c.10N>A | p.Glu4Lys | p.E4K | P61978 | protein_coding | deleterious_low_confidence(0.01) | possibly_damaging(0.669) | TCGA-B6-A0WZ-01 | Breast | breast invasive carcinoma | Female | <65 | I/II | Unknown | Unknown | PD | |
| HNRNPK | SNV | Missense_Mutation | novel | c.731A>T | p.Asp244Val | p.D244V | P61978 | protein_coding | deleterious(0) | possibly_damaging(0.776) | TCGA-E2-A10C-01 | Breast | breast invasive carcinoma | Female | <65 | I/II | Chemotherapy | cytoxan | SD |
| HNRNPK | SNV | Missense_Mutation | c.10G>A | p.Glu4Lys | p.E4K | P61978 | protein_coding | deleterious_low_confidence(0.01) | possibly_damaging(0.669) | TCGA-S3-AA10-01 | Breast | breast invasive carcinoma | Female | >=65 | I/II | Chemotherapy | cytoxan | CR | |
| HNRNPK | insertion | Nonsense_Mutation | novel | c.301_302insAATATCAGAATTGAAACAATTGGAGAAATTC | p.Leu101GlnfsTer5 | p.L101Qfs*5 | P61978 | protein_coding | TCGA-A7-A0DB-01 | Breast | breast invasive carcinoma | Female | <65 | I/II | Hormone Therapy | arimidex | SD | ||
| HNRNPK | SNV | Missense_Mutation | novel | c.1144N>A | p.Asp382Asn | p.D382N | P61978 | protein_coding | deleterious(0.04) | possibly_damaging(0.501) | TCGA-GH-A9DA-01 | Cervix | cervical & endocervical cancer | Female | <65 | I/II | Unknown | Unknown | SD |
| HNRNPK | SNV | Missense_Mutation | novel | c.723G>T | p.Met241Ile | p.M241I | P61978 | protein_coding | tolerated(0.15) | benign(0.01) | TCGA-VS-A8EI-01 | Cervix | cervical & endocervical cancer | Female | <65 | I/II | Chemotherapy | cisplatin | CR |
| HNRNPK | SNV | Missense_Mutation | c.256N>A | p.Arg86Ser | p.R86S | P61978 | protein_coding | deleterious(0.02) | benign(0.053) | TCGA-VS-A9UJ-01 | Cervix | cervical & endocervical cancer | Female | <65 | I/II | Unknown | Unknown | PD |
| Page: 1 2 3 4 5 6 |
Top |
Related drugs of malignant transformation related genes |
| Identification of chemicals and drugs interact with genes involved in malignant transfromation |
| (DGIdb 4.0) |
| Entrez ID | Symbol | Category | Interaction Types | Drug Claim Name | Drug Name | PMIDs |
| Page: 1 |

Copyright 2023-Present -The University of Texas Health Science Center at Houston |