| Tissue | Expression Dynamics | Abbreviation |
| Endometrium | 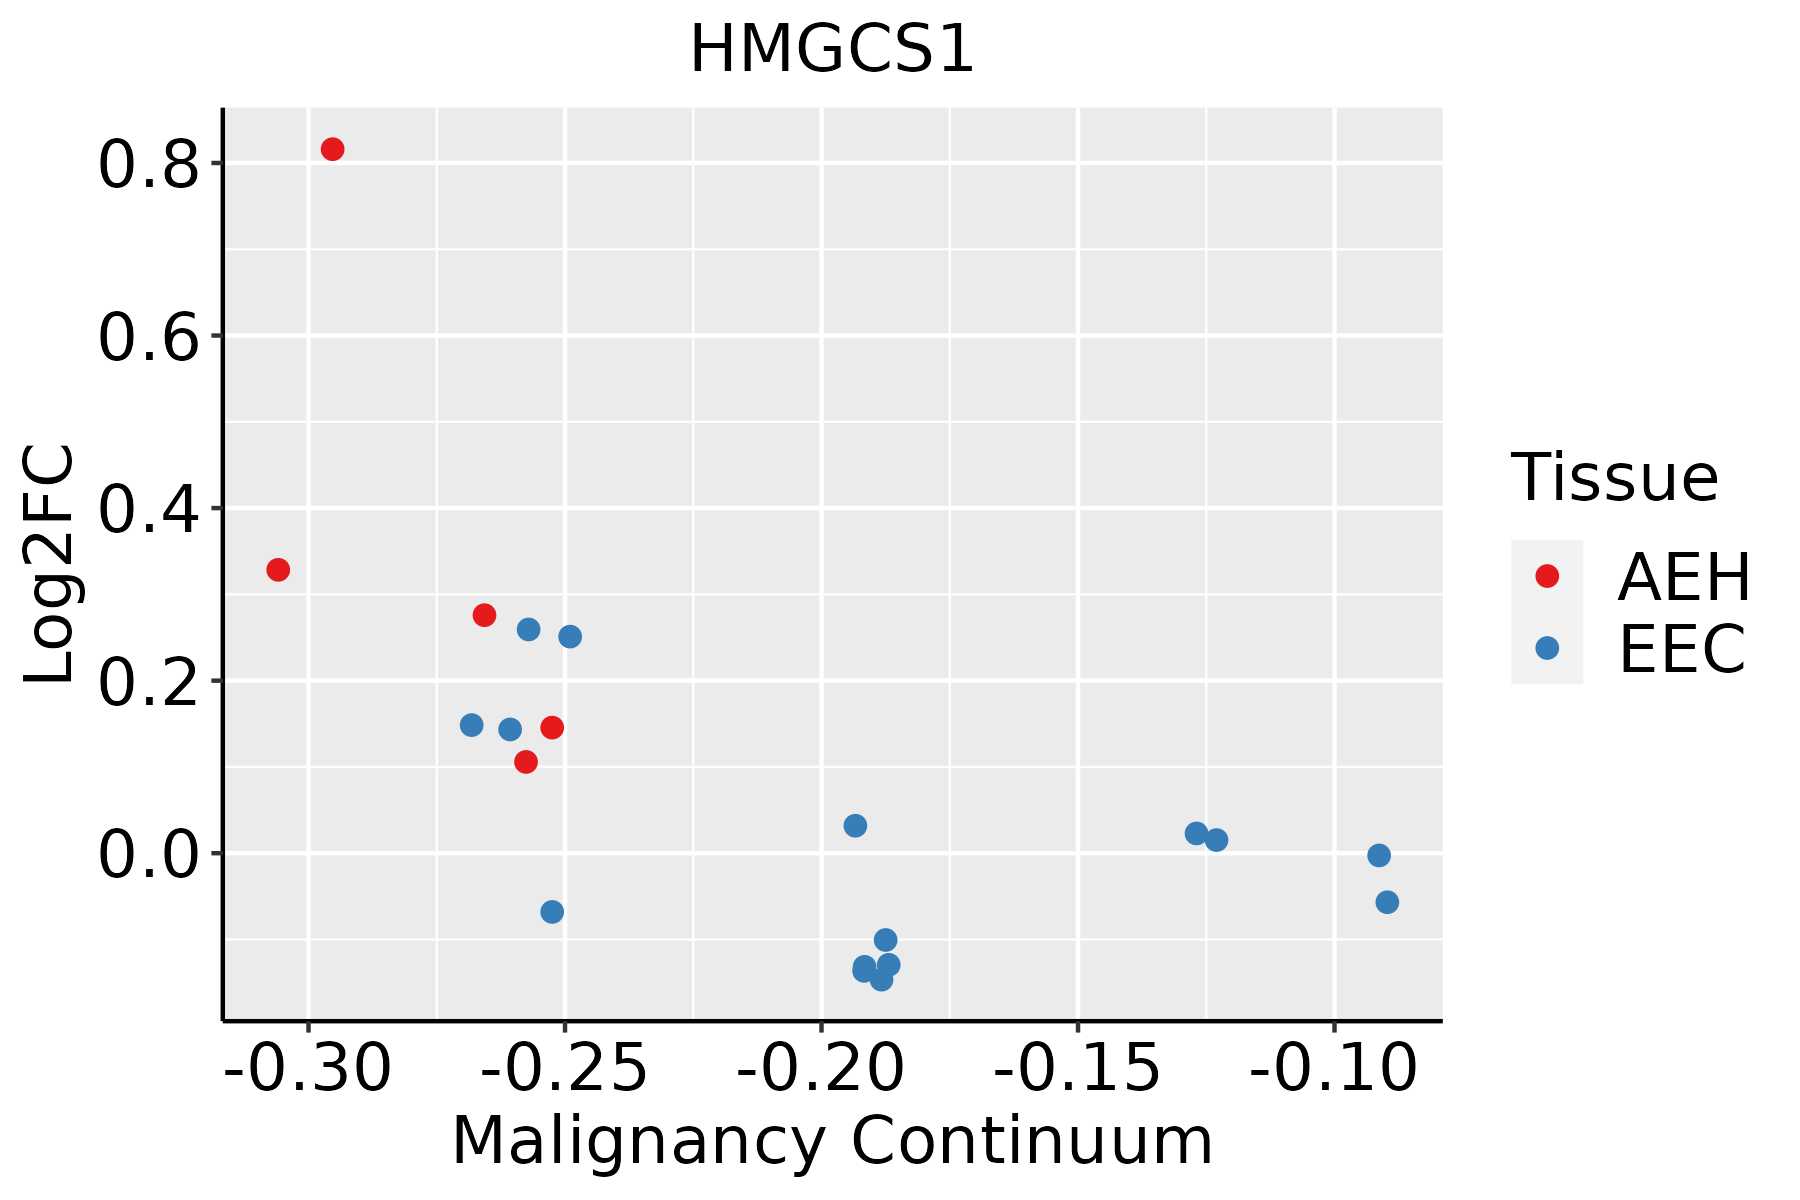 | AEH: Atypical endometrial hyperplasia |
| EEC: Endometrioid Cancer |
| Esophagus |  | ESCC: Esophageal squamous cell carcinoma |
| HGIN: High-grade intraepithelial neoplasias |
| LGIN: Low-grade intraepithelial neoplasias |
| GC | 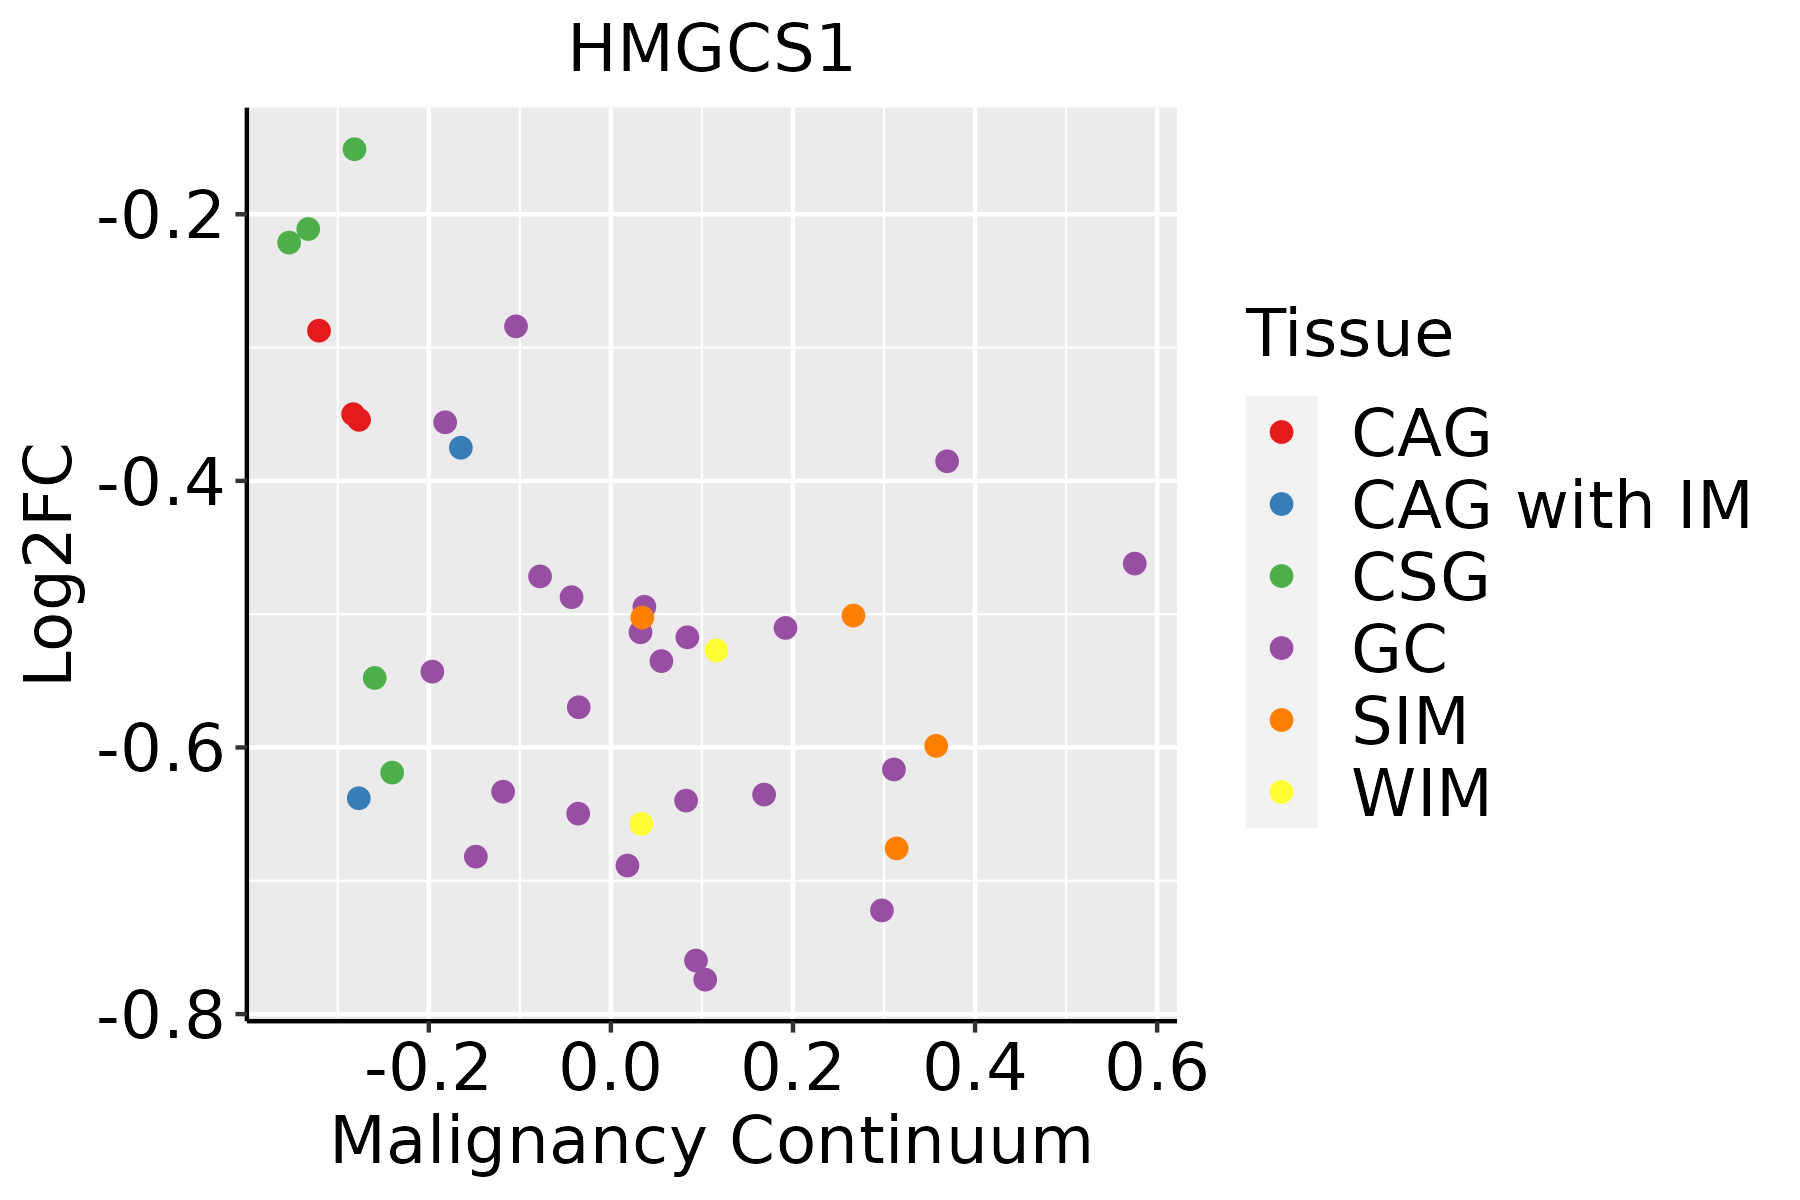 | CAG: Chronic atrophic gastritis |
| CAG with IM: Chronic atrophic gastritis with intestinal metaplasia |
| CSG: Chronic superficial gastritis |
| GC: Gastric cancer |
| SIM: Severe intestinal metaplasia |
| WIM: Wild intestinal metaplasia |
| Liver | 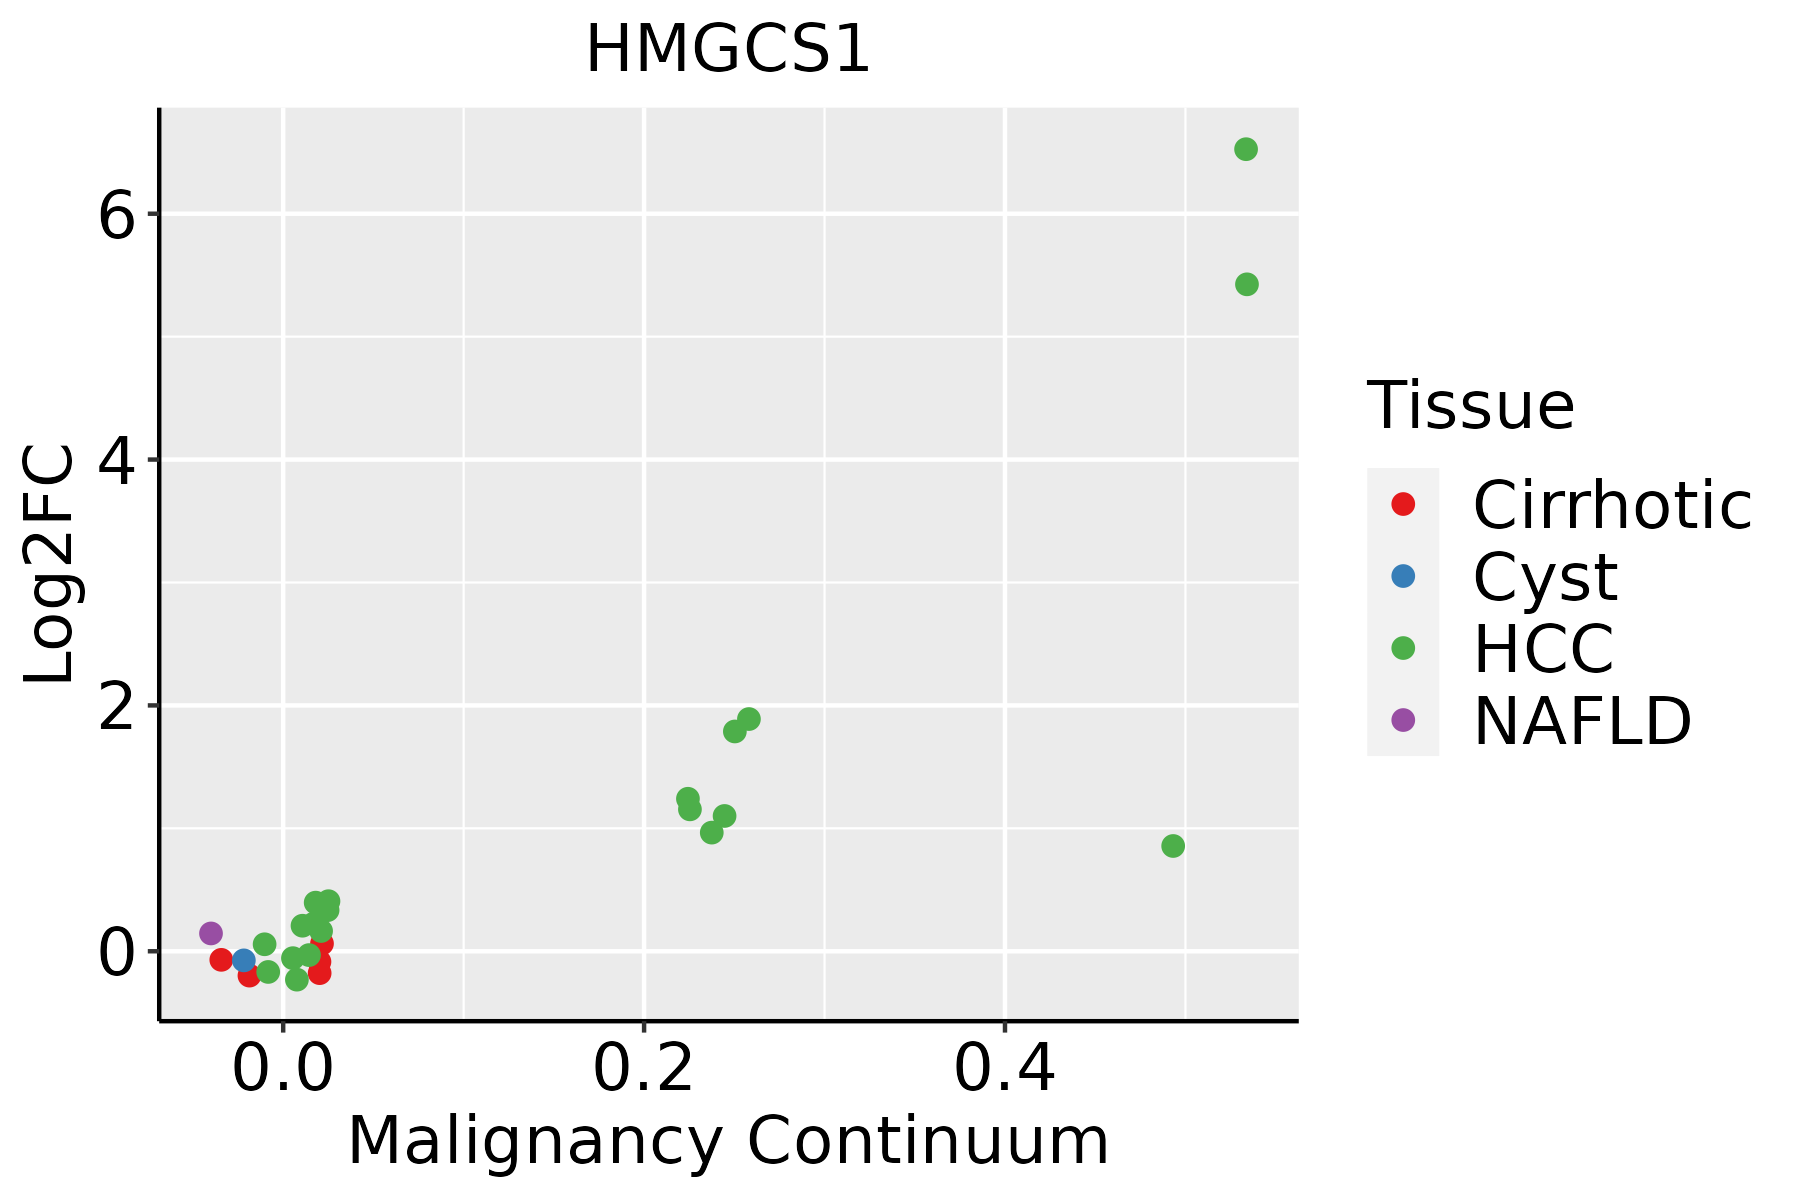 | HCC: Hepatocellular carcinoma |
| NAFLD: Non-alcoholic fatty liver disease |
| Oral Cavity | 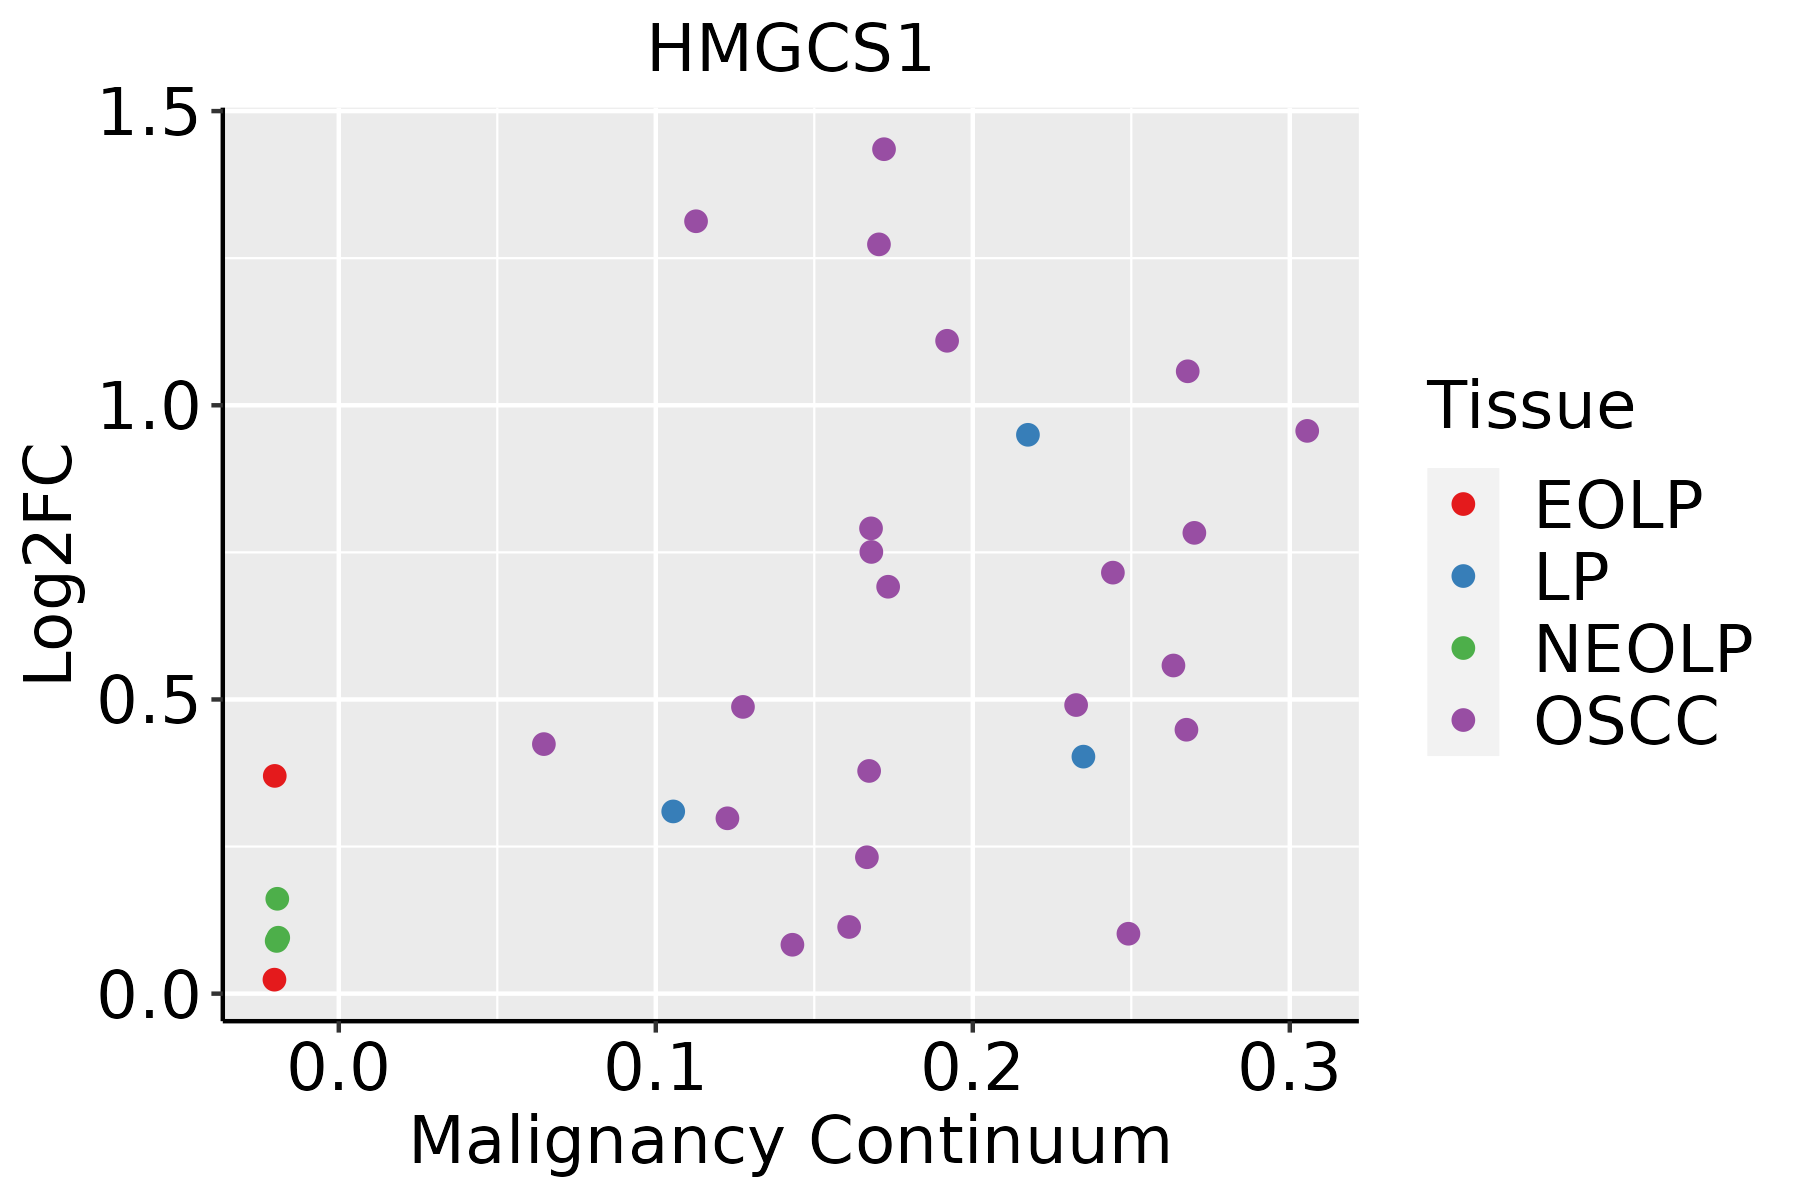 | EOLP: Erosive Oral lichen planus |
| LP: leukoplakia |
| NEOLP: Non-erosive oral lichen planus |
| OSCC: Oral squamous cell carcinoma |
| Prostate |  | BPH: Benign Prostatic Hyperplasia |
| Skin |  | AK: Actinic keratosis |
| cSCC: Cutaneous squamous cell carcinoma |
| SCCIS:squamous cell carcinoma in situ |
| Thyroid |  | ATC: Anaplastic thyroid cancer |
| HT: Hashimoto's thyroiditis |
| PTC: Papillary thyroid cancer |
| GO ID | Tissue | Disease Stage | Description | Gene Ratio | Bg Ratio | pvalue | p.adjust | Count |
| GO:000911712 | Liver | Cirrhotic | nucleotide metabolic process | 187/4634 | 489/18723 | 1.55e-11 | 9.63e-10 | 187 |
| GO:00082031 | Liver | Cirrhotic | cholesterol metabolic process | 70/4634 | 137/18723 | 2.59e-11 | 1.55e-09 | 70 |
| GO:00161251 | Liver | Cirrhotic | sterol metabolic process | 75/4634 | 152/18723 | 4.54e-11 | 2.61e-09 | 75 |
| GO:001969312 | Liver | Cirrhotic | ribose phosphate metabolic process | 156/4634 | 396/18723 | 5.83e-11 | 3.23e-09 | 156 |
| GO:000606612 | Liver | Cirrhotic | alcohol metabolic process | 141/4634 | 353/18723 | 1.57e-10 | 8.03e-09 | 141 |
| GO:000925912 | Liver | Cirrhotic | ribonucleotide metabolic process | 151/4634 | 385/18723 | 1.72e-10 | 8.70e-09 | 151 |
| GO:003166712 | Liver | Cirrhotic | response to nutrient levels | 174/4634 | 474/18723 | 3.08e-09 | 1.27e-07 | 174 |
| GO:007252112 | Liver | Cirrhotic | purine-containing compound metabolic process | 156/4634 | 416/18723 | 3.74e-09 | 1.52e-07 | 156 |
| GO:000915012 | Liver | Cirrhotic | purine ribonucleotide metabolic process | 141/4634 | 368/18723 | 4.22e-09 | 1.70e-07 | 141 |
| GO:00066941 | Liver | Cirrhotic | steroid biosynthetic process | 77/4634 | 173/18723 | 1.02e-08 | 3.91e-07 | 77 |
| GO:0016126 | Liver | Cirrhotic | sterol biosynthetic process | 37/4634 | 64/18723 | 1.74e-08 | 6.32e-07 | 37 |
| GO:0006695 | Liver | Cirrhotic | cholesterol biosynthetic process | 34/4634 | 57/18723 | 2.22e-08 | 7.77e-07 | 34 |
| GO:1902653 | Liver | Cirrhotic | secondary alcohol biosynthetic process | 34/4634 | 57/18723 | 2.22e-08 | 7.77e-07 | 34 |
| GO:000679011 | Liver | Cirrhotic | sulfur compound metabolic process | 129/4634 | 339/18723 | 3.06e-08 | 1.04e-06 | 129 |
| GO:000616312 | Liver | Cirrhotic | purine nucleotide metabolic process | 146/4634 | 396/18723 | 4.12e-08 | 1.34e-06 | 146 |
| GO:000941012 | Liver | Cirrhotic | response to xenobiotic stimulus | 165/4634 | 462/18723 | 6.82e-08 | 2.09e-06 | 165 |
| GO:004873212 | Liver | Cirrhotic | gland development | 154/4634 | 436/18723 | 4.03e-07 | 9.42e-06 | 154 |
| GO:009730512 | Liver | Cirrhotic | response to alcohol | 96/4634 | 253/18723 | 1.97e-06 | 3.65e-05 | 96 |
| GO:000758411 | Liver | Cirrhotic | response to nutrient | 67/4634 | 174/18723 | 3.83e-05 | 4.59e-04 | 67 |
| GO:0046165 | Liver | Cirrhotic | alcohol biosynthetic process | 55/4634 | 140/18723 | 9.74e-05 | 1.03e-03 | 55 |
| Pathway ID | Tissue | Disease Stage | Description | Gene Ratio | Bg Ratio | pvalue | p.adjust | qvalue | Count |
| hsa009005 | Esophagus | ESCC | Terpenoid backbone biosynthesis | 20/4205 | 23/8465 | 2.14e-04 | 7.87e-04 | 4.03e-04 | 20 |
| hsa002809 | Esophagus | ESCC | Valine, leucine and isoleucine degradation | 34/4205 | 48/8465 | 2.34e-03 | 6.54e-03 | 3.35e-03 | 34 |
| hsa0090012 | Esophagus | ESCC | Terpenoid backbone biosynthesis | 20/4205 | 23/8465 | 2.14e-04 | 7.87e-04 | 4.03e-04 | 20 |
| hsa0028014 | Esophagus | ESCC | Valine, leucine and isoleucine degradation | 34/4205 | 48/8465 | 2.34e-03 | 6.54e-03 | 3.35e-03 | 34 |
| hsa0028021 | Liver | Cirrhotic | Valine, leucine and isoleucine degradation | 32/2530 | 48/8465 | 1.45e-07 | 2.02e-06 | 1.24e-06 | 32 |
| hsa006502 | Liver | Cirrhotic | Butanoate metabolism | 15/2530 | 27/8465 | 4.71e-03 | 1.74e-02 | 1.07e-02 | 15 |
| hsa0332021 | Liver | Cirrhotic | PPAR signaling pathway | 32/2530 | 75/8465 | 1.24e-02 | 3.92e-02 | 2.42e-02 | 32 |
| hsa0028031 | Liver | Cirrhotic | Valine, leucine and isoleucine degradation | 32/2530 | 48/8465 | 1.45e-07 | 2.02e-06 | 1.24e-06 | 32 |
| hsa006503 | Liver | Cirrhotic | Butanoate metabolism | 15/2530 | 27/8465 | 4.71e-03 | 1.74e-02 | 1.07e-02 | 15 |
| hsa0332031 | Liver | Cirrhotic | PPAR signaling pathway | 32/2530 | 75/8465 | 1.24e-02 | 3.92e-02 | 2.42e-02 | 32 |
| hsa0028041 | Liver | HCC | Valine, leucine and isoleucine degradation | 41/4020 | 48/8465 | 4.84e-08 | 7.05e-07 | 3.92e-07 | 41 |
| hsa033204 | Liver | HCC | PPAR signaling pathway | 48/4020 | 75/8465 | 2.83e-03 | 9.37e-03 | 5.21e-03 | 48 |
| hsa00900 | Liver | HCC | Terpenoid backbone biosynthesis | 17/4020 | 23/8465 | 9.26e-03 | 2.46e-02 | 1.37e-02 | 17 |
| hsa006504 | Liver | HCC | Butanoate metabolism | 19/4020 | 27/8465 | 1.37e-02 | 3.33e-02 | 1.85e-02 | 19 |
| hsa0028051 | Liver | HCC | Valine, leucine and isoleucine degradation | 41/4020 | 48/8465 | 4.84e-08 | 7.05e-07 | 3.92e-07 | 41 |
| hsa033205 | Liver | HCC | PPAR signaling pathway | 48/4020 | 75/8465 | 2.83e-03 | 9.37e-03 | 5.21e-03 | 48 |
| hsa009001 | Liver | HCC | Terpenoid backbone biosynthesis | 17/4020 | 23/8465 | 9.26e-03 | 2.46e-02 | 1.37e-02 | 17 |
| hsa006505 | Liver | HCC | Butanoate metabolism | 19/4020 | 27/8465 | 1.37e-02 | 3.33e-02 | 1.85e-02 | 19 |
| hsa009004 | Oral cavity | OSCC | Terpenoid backbone biosynthesis | 19/3704 | 23/8465 | 1.55e-04 | 5.34e-04 | 2.72e-04 | 19 |
| hsa002808 | Oral cavity | OSCC | Valine, leucine and isoleucine degradation | 30/3704 | 48/8465 | 6.75e-03 | 1.57e-02 | 7.99e-03 | 30 |
| Hugo Symbol | Variant Class | Variant Classification | dbSNP RS | HGVSc | HGVSp | HGVSp Short | SWISSPROT | BIOTYPE | SIFT | PolyPhen | Tumor Sample Barcode | Tissue | Histology | Sex | Age | Stage | Therapy Types | Drugs | Outcome |
| HMGCS1 | SNV | Missense_Mutation | rs752479224 | c.1409N>G | p.Pro470Arg | p.P470R | Q01581 | protein_coding | deleterious(0) | possibly_damaging(0.848) | TCGA-A1-A0SP-01 | Breast | breast invasive carcinoma | Female | <65 | I/II | Chemotherapy | | SD |
| HMGCS1 | SNV | Missense_Mutation | novel | c.236N>T | p.Arg79Ile | p.R79I | Q01581 | protein_coding | deleterious(0) | probably_damaging(0.911) | TCGA-AN-A046-01 | Breast | breast invasive carcinoma | Female | >=65 | I/II | Unknown | Unknown | SD |
| HMGCS1 | SNV | Missense_Mutation | novel | c.17N>A | p.Pro6His | p.P6H | Q01581 | protein_coding | deleterious(0) | possibly_damaging(0.885) | TCGA-AN-A046-01 | Breast | breast invasive carcinoma | Female | >=65 | I/II | Unknown | Unknown | SD |
| HMGCS1 | SNV | Missense_Mutation | | c.717N>T | p.Lys239Asn | p.K239N | Q01581 | protein_coding | deleterious(0.02) | probably_damaging(0.955) | TCGA-AR-A251-01 | Breast | breast invasive carcinoma | Female | <65 | III/IV | Chemotherapy | doxorubicin | SD |
| HMGCS1 | SNV | Missense_Mutation | | c.506N>C | p.Arg169Thr | p.R169T | Q01581 | protein_coding | deleterious(0) | probably_damaging(0.998) | TCGA-C8-A26Y-01 | Breast | breast invasive carcinoma | Female | >=65 | I/II | Unknown | Unknown | SD |
| HMGCS1 | insertion | Nonsense_Mutation | novel | c.1376_1377insAAAAAGCTAAGACTAAGGGCTGGCAATCAAATAAGAGCAAATTTAG | p.Asp459GlufsTer4 | p.D459Efs*4 | Q01581 | protein_coding | | | TCGA-A2-A0EO-01 | Breast | breast invasive carcinoma | Female | <65 | I/II | Hormone Therapy | tamoxiphen | SD |
| HMGCS1 | SNV | Missense_Mutation | | c.1106N>C | p.Arg369Thr | p.R369T | Q01581 | protein_coding | deleterious(0.03) | probably_damaging(0.997) | TCGA-DR-A0ZM-01 | Cervix | cervical & endocervical cancer | Female | <65 | III/IV | Unspecific | Cisplatin | SD |
| HMGCS1 | SNV | Missense_Mutation | | c.829C>T | p.Arg277Trp | p.R277W | Q01581 | protein_coding | deleterious(0) | possibly_damaging(0.876) | TCGA-AA-3864-01 | Colorectum | colon adenocarcinoma | Male | >=65 | I/II | Unknown | Unknown | SD |
| HMGCS1 | SNV | Missense_Mutation | rs772131971 | c.572N>A | p.Arg191Gln | p.R191Q | Q01581 | protein_coding | tolerated(0.11) | possibly_damaging(0.558) | TCGA-A5-A0G2-01 | Endometrium | uterine corpus endometrioid carcinoma | Female | <65 | III/IV | Unknown | Unknown | SD |
| HMGCS1 | SNV | Missense_Mutation | novel | c.1033T>C | p.Tyr345His | p.Y345H | Q01581 | protein_coding | deleterious(0) | probably_damaging(0.977) | TCGA-A5-A1OF-01 | Endometrium | uterine corpus endometrioid carcinoma | Female | <65 | I/II | Unknown | Unknown | SD |


