| Tissue | Expression Dynamics | Abbreviation |
| Breast | 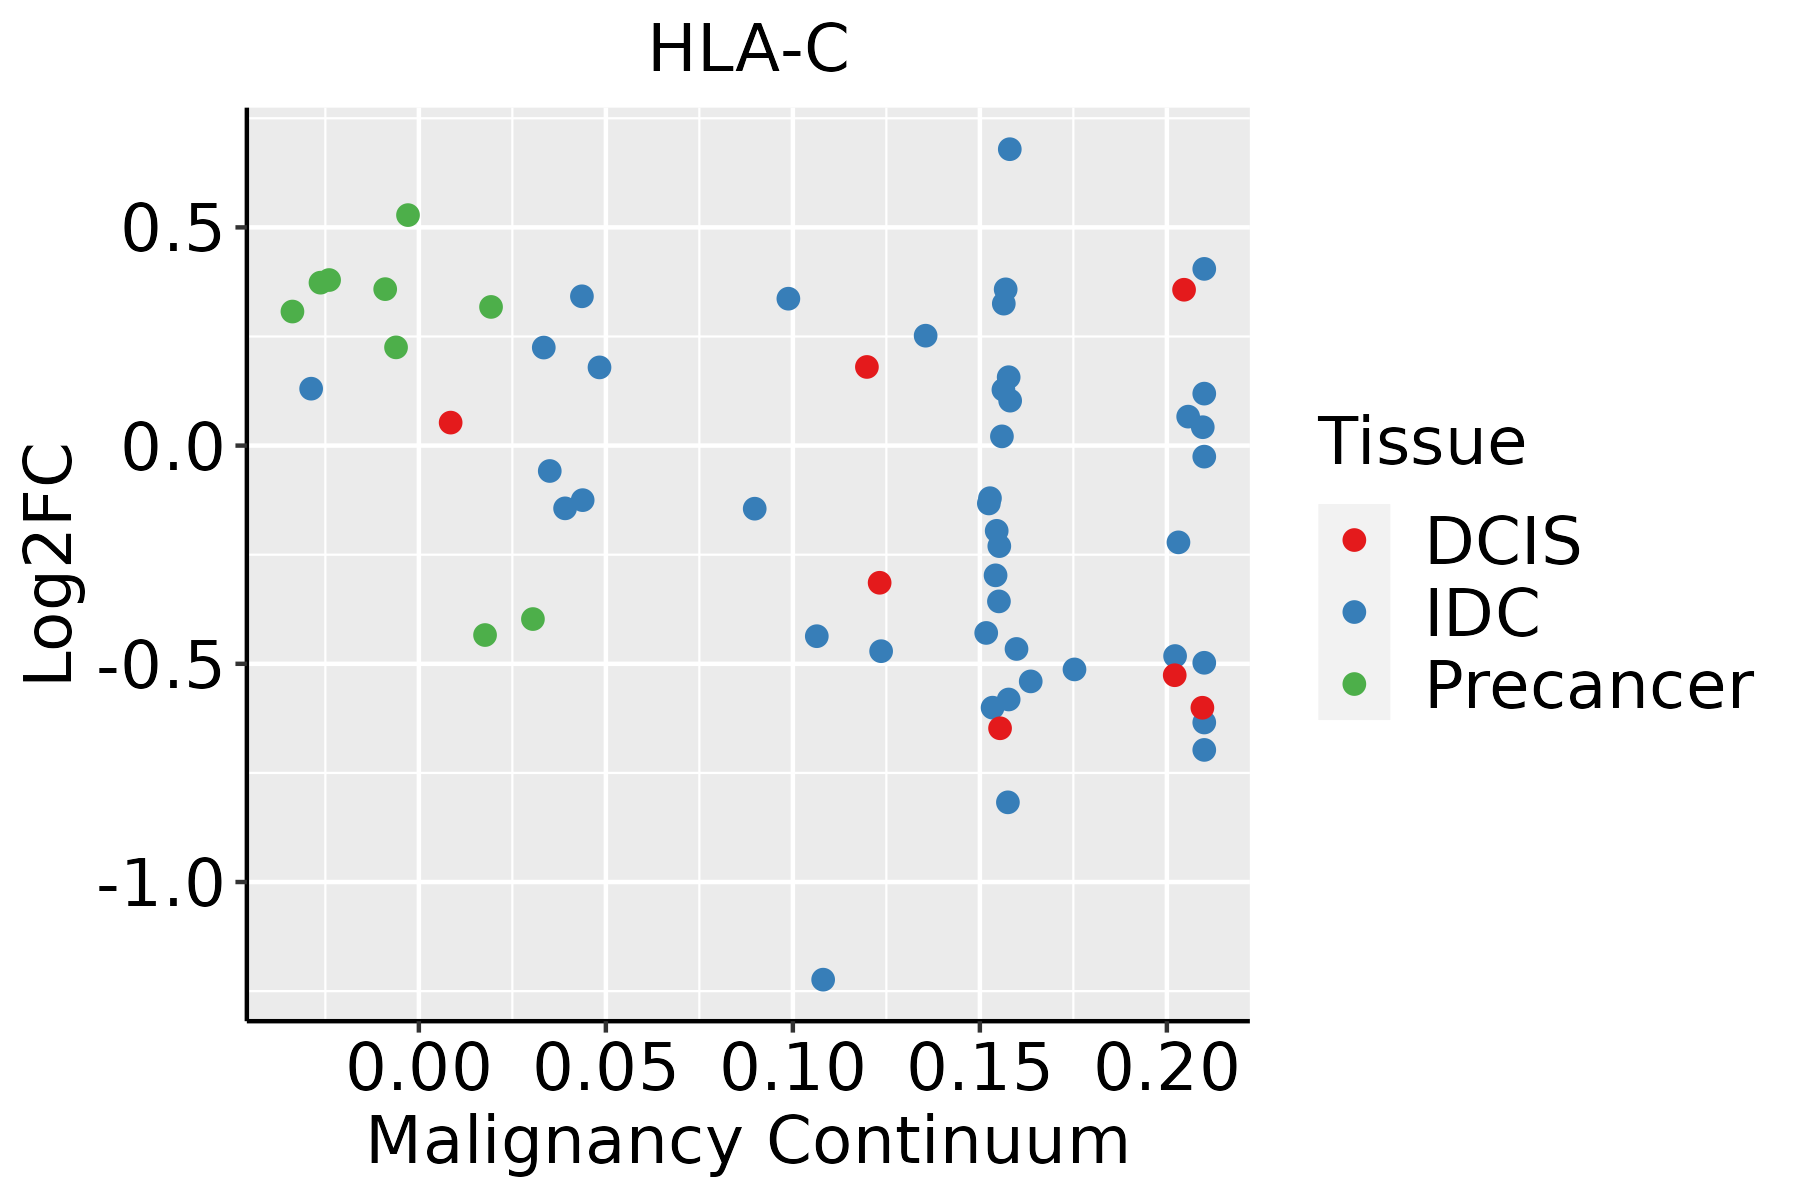 | IDC: Invasive ductal carcinoma |
| DCIS: Ductal carcinoma in situ |
| Precancer(BRCA1-mut): Precancerous lesion from BRCA1 mutation carriers |
| Cervix | 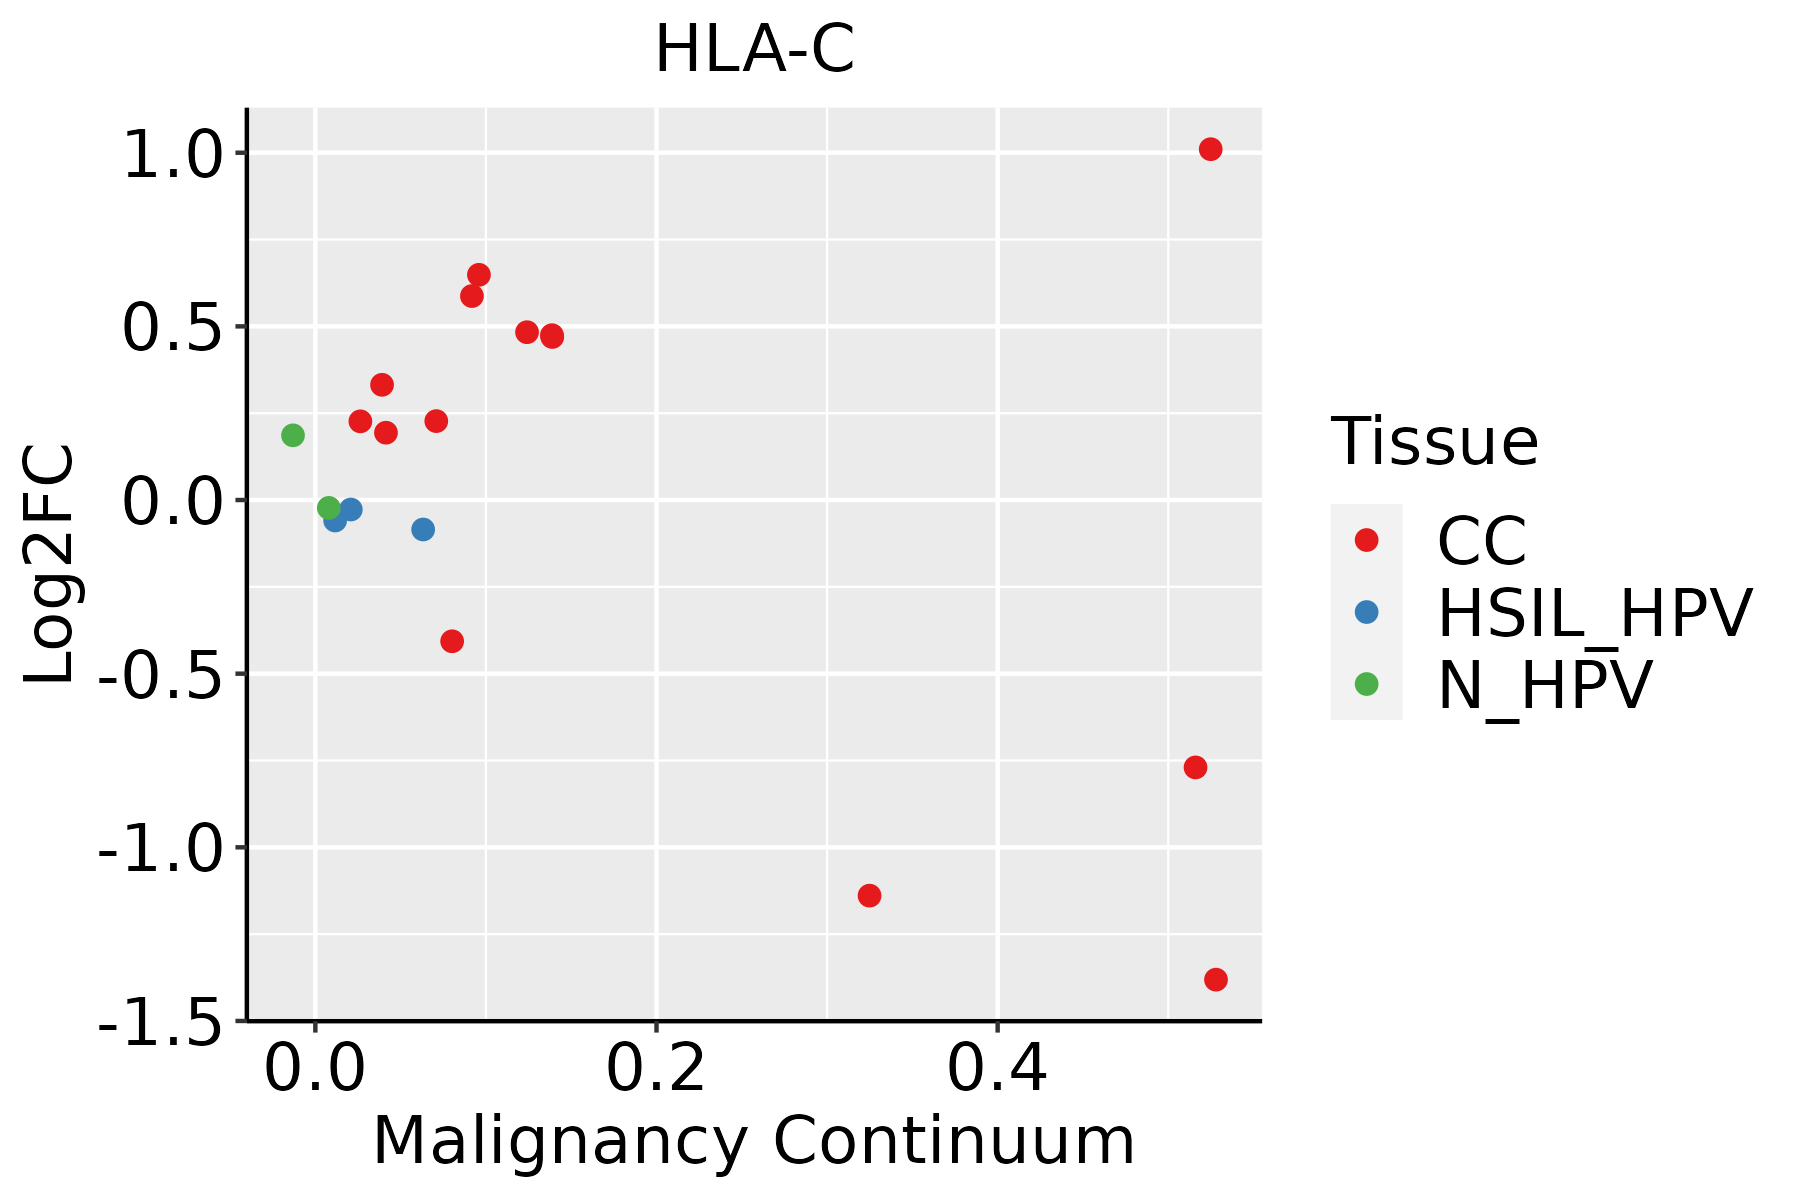 | CC: Cervix cancer |
| HSIL_HPV: HPV-infected high-grade squamous intraepithelial lesions |
| N_HPV: HPV-infected normal cervix |
| Colorectum (GSE201348) |  | FAP: Familial adenomatous polyposis |
| CRC: Colorectal cancer |
| Colorectum (HTA11) |  | AD: Adenomas |
| SER: Sessile serrated lesions |
| MSI-H: Microsatellite-high colorectal cancer |
| MSS: Microsatellite stable colorectal cancer |
| Endometrium | 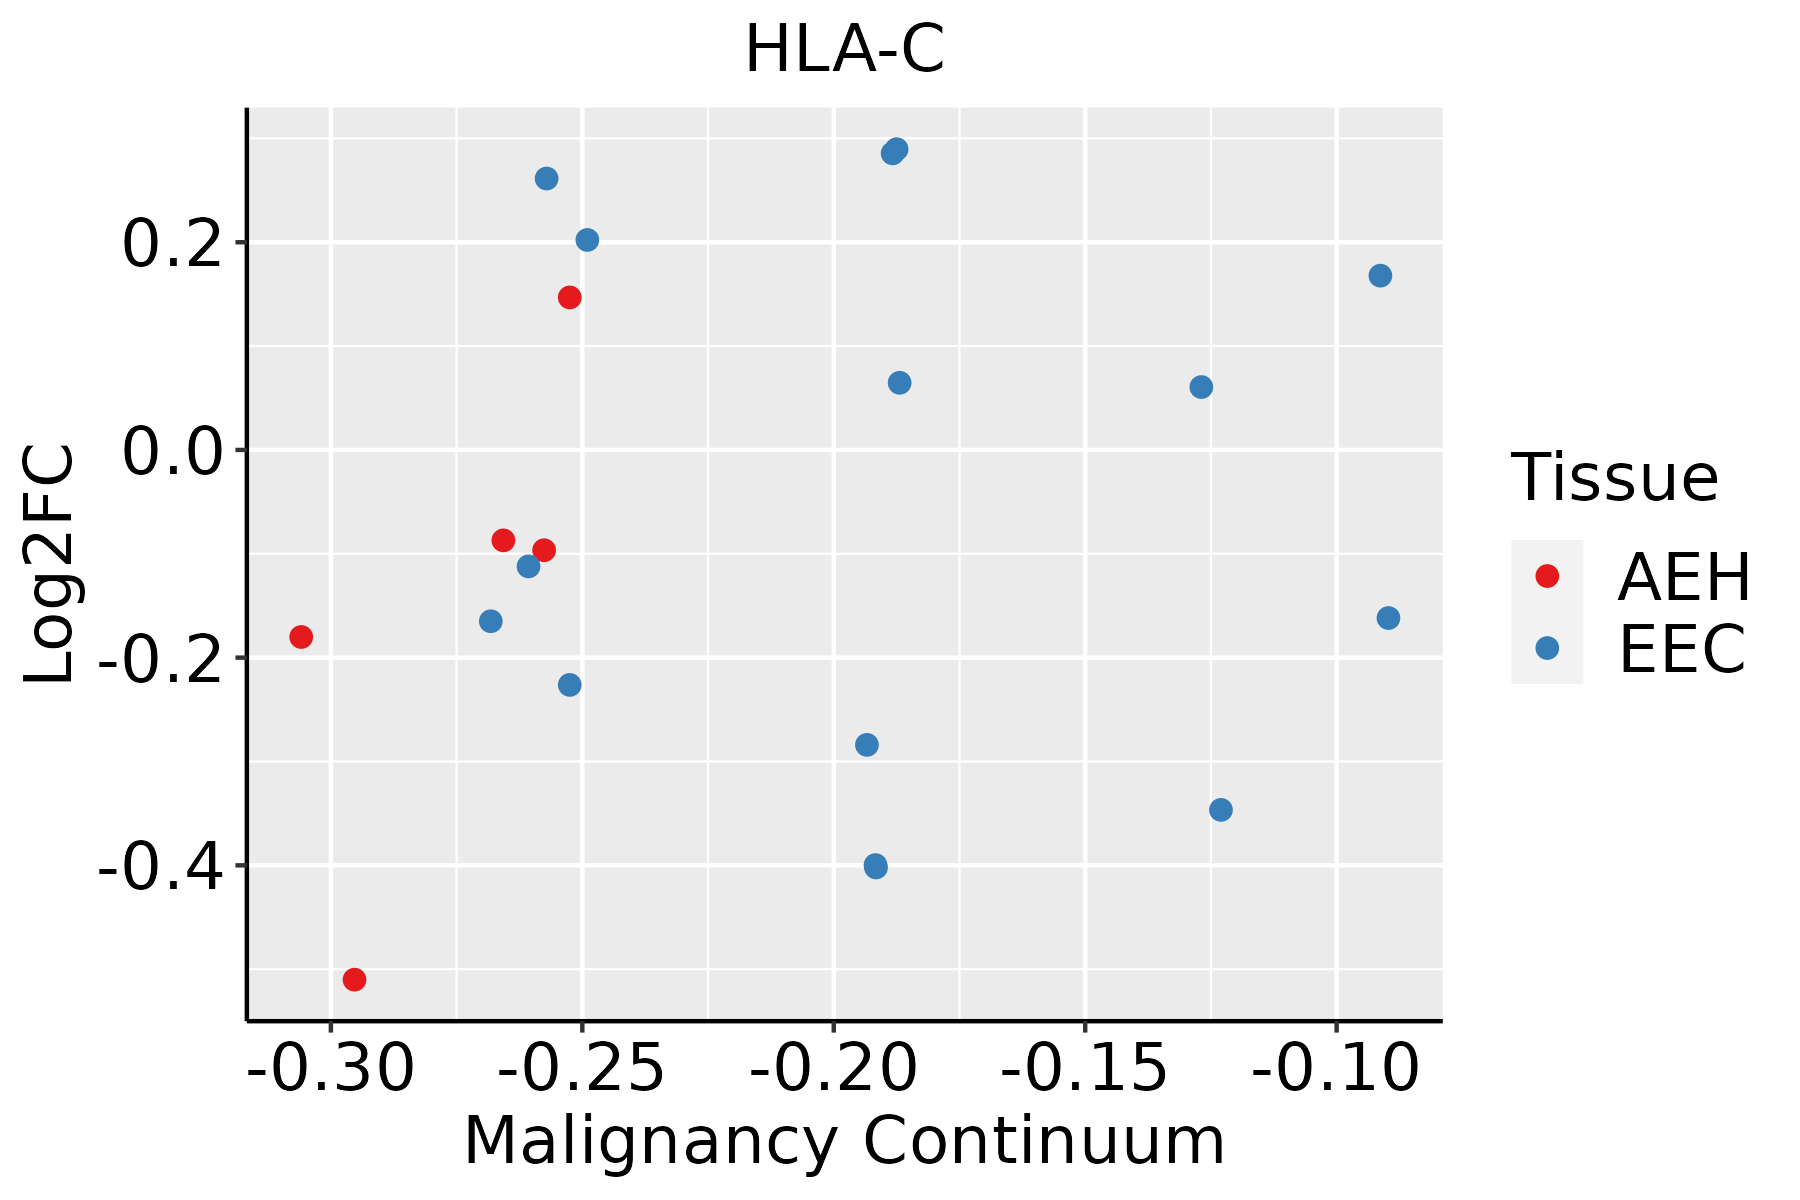 | AEH: Atypical endometrial hyperplasia |
| EEC: Endometrioid Cancer |
| Esophagus | 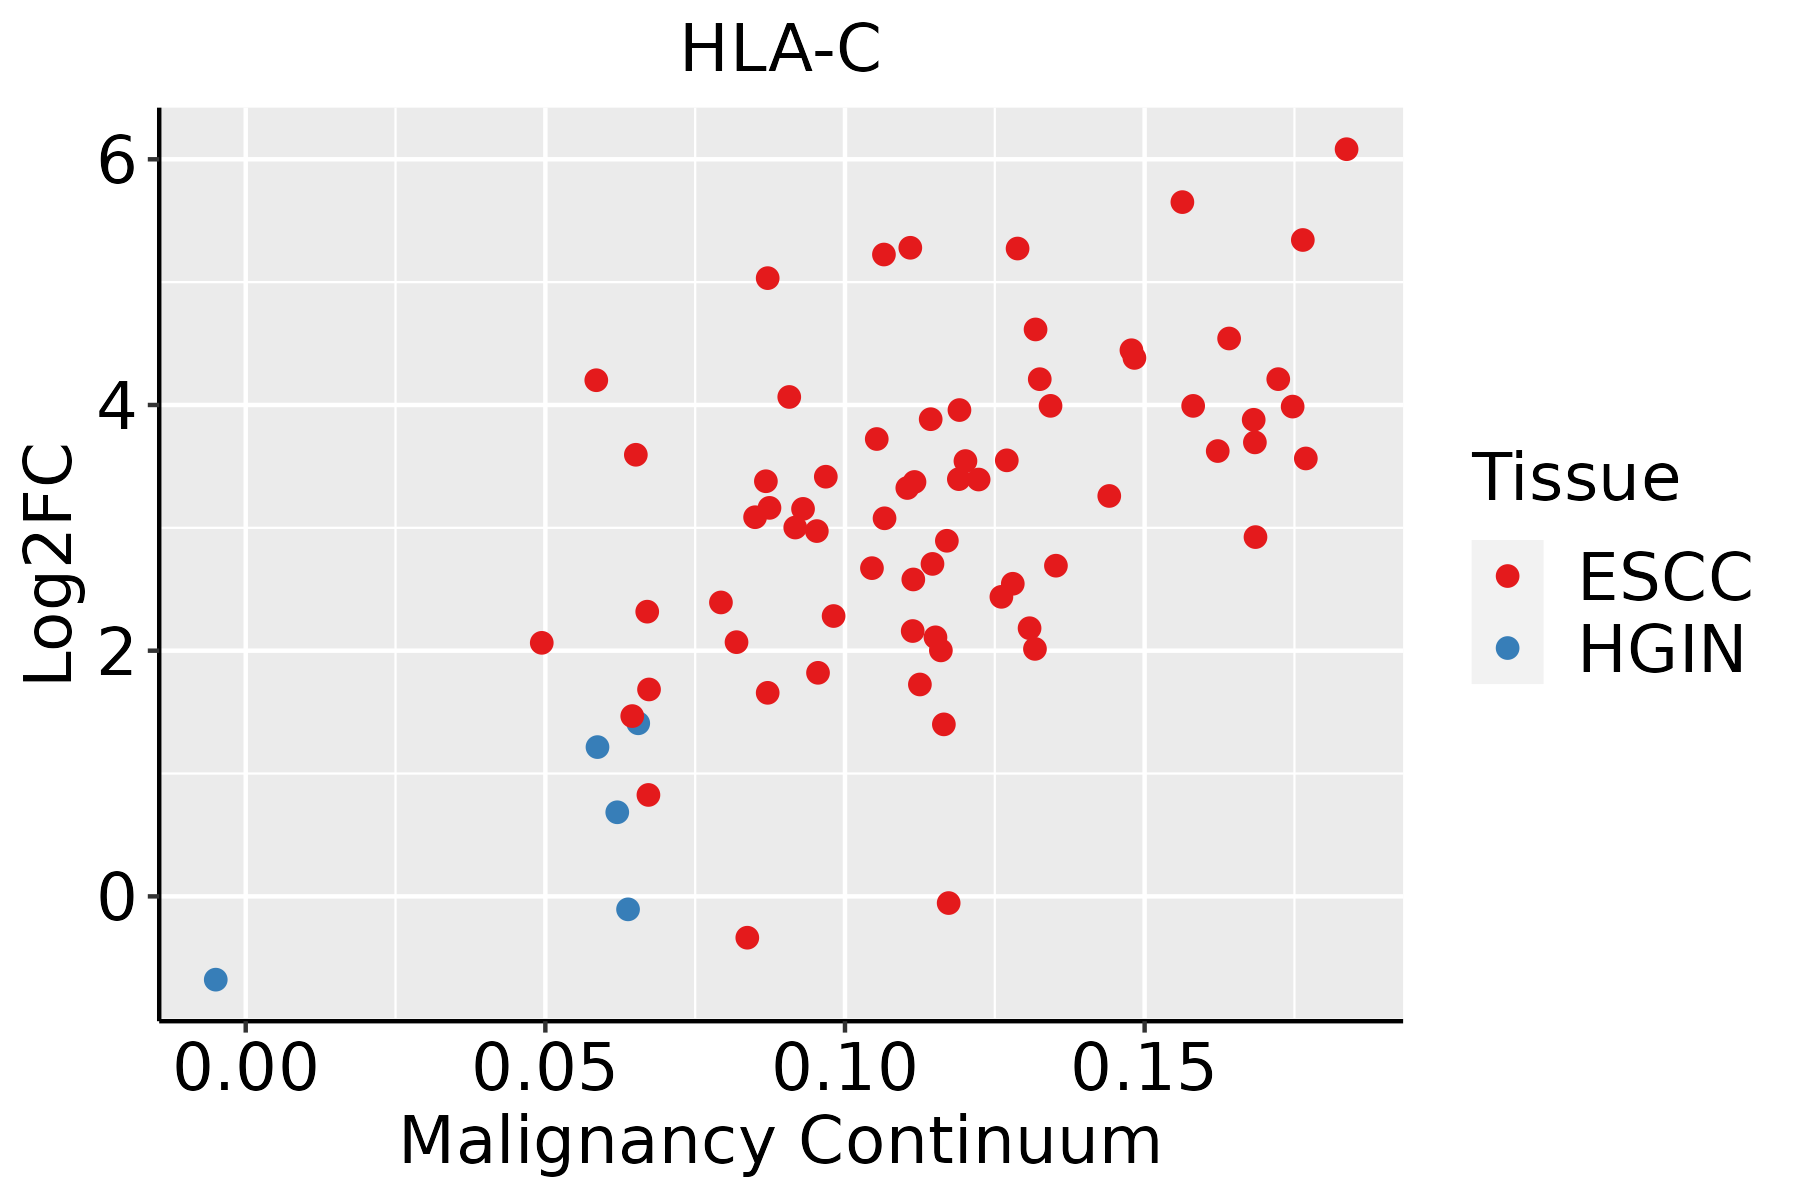 | ESCC: Esophageal squamous cell carcinoma |
| HGIN: High-grade intraepithelial neoplasias |
| LGIN: Low-grade intraepithelial neoplasias |
| GC |  | CAG: Chronic atrophic gastritis |
| CAG with IM: Chronic atrophic gastritis with intestinal metaplasia |
| CSG: Chronic superficial gastritis |
| GC: Gastric cancer |
| SIM: Severe intestinal metaplasia |
| WIM: Wild intestinal metaplasia |
| Liver |  | HCC: Hepatocellular carcinoma |
| NAFLD: Non-alcoholic fatty liver disease |
| Lung |  | AAH: Atypical adenomatous hyperplasia |
| AIS: Adenocarcinoma in situ |
| IAC: Invasive lung adenocarcinoma |
| MIA: Minimally invasive adenocarcinoma |
| Oral Cavity | 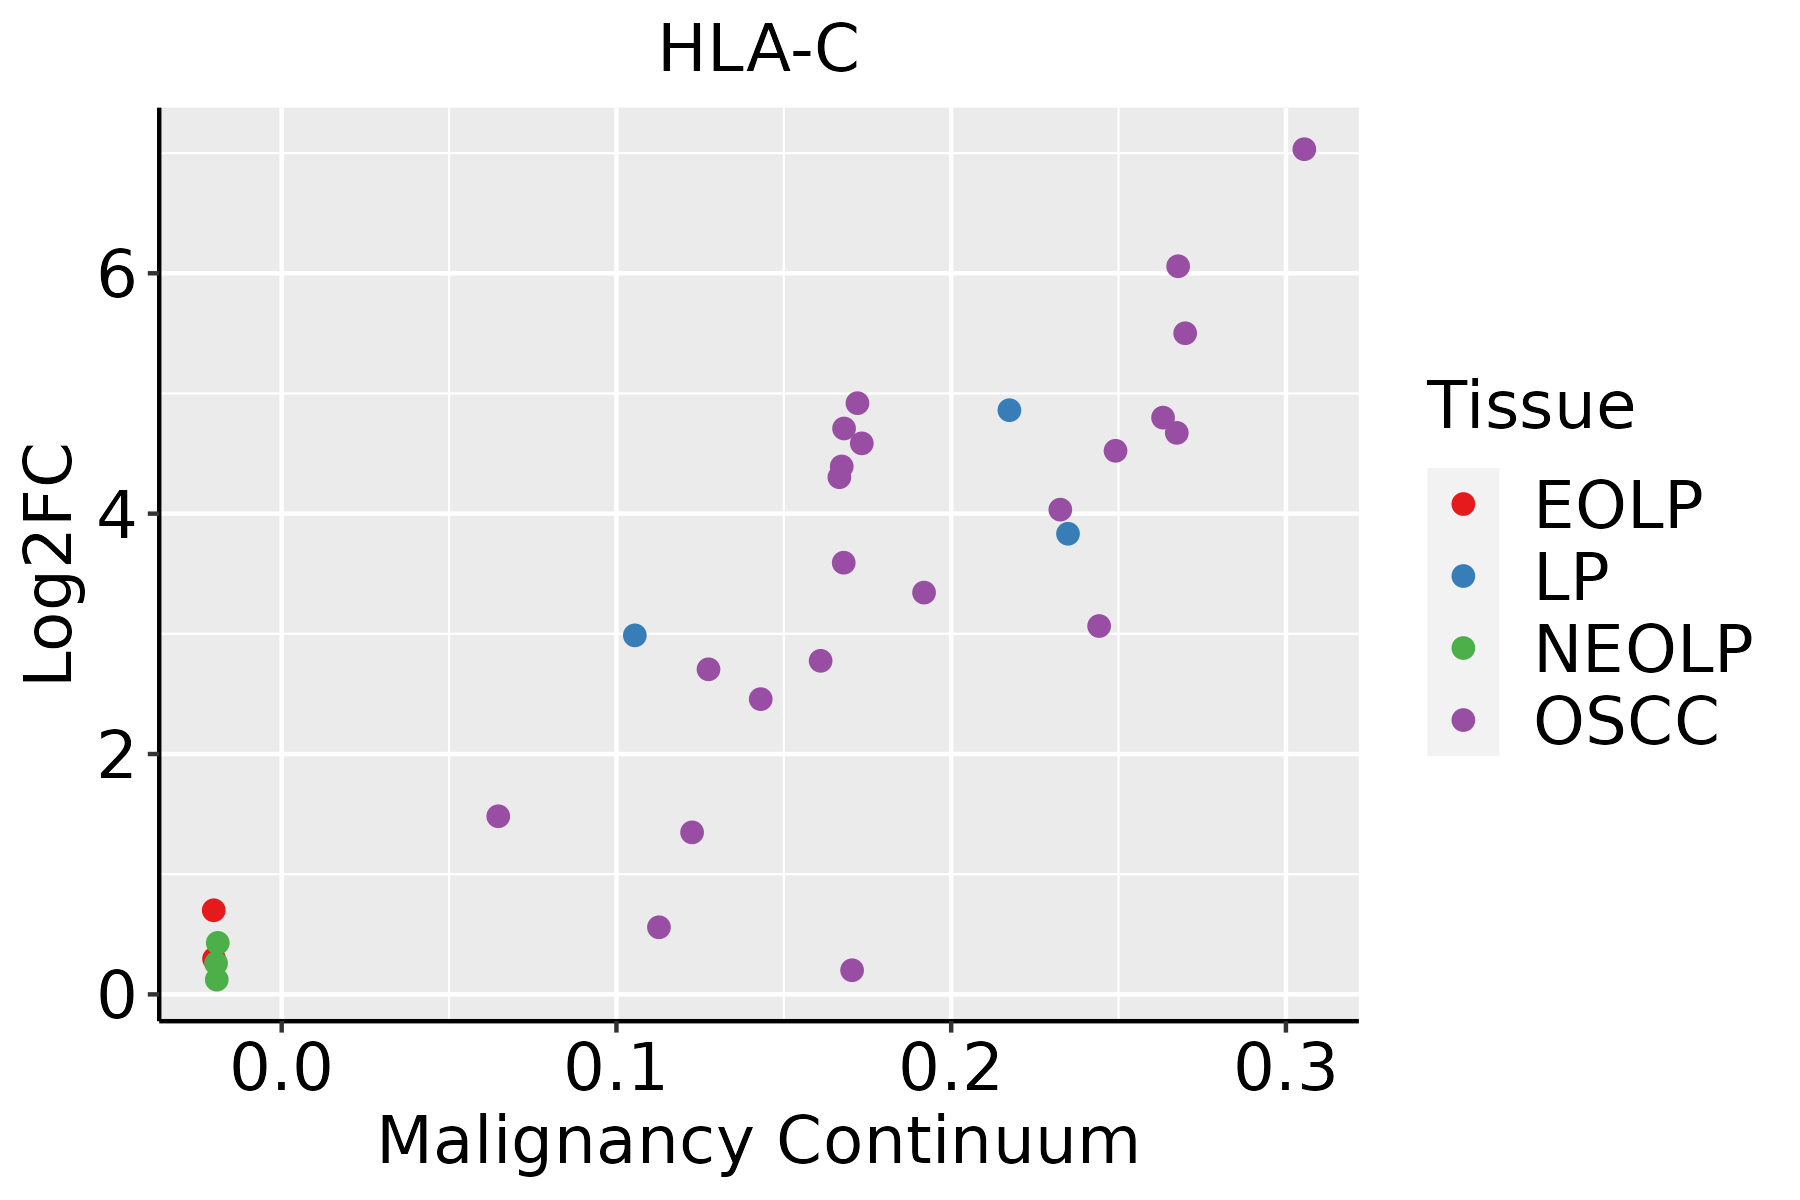 | EOLP: Erosive Oral lichen planus |
| LP: leukoplakia |
| NEOLP: Non-erosive oral lichen planus |
| OSCC: Oral squamous cell carcinoma |
| Prostate | 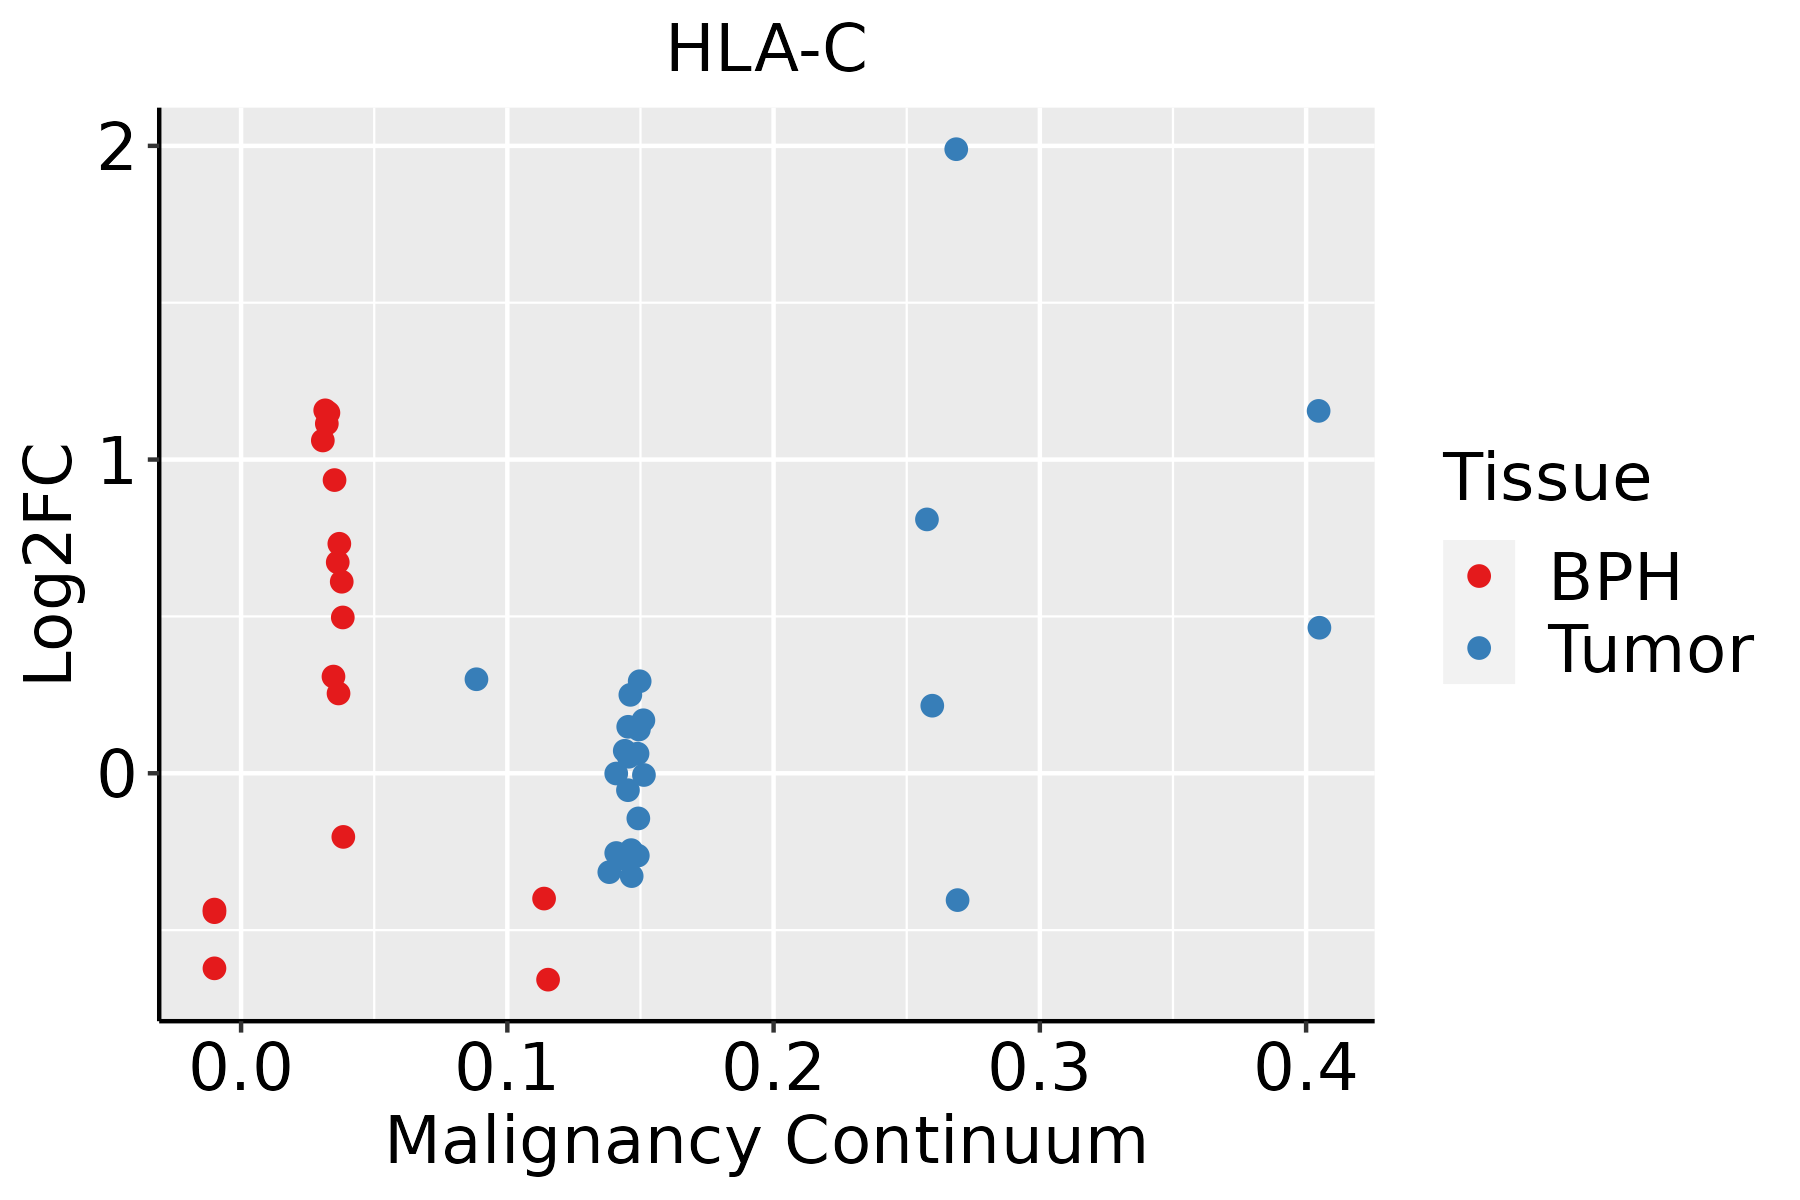 | BPH: Benign Prostatic Hyperplasia |
| Skin | 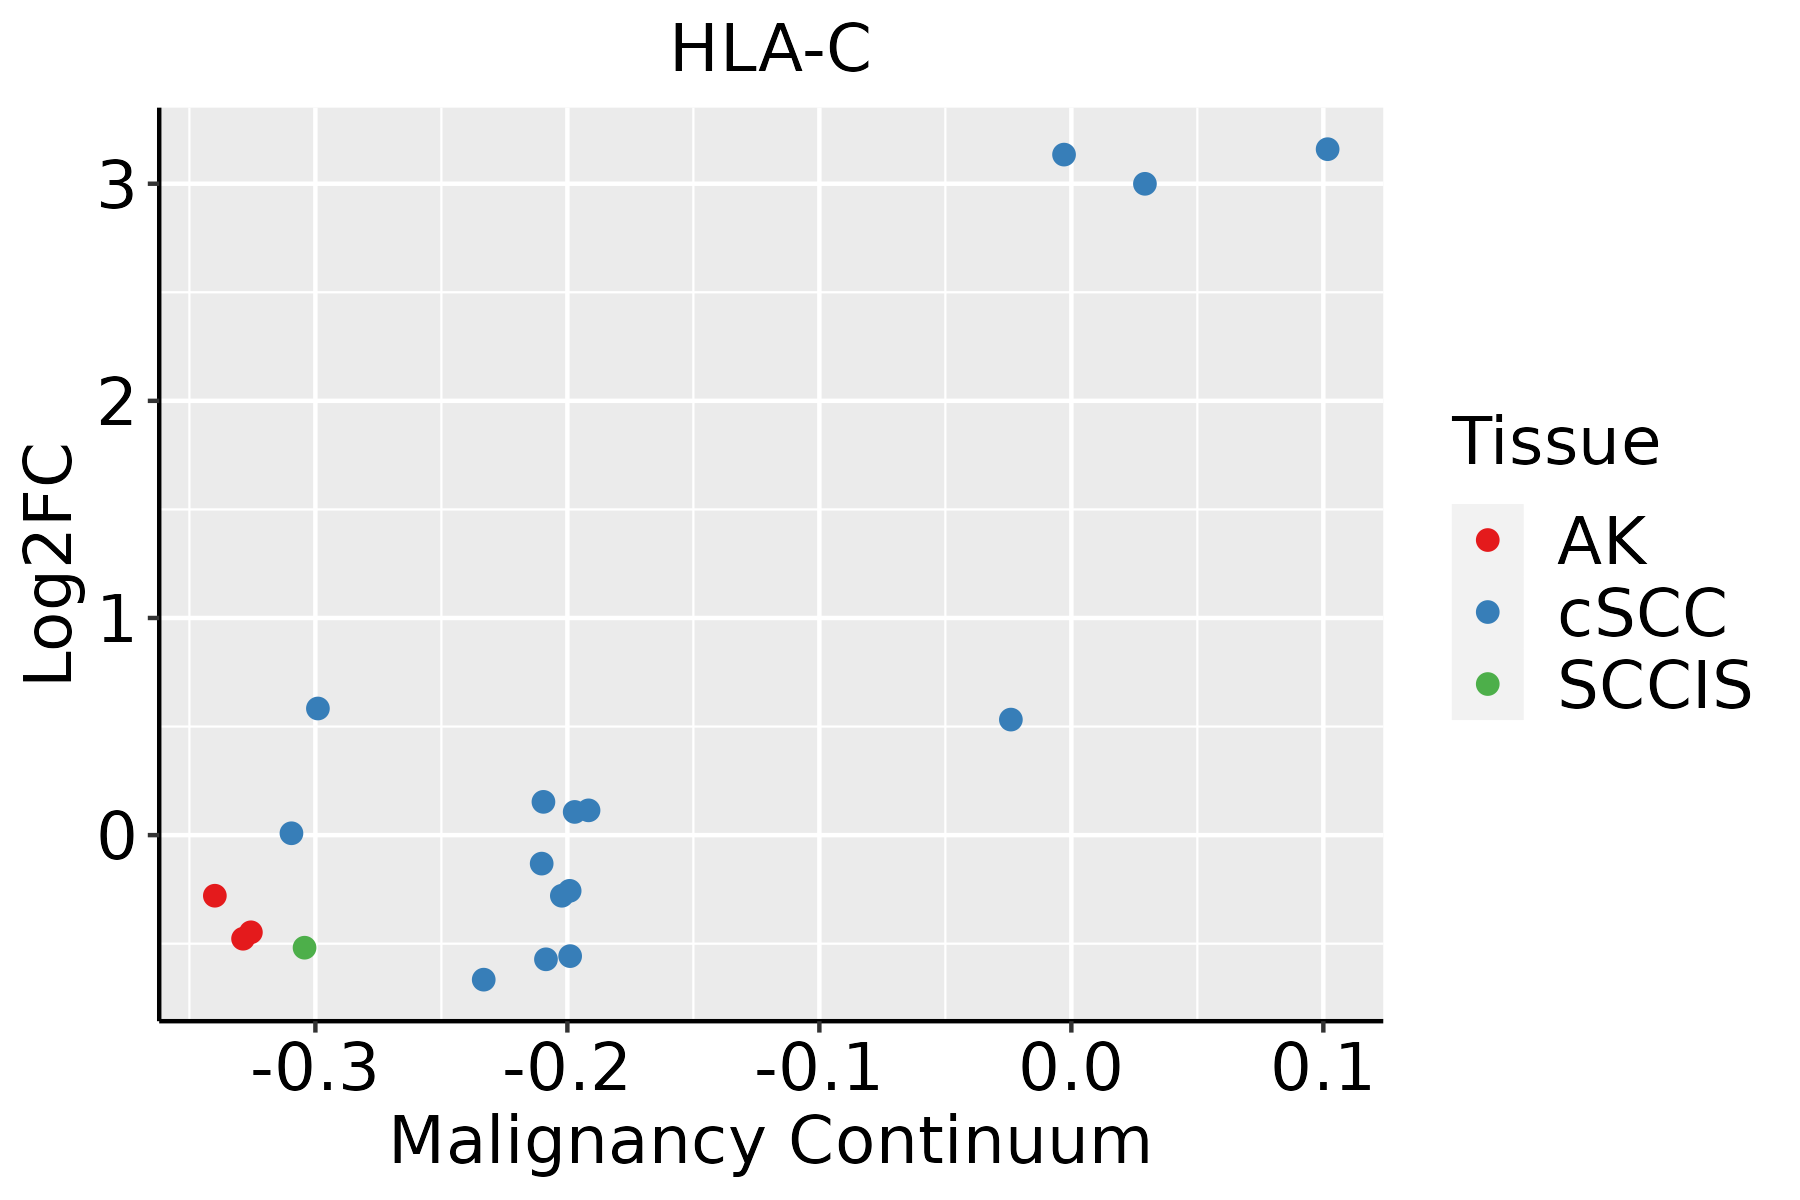 | AK: Actinic keratosis |
| cSCC: Cutaneous squamous cell carcinoma |
| SCCIS:squamous cell carcinoma in situ |
| Thyroid | 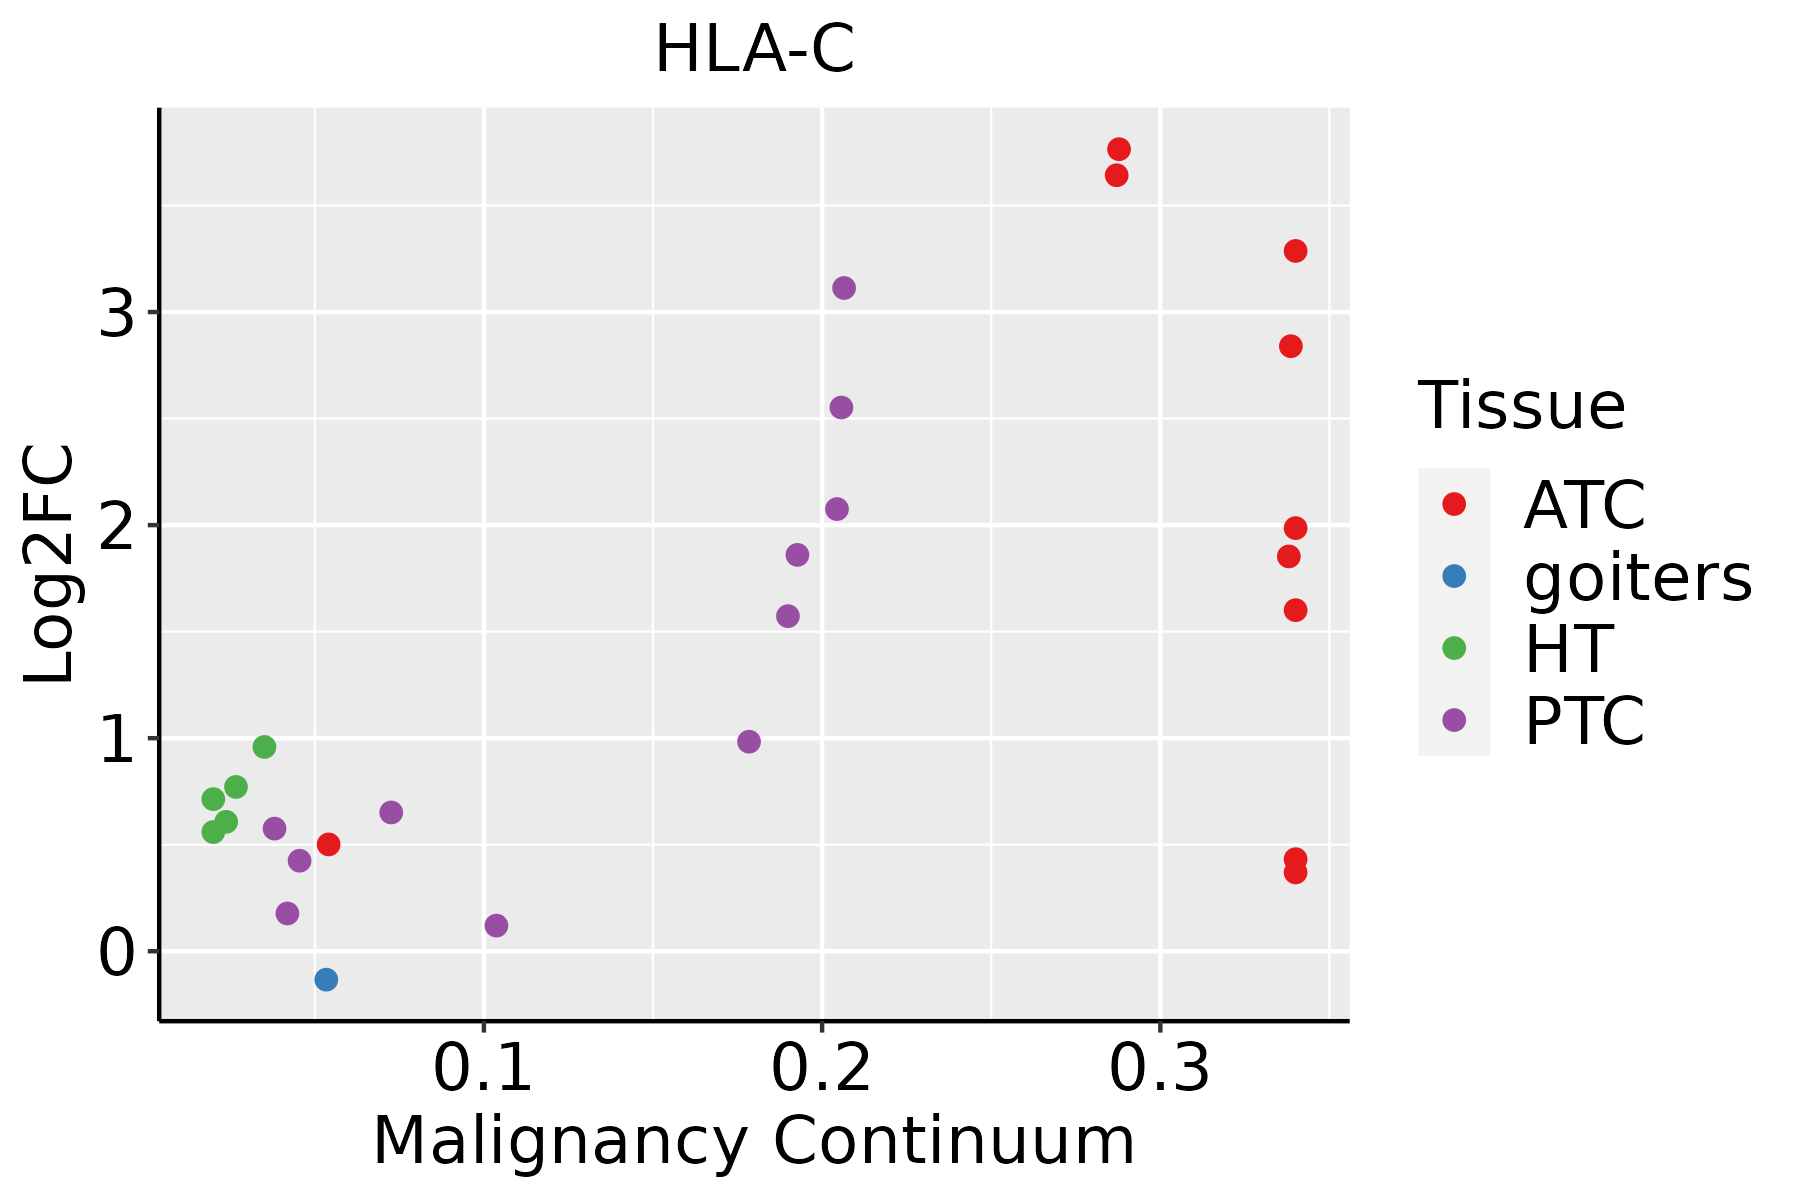 | ATC: Anaplastic thyroid cancer |
| HT: Hashimoto's thyroiditis |
| PTC: Papillary thyroid cancer |
| GO ID | Tissue | Disease Stage | Description | Gene Ratio | Bg Ratio | pvalue | p.adjust | Count |
| GO:001988324 | Oral cavity | EOLP | antigen processing and presentation of endogenous antigen | 11/2218 | 26/18723 | 8.86e-05 | 1.04e-03 | 11 |
| GO:001988232 | Oral cavity | NEOLP | antigen processing and presentation | 23/2005 | 106/18723 | 7.22e-04 | 5.93e-03 | 23 |
| GO:001988332 | Oral cavity | NEOLP | antigen processing and presentation of endogenous antigen | 9/2005 | 26/18723 | 1.04e-03 | 7.95e-03 | 9 |
| GO:001988532 | Oral cavity | NEOLP | antigen processing and presentation of endogenous peptide antigen via MHC class I | 7/2005 | 17/18723 | 1.18e-03 | 8.72e-03 | 7 |
| GO:000248332 | Oral cavity | NEOLP | antigen processing and presentation of endogenous peptide antigen | 7/2005 | 19/18723 | 2.51e-03 | 1.59e-02 | 7 |
| GO:000247431 | Oral cavity | NEOLP | antigen processing and presentation of peptide antigen via MHC class I | 8/2005 | 28/18723 | 7.44e-03 | 3.73e-02 | 8 |
| GO:000248318 | Prostate | BPH | antigen processing and presentation of endogenous peptide antigen | 11/3107 | 19/18723 | 5.28e-05 | 5.42e-04 | 11 |
| GO:001988218 | Prostate | BPH | antigen processing and presentation | 33/3107 | 106/18723 | 1.55e-04 | 1.36e-03 | 33 |
| GO:000247414 | Prostate | BPH | antigen processing and presentation of peptide antigen via MHC class I | 13/3107 | 28/18723 | 2.22e-04 | 1.78e-03 | 13 |
| GO:004800217 | Prostate | BPH | antigen processing and presentation of peptide antigen | 22/3107 | 62/18723 | 2.45e-04 | 1.94e-03 | 22 |
| GO:001988317 | Prostate | BPH | antigen processing and presentation of endogenous antigen | 12/3107 | 26/18723 | 4.14e-04 | 3.01e-03 | 12 |
| GO:001988515 | Prostate | BPH | antigen processing and presentation of endogenous peptide antigen via MHC class I | 9/3107 | 17/18723 | 6.38e-04 | 4.33e-03 | 9 |
| GO:000248319 | Prostate | Tumor | antigen processing and presentation of endogenous peptide antigen | 12/3246 | 19/18723 | 1.09e-05 | 1.56e-04 | 12 |
| GO:001988219 | Prostate | Tumor | antigen processing and presentation | 35/3246 | 106/18723 | 6.46e-05 | 6.99e-04 | 35 |
| GO:000247415 | Prostate | Tumor | antigen processing and presentation of peptide antigen via MHC class I | 14/3246 | 28/18723 | 7.53e-05 | 7.86e-04 | 14 |
| GO:001988318 | Prostate | Tumor | antigen processing and presentation of endogenous antigen | 13/3246 | 26/18723 | 1.36e-04 | 1.26e-03 | 13 |
| GO:001988516 | Prostate | Tumor | antigen processing and presentation of endogenous peptide antigen via MHC class I | 10/3246 | 17/18723 | 1.43e-04 | 1.31e-03 | 10 |
| GO:004800218 | Prostate | Tumor | antigen processing and presentation of peptide antigen | 23/3246 | 62/18723 | 1.62e-04 | 1.46e-03 | 23 |
| GO:001988226 | Skin | AK | antigen processing and presentation | 22/1910 | 106/18723 | 9.13e-04 | 7.49e-03 | 22 |
| GO:004800225 | Skin | AK | antigen processing and presentation of peptide antigen | 14/1910 | 62/18723 | 3.32e-03 | 2.03e-02 | 14 |
| Pathway ID | Tissue | Disease Stage | Description | Gene Ratio | Bg Ratio | pvalue | p.adjust | qvalue | Count |
| hsa0516718 | Breast | Precancer | Kaposi sarcoma-associated herpesvirus infection | 36/684 | 194/8465 | 1.68e-06 | 2.53e-05 | 1.94e-05 | 36 |
| hsa0461218 | Breast | Precancer | Antigen processing and presentation | 19/684 | 78/8465 | 9.61e-06 | 1.12e-04 | 8.62e-05 | 19 |
| hsa0516918 | Breast | Precancer | Epstein-Barr virus infection | 35/684 | 202/8465 | 1.15e-05 | 1.26e-04 | 9.64e-05 | 35 |
| hsa042189 | Breast | Precancer | Cellular senescence | 29/684 | 156/8465 | 1.66e-05 | 1.69e-04 | 1.30e-04 | 29 |
| hsa0414518 | Breast | Precancer | Phagosome | 27/684 | 152/8465 | 7.37e-05 | 6.85e-04 | 5.25e-04 | 27 |
| hsa0541618 | Breast | Precancer | Viral myocarditis | 14/684 | 60/8465 | 2.32e-04 | 1.98e-03 | 1.52e-03 | 14 |
| hsa0516618 | Breast | Precancer | Human T-cell leukemia virus 1 infection | 33/684 | 222/8465 | 4.29e-04 | 3.31e-03 | 2.53e-03 | 33 |
| hsa0516316 | Breast | Precancer | Human cytomegalovirus infection | 32/684 | 225/8465 | 1.13e-03 | 7.57e-03 | 5.80e-03 | 32 |
| hsa052036 | Breast | Precancer | Viral carcinogenesis | 27/684 | 204/8465 | 7.19e-03 | 4.06e-02 | 3.11e-02 | 27 |
| hsa0516719 | Breast | Precancer | Kaposi sarcoma-associated herpesvirus infection | 36/684 | 194/8465 | 1.68e-06 | 2.53e-05 | 1.94e-05 | 36 |
| hsa0461219 | Breast | Precancer | Antigen processing and presentation | 19/684 | 78/8465 | 9.61e-06 | 1.12e-04 | 8.62e-05 | 19 |
| hsa0516919 | Breast | Precancer | Epstein-Barr virus infection | 35/684 | 202/8465 | 1.15e-05 | 1.26e-04 | 9.64e-05 | 35 |
| hsa0421814 | Breast | Precancer | Cellular senescence | 29/684 | 156/8465 | 1.66e-05 | 1.69e-04 | 1.30e-04 | 29 |
| hsa0414519 | Breast | Precancer | Phagosome | 27/684 | 152/8465 | 7.37e-05 | 6.85e-04 | 5.25e-04 | 27 |
| hsa0541619 | Breast | Precancer | Viral myocarditis | 14/684 | 60/8465 | 2.32e-04 | 1.98e-03 | 1.52e-03 | 14 |
| hsa0516619 | Breast | Precancer | Human T-cell leukemia virus 1 infection | 33/684 | 222/8465 | 4.29e-04 | 3.31e-03 | 2.53e-03 | 33 |
| hsa0516317 | Breast | Precancer | Human cytomegalovirus infection | 32/684 | 225/8465 | 1.13e-03 | 7.57e-03 | 5.80e-03 | 32 |
| hsa0520312 | Breast | Precancer | Viral carcinogenesis | 27/684 | 204/8465 | 7.19e-03 | 4.06e-02 | 3.11e-02 | 27 |
| hsa0516922 | Breast | IDC | Epstein-Barr virus infection | 45/867 | 202/8465 | 3.16e-07 | 6.05e-06 | 4.52e-06 | 45 |
| hsa0461223 | Breast | IDC | Antigen processing and presentation | 24/867 | 78/8465 | 4.61e-07 | 8.33e-06 | 6.23e-06 | 24 |
| Hugo Symbol | Variant Class | Variant Classification | dbSNP RS | HGVSc | HGVSp | HGVSp Short | SWISSPROT | BIOTYPE | SIFT | PolyPhen | Tumor Sample Barcode | Tissue | Histology | Sex | Age | Stage | Therapy Types | Drugs | Outcome |
| HLA-C | SNV | Missense_Mutation | | c.575N>G | p.Leu192Arg | p.L192R | P10321 | protein_coding | deleterious_low_confidence(0) | probably_damaging(0.994) | TCGA-AR-A24S-01 | Breast | breast invasive carcinoma | Female | <65 | I/II | Hormone Therapy | anastrozole | SD |
| HLA-C | SNV | Missense_Mutation | novel | c.1008N>C | p.Lys336Asn | p.K336N | P10321 | protein_coding | deleterious_low_confidence(0.01) | probably_damaging(0.992) | TCGA-BH-A0B6-01 | Breast | breast invasive carcinoma | Female | <65 | I/II | Unknown | Unknown | SD |
| HLA-C | SNV | Missense_Mutation | | c.376N>C | p.Asp126His | p.D126H | P10321 | protein_coding | deleterious_low_confidence(0.01) | benign(0.028) | TCGA-MY-A5BD-01 | Cervix | cervical & endocervical cancer | Female | <65 | I/II | Chemotherapy | cisplatin | CR |
| HLA-C | SNV | Missense_Mutation | novel | c.493C>G | p.Gln165Glu | p.Q165E | P10321 | protein_coding | deleterious_low_confidence(0.01) | probably_damaging(0.984) | TCGA-UC-A7PF-01 | Cervix | cervical & endocervical cancer | Female | <65 | I/II | Unknown | Unknown | SD |
| HLA-C | SNV | Missense_Mutation | rs11547351 | c.296G>C | p.Arg99Pro | p.R99P | P10321 | protein_coding | deleterious_low_confidence(0.02) | probably_damaging(0.98) | TCGA-VS-A9UR-01 | Cervix | cervical & endocervical cancer | Female | <65 | I/II | Chemotherapy | cisplatin | PD |
| HLA-C | SNV | Missense_Mutation | novel | c.349N>G | p.His117Asp | p.H117D | P10321 | protein_coding | deleterious_low_confidence(0) | probably_damaging(0.999) | TCGA-ZJ-AAXT-01 | Cervix | cervical & endocervical cancer | Female | <65 | III/IV | Unknown | Unknown | SD |
| HLA-C | SNV | Missense_Mutation | | c.425A>C | p.Tyr142Ser | p.Y142S | P10321 | protein_coding | deleterious_low_confidence(0) | probably_damaging(1) | TCGA-A6-5665-01 | Colorectum | colon adenocarcinoma | Female | >=65 | I/II | Unknown | Unknown | PD |
| HLA-C | SNV | Missense_Mutation | | c.773N>T | p.Arg258Met | p.R258M | P10321 | protein_coding | deleterious_low_confidence(0) | probably_damaging(1) | TCGA-AA-3672-01 | Colorectum | colon adenocarcinoma | Female | >=65 | III/IV | Unknown | Unknown | SD |
| HLA-C | SNV | Missense_Mutation | rs281860353 | c.170N>C | p.Phe57Ser | p.F57S | P10321 | protein_coding | deleterious_low_confidence(0) | probably_damaging(0.999) | TCGA-AA-3947-01 | Colorectum | colon adenocarcinoma | Female | <65 | I/II | Unknown | Unknown | SD |
| HLA-C | SNV | Missense_Mutation | rs281860449 | c.367N>C | p.Ser123Pro | p.S123P | P10321 | protein_coding | deleterious_low_confidence(0.01) | benign(0.174) | TCGA-AD-5900-01 | Colorectum | colon adenocarcinoma | Male | >=65 | I/II | Unknown | Unknown | SD |
| Entrez ID | Symbol | Category | Interaction Types | Drug Claim Name | Drug Name | PMIDs |
| 3107 | HLA-C | CELL SURFACE, CLINICALLY ACTIONABLE, DRUGGABLE GENOME, DRUG RESISTANCE | | flucloxacillin | FLOXACILLIN | 30664875 |
| 3107 | HLA-C | CELL SURFACE, CLINICALLY ACTIONABLE, DRUGGABLE GENOME, DRUG RESISTANCE | | peginterferon alfa-2b | | |
| 3107 | HLA-C | CELL SURFACE, CLINICALLY ACTIONABLE, DRUGGABLE GENOME, DRUG RESISTANCE | | THERAPEUTIC TUMOR INFILTRATING LYMPHOCYTES | | 27959684 |
| 3107 | HLA-C | CELL SURFACE, CLINICALLY ACTIONABLE, DRUGGABLE GENOME, DRUG RESISTANCE | | clavulanate | CLAVULANIC ACID | 30664875 |
| 3107 | HLA-C | CELL SURFACE, CLINICALLY ACTIONABLE, DRUGGABLE GENOME, DRUG RESISTANCE | | amoxicillin | AMOXICILLIN | 30664875 |
| 3107 | HLA-C | CELL SURFACE, CLINICALLY ACTIONABLE, DRUGGABLE GENOME, DRUG RESISTANCE | | Drugs For Treatment Of Tuberculosis | | 23153709 |
| 3107 | HLA-C | CELL SURFACE, CLINICALLY ACTIONABLE, DRUGGABLE GENOME, DRUG RESISTANCE | | methotrexate | METHOTREXATE | 28444425 |
| 3107 | HLA-C | CELL SURFACE, CLINICALLY ACTIONABLE, DRUGGABLE GENOME, DRUG RESISTANCE | | ribavirin | RIBAVIRIN | |
| 3107 | HLA-C | CELL SURFACE, CLINICALLY ACTIONABLE, DRUGGABLE GENOME, DRUG RESISTANCE | | ustekinumab | USTEKINUMAB | 23521149 |
| 3107 | HLA-C | CELL SURFACE, CLINICALLY ACTIONABLE, DRUGGABLE GENOME, DRUG RESISTANCE | | clozapine | CLOZAPINE | 11266078 |


