
|
|||||
|
 | |
| |
| |
| |
| |
| |
|
Gene: GSK3A |
Gene summary for GSK3A |
| Gene information | Species | Human | Gene symbol | GSK3A | Gene ID | 2931 |
| Gene name | glycogen synthase kinase 3 alpha | |
| Gene Alias | GSK3A | |
| Cytomap | 19q13.2 | |
| Gene Type | protein-coding | GO ID | GO:0000271 | UniProtAcc | A0A024R0L5 |
Top |
Malignant transformation analysis |
| Identification of the aberrant gene expression in precancerous and cancerous lesions by comparing the gene expression of stem-like cells in diseased tissues with normal stem cells |
| Entrez ID | Symbol | Replicates | Species | Organ | Tissue | Adj P-value | Log2FC | Malignancy |
| 2931 | GSK3A | HTA11_3410_2000001011 | Human | Colorectum | AD | 1.84e-09 | 1.58e-01 | 0.0155 |
| 2931 | GSK3A | HTA11_2487_2000001011 | Human | Colorectum | SER | 5.13e-13 | 3.51e-01 | -0.1808 |
| 2931 | GSK3A | HTA11_1938_2000001011 | Human | Colorectum | AD | 3.26e-09 | 2.84e-01 | -0.0811 |
| 2931 | GSK3A | HTA11_78_2000001011 | Human | Colorectum | AD | 2.14e-07 | 1.99e-01 | -0.1088 |
| 2931 | GSK3A | HTA11_347_2000001011 | Human | Colorectum | AD | 2.97e-12 | 2.30e-01 | -0.1954 |
| 2931 | GSK3A | HTA11_411_2000001011 | Human | Colorectum | SER | 4.21e-05 | 4.02e-01 | -0.2602 |
| 2931 | GSK3A | HTA11_2112_2000001011 | Human | Colorectum | SER | 1.40e-07 | 4.17e-01 | -0.2196 |
| 2931 | GSK3A | HTA11_3361_2000001011 | Human | Colorectum | AD | 1.43e-09 | 2.84e-01 | -0.1207 |
| 2931 | GSK3A | HTA11_83_2000001011 | Human | Colorectum | SER | 7.70e-11 | 2.99e-01 | -0.1526 |
| 2931 | GSK3A | HTA11_696_2000001011 | Human | Colorectum | AD | 1.54e-14 | 3.39e-01 | -0.1464 |
| 2931 | GSK3A | HTA11_866_2000001011 | Human | Colorectum | AD | 2.19e-05 | 2.24e-01 | -0.1001 |
| 2931 | GSK3A | HTA11_1391_2000001011 | Human | Colorectum | AD | 8.21e-17 | 3.69e-01 | -0.059 |
| 2931 | GSK3A | HTA11_2992_2000001011 | Human | Colorectum | SER | 3.05e-09 | 5.10e-01 | -0.1706 |
| 2931 | GSK3A | HTA11_5212_2000001011 | Human | Colorectum | AD | 2.06e-04 | 2.01e-01 | -0.2061 |
| 2931 | GSK3A | HTA11_546_2000001011 | Human | Colorectum | AD | 1.33e-04 | 2.09e-01 | -0.0842 |
| 2931 | GSK3A | HTA11_9341_2000001011 | Human | Colorectum | SER | 1.18e-02 | 2.95e-01 | -0.00410000000000005 |
| 2931 | GSK3A | HTA11_866_3004761011 | Human | Colorectum | AD | 2.56e-08 | 2.03e-01 | 0.096 |
| 2931 | GSK3A | HTA11_7663_2000001011 | Human | Colorectum | SER | 1.99e-03 | 2.74e-01 | 0.0131 |
| 2931 | GSK3A | HTA11_10623_2000001011 | Human | Colorectum | AD | 3.35e-02 | 1.90e-01 | -0.0177 |
| 2931 | GSK3A | HTA11_6801_2000001011 | Human | Colorectum | SER | 7.09e-04 | 3.23e-01 | 0.0171 |
| Page: 1 2 3 4 5 6 7 |
| Tissue | Expression Dynamics | Abbreviation |
| Colorectum (GSE201348) | 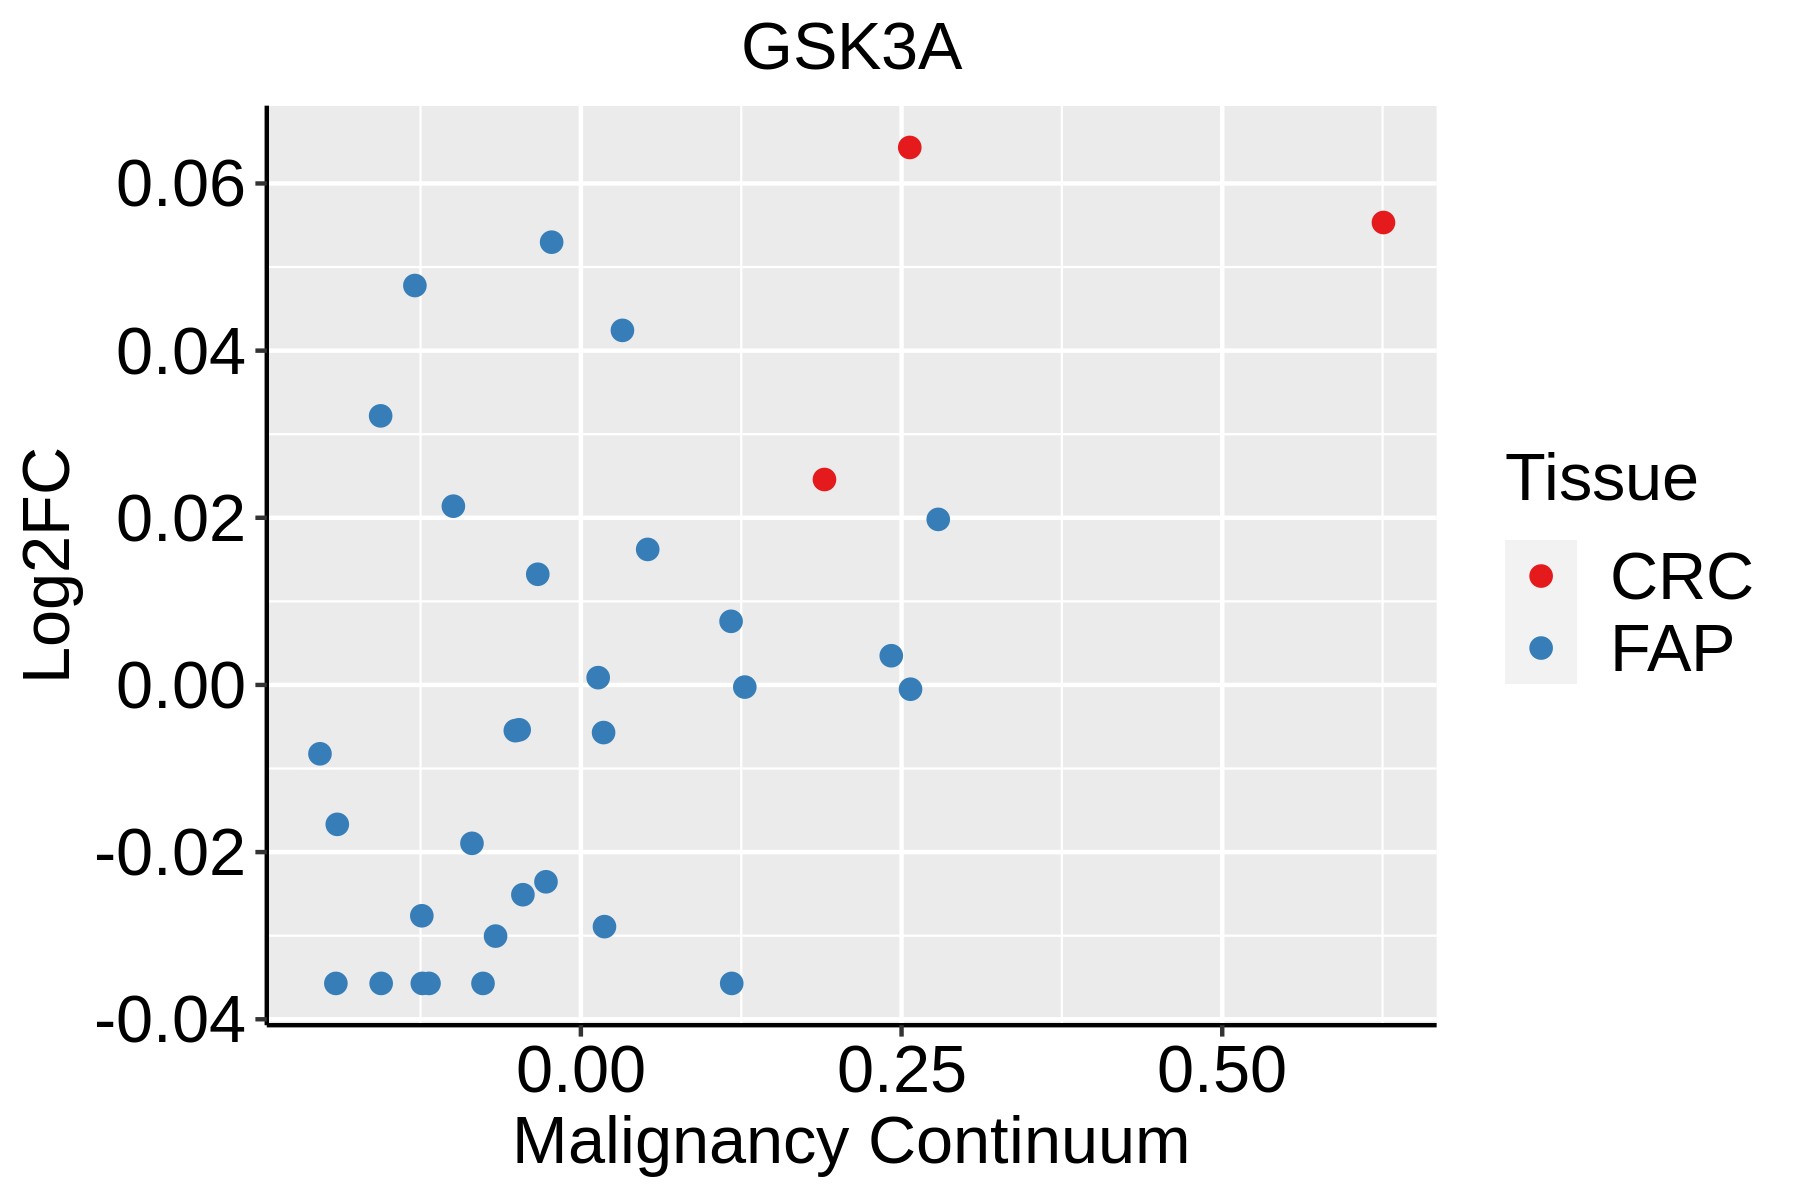 | FAP: Familial adenomatous polyposis |
| CRC: Colorectal cancer | ||
| Colorectum (HTA11) |  | AD: Adenomas |
| SER: Sessile serrated lesions | ||
| MSI-H: Microsatellite-high colorectal cancer | ||
| MSS: Microsatellite stable colorectal cancer | ||
| Esophagus | 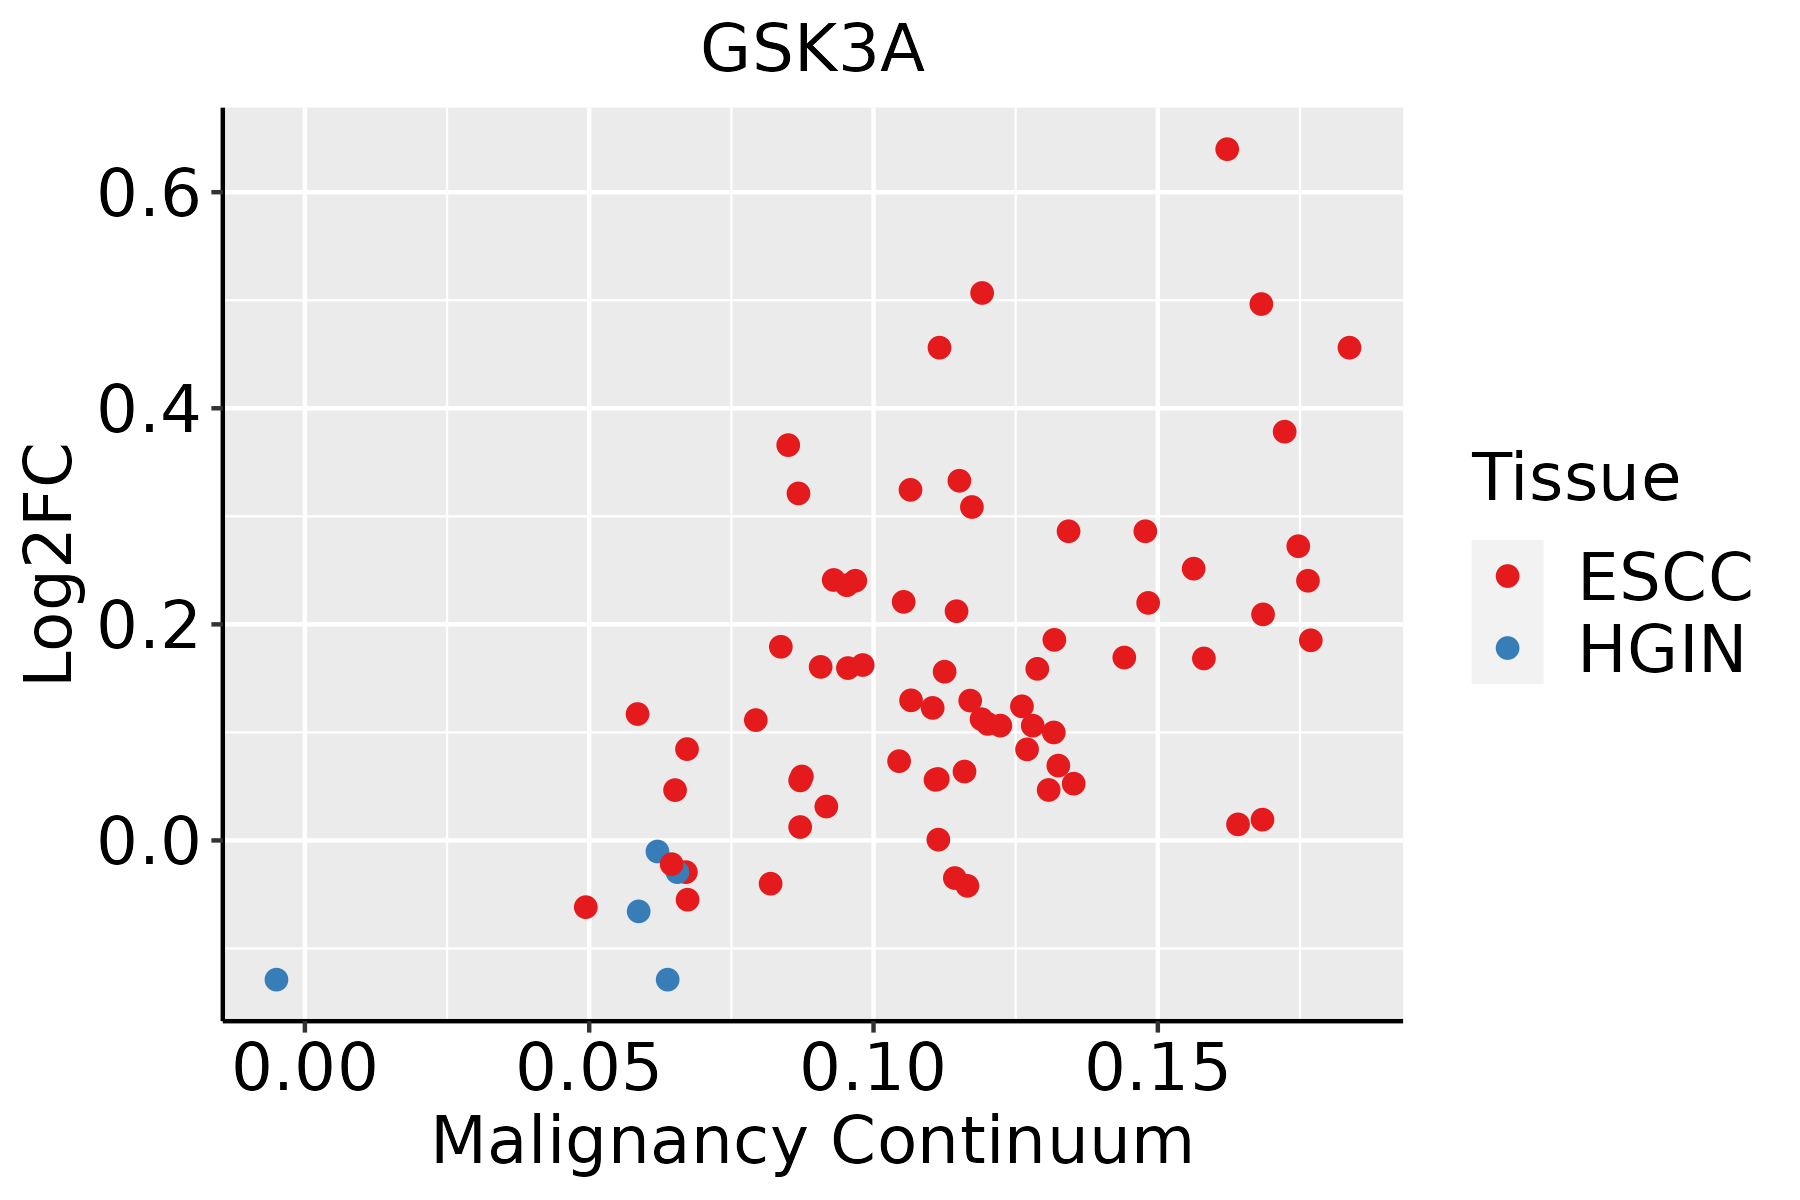 | ESCC: Esophageal squamous cell carcinoma |
| HGIN: High-grade intraepithelial neoplasias | ||
| LGIN: Low-grade intraepithelial neoplasias | ||
| Liver | 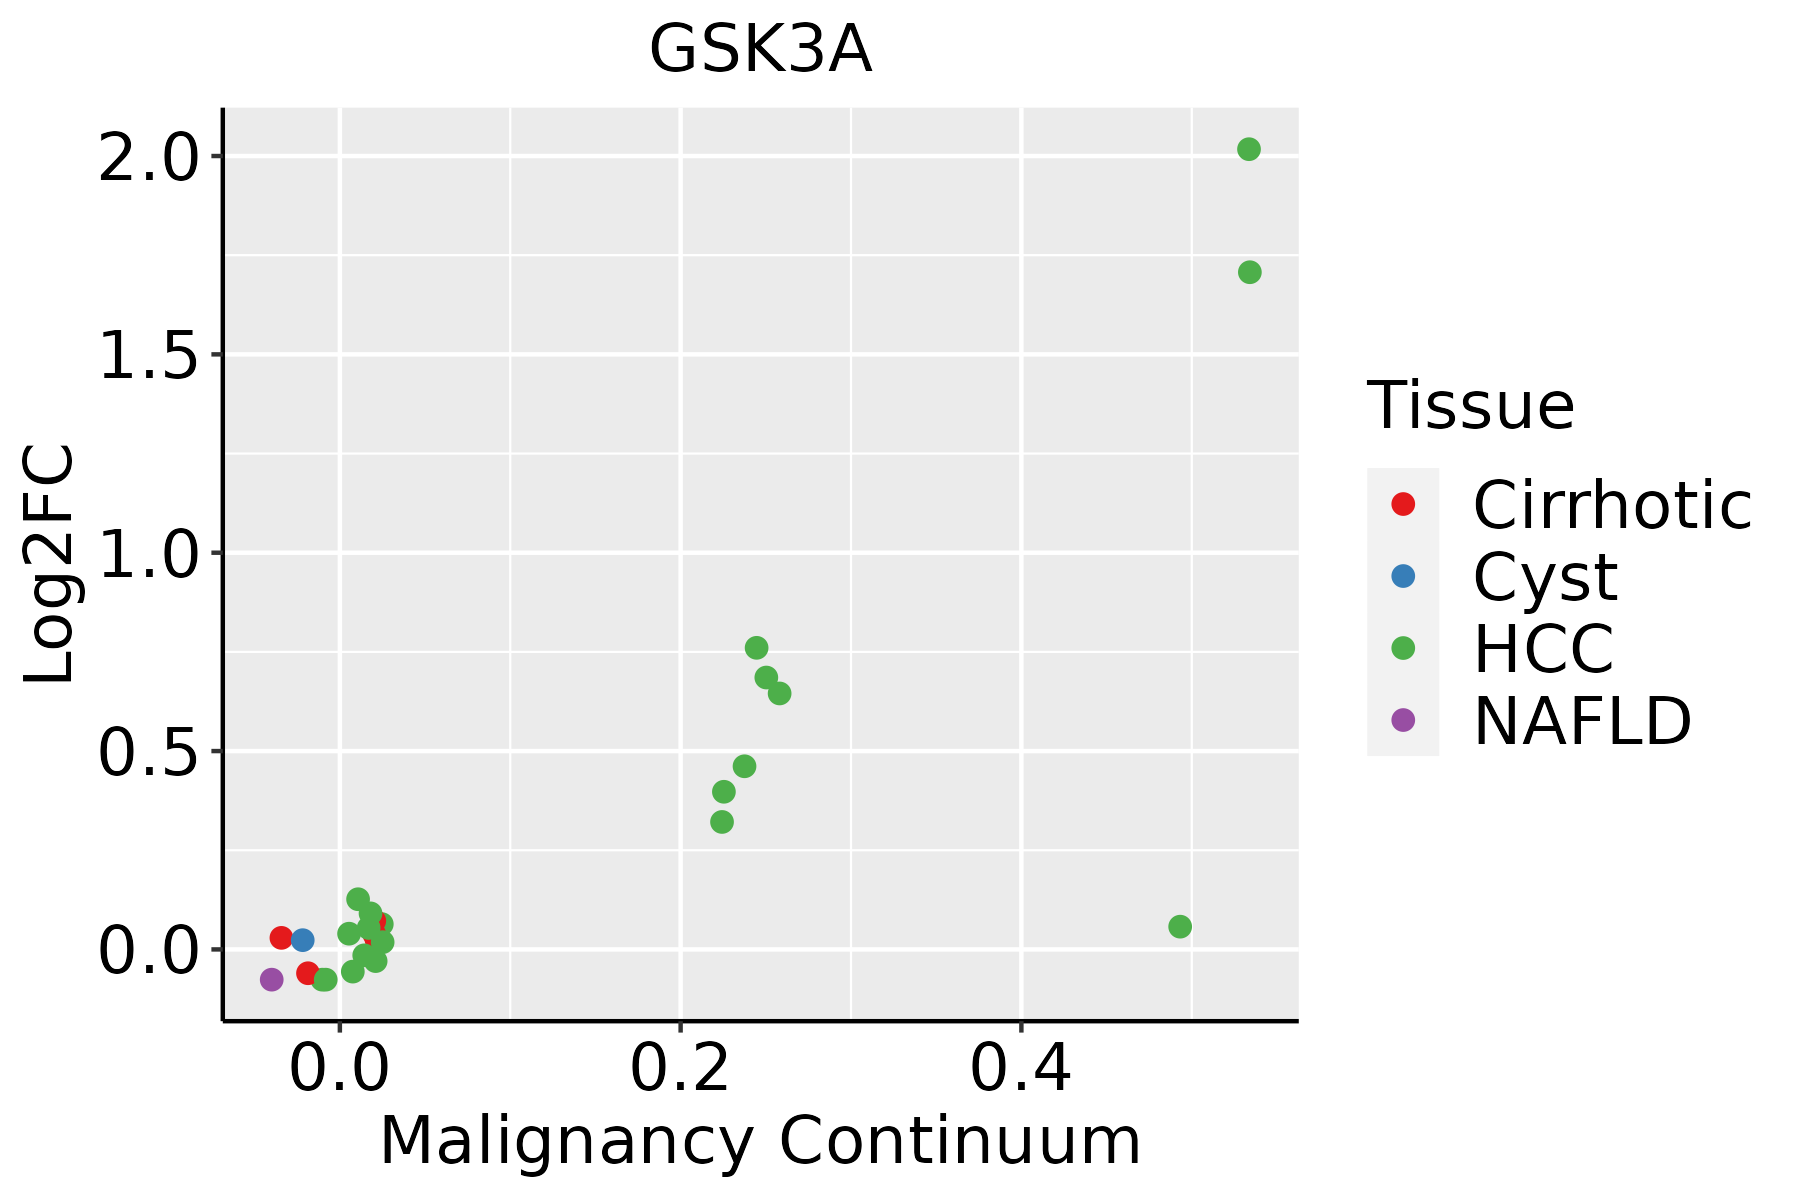 | HCC: Hepatocellular carcinoma |
| NAFLD: Non-alcoholic fatty liver disease | ||
| Oral Cavity | 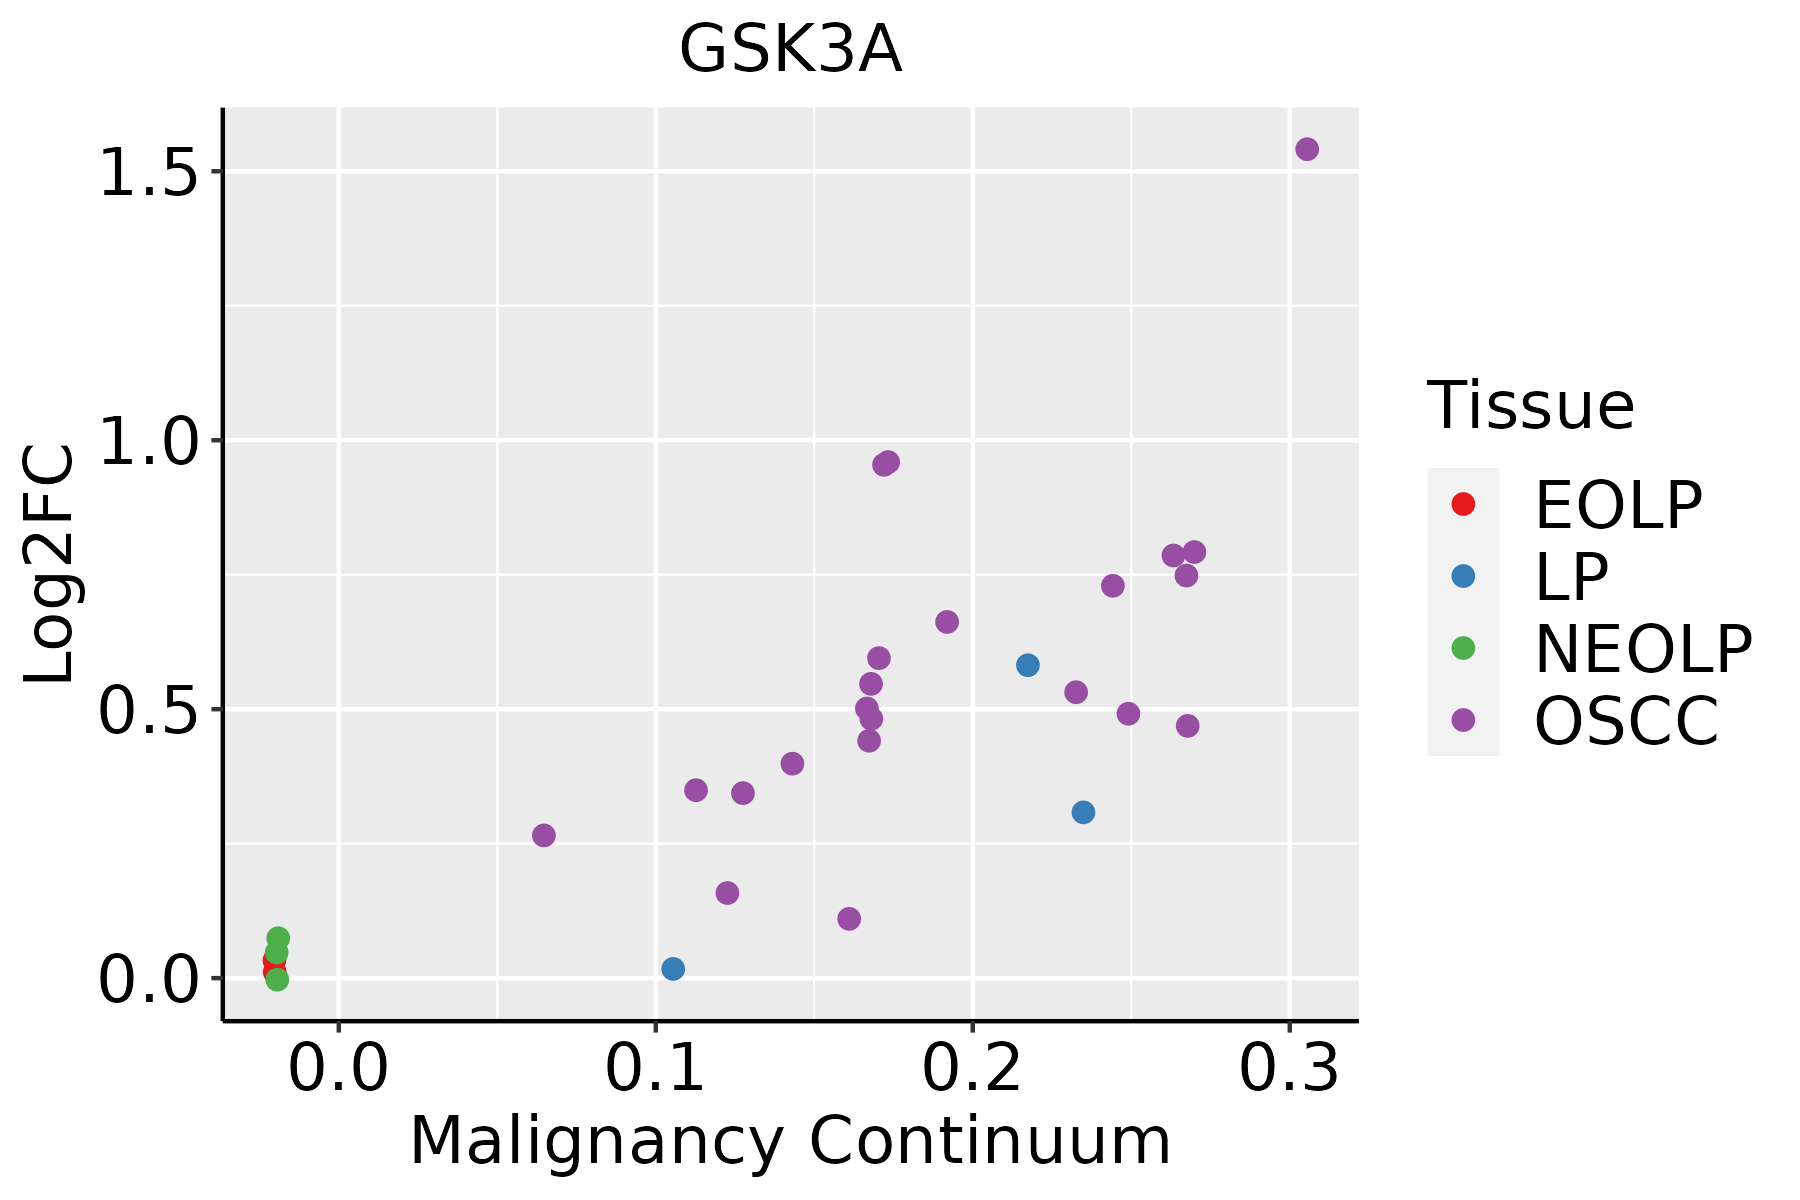 | EOLP: Erosive Oral lichen planus |
| LP: leukoplakia | ||
| NEOLP: Non-erosive oral lichen planus | ||
| OSCC: Oral squamous cell carcinoma | ||
| Thyroid | 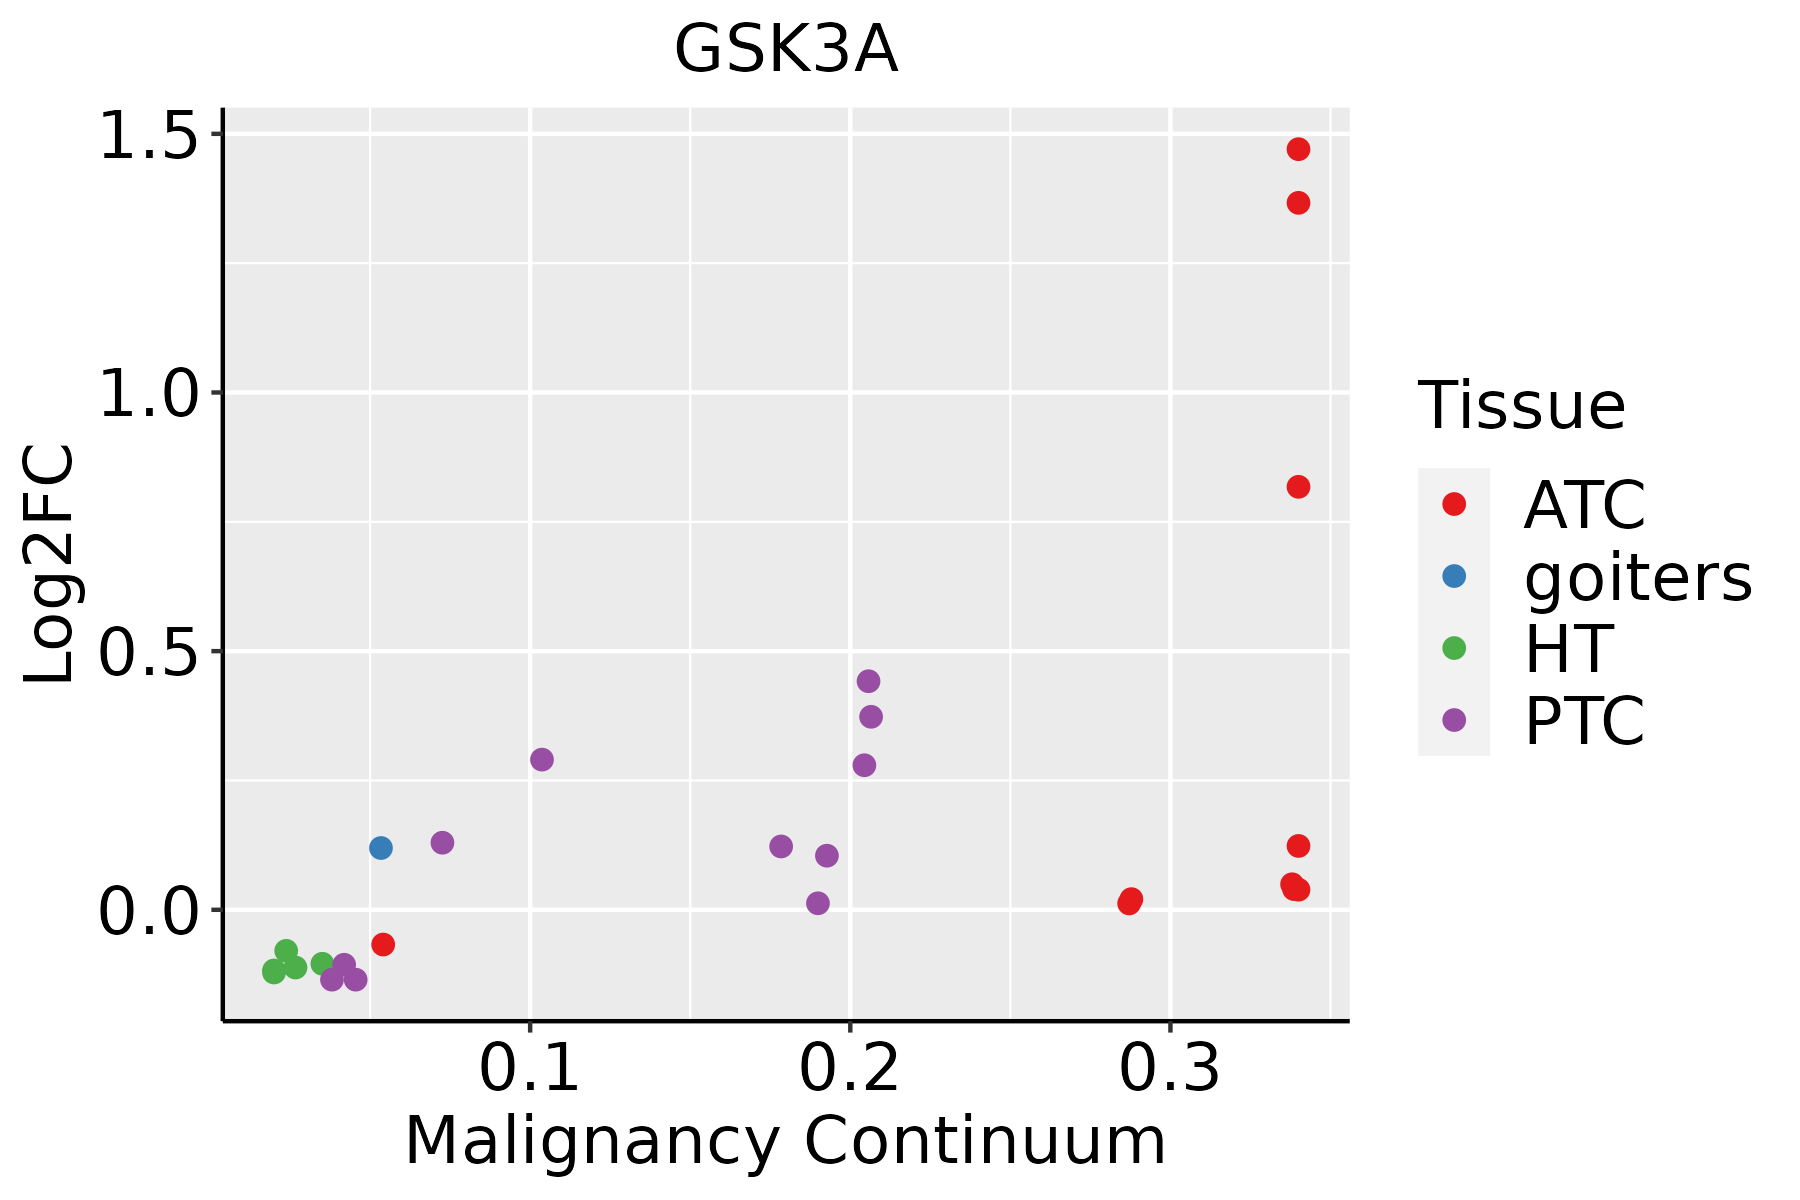 | ATC: Anaplastic thyroid cancer |
| HT: Hashimoto's thyroiditis | ||
| PTC: Papillary thyroid cancer |
| ∗log2FC in expression of this searched gene in stem-like cells from each diseased tissue sample relative to stem-like cells in normal samples in each tissue plotted against the malignancy continuum. Samples are colored based on if they are from different disease stage. |
Top |
Malignant transformation related pathway analysis |
| Find out the enriched GO biological processes and KEGG pathways involved in transition from healthy to precancer to cancer |
| Tissue | Disease Stage | Enriched GO biological Processes |
| Colorectum | AD |  |
| Colorectum | SER |  |
| Colorectum | MSS |  |
| Colorectum | MSI-H |  |
| Colorectum | FAP |  |
| ∗Top 15 enriched GO BP terms are showed in the bar plot of each disease state in each tissue. Each row represents a significant GO biological process which is colored according to the -log10(p.adjust). |
| Page: 1 2 3 4 5 6 7 8 9 |
| GO ID | Tissue | Disease Stage | Description | Gene Ratio | Bg Ratio | pvalue | p.adjust | Count |
| GO:0010977 | Colorectum | AD | negative regulation of neuron projection development | 43/3918 | 137/18723 | 2.60e-03 | 1.97e-02 | 43 |
| GO:0048588 | Colorectum | AD | developmental cell growth | 67/3918 | 234/18723 | 3.03e-03 | 2.25e-02 | 67 |
| GO:0018209 | Colorectum | AD | peptidyl-serine modification | 92/3918 | 338/18723 | 3.19e-03 | 2.36e-02 | 92 |
| GO:0016358 | Colorectum | AD | dendrite development | 69/3918 | 243/18723 | 3.32e-03 | 2.42e-02 | 69 |
| GO:0018107 | Colorectum | AD | peptidyl-threonine phosphorylation | 37/3918 | 116/18723 | 3.68e-03 | 2.61e-02 | 37 |
| GO:1901216 | Colorectum | AD | positive regulation of neuron death | 32/3918 | 97/18723 | 3.74e-03 | 2.63e-02 | 32 |
| GO:1903749 | Colorectum | AD | positive regulation of establishment of protein localization to mitochondrion | 15/3918 | 36/18723 | 3.85e-03 | 2.70e-02 | 15 |
| GO:0045926 | Colorectum | AD | negative regulation of growth | 70/3918 | 249/18723 | 4.07e-03 | 2.83e-02 | 70 |
| GO:0043525 | Colorectum | AD | positive regulation of neuron apoptotic process | 21/3918 | 58/18723 | 5.25e-03 | 3.47e-02 | 21 |
| GO:0043502 | Colorectum | AD | regulation of muscle adaptation | 31/3918 | 98/18723 | 8.45e-03 | 4.94e-02 | 31 |
| GO:00060911 | Colorectum | SER | generation of precursor metabolites and energy | 168/2897 | 490/18723 | 1.39e-25 | 1.70e-22 | 168 |
| GO:00159801 | Colorectum | SER | energy derivation by oxidation of organic compounds | 119/2897 | 318/18723 | 5.28e-22 | 4.62e-19 | 119 |
| GO:00421761 | Colorectum | SER | regulation of protein catabolic process | 126/2897 | 391/18723 | 5.33e-17 | 2.52e-14 | 126 |
| GO:19033621 | Colorectum | SER | regulation of cellular protein catabolic process | 91/2897 | 255/18723 | 1.22e-15 | 5.36e-13 | 91 |
| GO:00068391 | Colorectum | SER | mitochondrial transport | 87/2897 | 254/18723 | 7.91e-14 | 3.03e-11 | 87 |
| GO:19030501 | Colorectum | SER | regulation of proteolysis involved in cellular protein catabolic process | 77/2897 | 221/18723 | 7.85e-13 | 2.00e-10 | 77 |
| GO:00457321 | Colorectum | SER | positive regulation of protein catabolic process | 77/2897 | 231/18723 | 9.91e-12 | 1.90e-09 | 77 |
| GO:00104981 | Colorectum | SER | proteasomal protein catabolic process | 132/2897 | 490/18723 | 3.08e-11 | 5.55e-09 | 132 |
| GO:19038291 | Colorectum | SER | positive regulation of cellular protein localization | 86/2897 | 276/18723 | 3.61e-11 | 6.11e-09 | 86 |
| GO:00098961 | Colorectum | SER | positive regulation of catabolic process | 132/2897 | 492/18723 | 4.16e-11 | 6.72e-09 | 132 |
| Page: 1 2 3 4 5 6 7 8 9 10 11 12 13 14 15 16 17 18 19 20 21 22 23 24 25 26 27 28 29 30 31 32 33 34 35 36 37 38 39 40 41 42 43 44 45 46 47 48 49 50 51 52 53 54 55 56 57 |
| Pathway ID | Tissue | Disease Stage | Description | Gene Ratio | Bg Ratio | pvalue | p.adjust | qvalue | Count |
| hsa04932 | Colorectum | AD | Non-alcoholic fatty liver disease | 90/2092 | 155/8465 | 4.83e-19 | 1.80e-17 | 1.15e-17 | 90 |
| hsa05131 | Colorectum | AD | Shigellosis | 109/2092 | 247/8465 | 1.09e-11 | 2.44e-10 | 1.55e-10 | 109 |
| hsa04728 | Colorectum | AD | Dopaminergic synapse | 46/2092 | 132/8465 | 5.55e-03 | 2.48e-02 | 1.58e-02 | 46 |
| hsa049321 | Colorectum | AD | Non-alcoholic fatty liver disease | 90/2092 | 155/8465 | 4.83e-19 | 1.80e-17 | 1.15e-17 | 90 |
| hsa051311 | Colorectum | AD | Shigellosis | 109/2092 | 247/8465 | 1.09e-11 | 2.44e-10 | 1.55e-10 | 109 |
| hsa047281 | Colorectum | AD | Dopaminergic synapse | 46/2092 | 132/8465 | 5.55e-03 | 2.48e-02 | 1.58e-02 | 46 |
| hsa049322 | Colorectum | SER | Non-alcoholic fatty liver disease | 75/1580 | 155/8465 | 2.16e-17 | 5.99e-16 | 4.35e-16 | 75 |
| hsa051312 | Colorectum | SER | Shigellosis | 87/1580 | 247/8465 | 3.07e-10 | 7.27e-09 | 5.28e-09 | 87 |
| hsa047282 | Colorectum | SER | Dopaminergic synapse | 37/1580 | 132/8465 | 5.27e-03 | 3.28e-02 | 2.38e-02 | 37 |
| hsa049323 | Colorectum | SER | Non-alcoholic fatty liver disease | 75/1580 | 155/8465 | 2.16e-17 | 5.99e-16 | 4.35e-16 | 75 |
| hsa051313 | Colorectum | SER | Shigellosis | 87/1580 | 247/8465 | 3.07e-10 | 7.27e-09 | 5.28e-09 | 87 |
| hsa047283 | Colorectum | SER | Dopaminergic synapse | 37/1580 | 132/8465 | 5.27e-03 | 3.28e-02 | 2.38e-02 | 37 |
| hsa049324 | Colorectum | MSS | Non-alcoholic fatty liver disease | 85/1875 | 155/8465 | 4.19e-19 | 1.17e-17 | 7.17e-18 | 85 |
| hsa051314 | Colorectum | MSS | Shigellosis | 94/1875 | 247/8465 | 6.82e-09 | 1.34e-07 | 8.23e-08 | 94 |
| hsa047284 | Colorectum | MSS | Dopaminergic synapse | 45/1875 | 132/8465 | 1.02e-03 | 5.94e-03 | 3.64e-03 | 45 |
| hsa049325 | Colorectum | MSS | Non-alcoholic fatty liver disease | 85/1875 | 155/8465 | 4.19e-19 | 1.17e-17 | 7.17e-18 | 85 |
| hsa051315 | Colorectum | MSS | Shigellosis | 94/1875 | 247/8465 | 6.82e-09 | 1.34e-07 | 8.23e-08 | 94 |
| hsa047285 | Colorectum | MSS | Dopaminergic synapse | 45/1875 | 132/8465 | 1.02e-03 | 5.94e-03 | 3.64e-03 | 45 |
| hsa04932210 | Esophagus | ESCC | Non-alcoholic fatty liver disease | 122/4205 | 155/8465 | 5.69e-14 | 1.59e-12 | 8.14e-13 | 122 |
| hsa05131211 | Esophagus | ESCC | Shigellosis | 176/4205 | 247/8465 | 2.27e-12 | 4.01e-11 | 2.05e-11 | 176 |
| Page: 1 2 |
Top |
Cell-cell communication analysis |
| Identification of potential cell-cell interactions between two cell types and their ligand-receptor pairs for different disease states |
| Ligand | Receptor | LRpair | Pathway | Tissue | Disease Stage |
| Page: 1 |
Top |
Single-cell gene regulatory network inference analysis |
| Find out the significant the regulons (TFs) and the target genes of each regulon across cell types for different disease states |
| TF | Cell Type | Tissue | Disease Stage | Target Gene | RSS | Regulon Activity |
| ∗The dot plots of a searched regulon are shown for all cell subpopulations in each disease state of each tissue based on the regulon specific score inferred using pySCENIC and by calculating the average expression. |
| Page: 1 |
Top |
Somatic mutation of malignant transformation related genes |
| Annotation of somatic variants for genes involved in malignant transformation |
| Hugo Symbol | Variant Class | Variant Classification | dbSNP RS | HGVSc | HGVSp | HGVSp Short | SWISSPROT | BIOTYPE | SIFT | PolyPhen | Tumor Sample Barcode | Tissue | Histology | Sex | Age | Stage | Therapy Types | Drugs | Outcome |
| GSK3A | SNV | Missense_Mutation | c.430N>G | p.Leu144Val | p.L144V | P49840 | protein_coding | tolerated(0.34) | benign(0.005) | TCGA-A2-A25E-01 | Breast | breast invasive carcinoma | Female | <65 | III/IV | Chemotherapy | cytoxan | PD | |
| GSK3A | SNV | Missense_Mutation | rs750207489 | c.757N>A | p.Asp253Asn | p.D253N | P49840 | protein_coding | tolerated(0.54) | benign(0.286) | TCGA-A7-A26H-01 | Breast | breast invasive carcinoma | Female | >=65 | I/II | Hormone Therapy | anastrozole | PD |
| GSK3A | SNV | Missense_Mutation | c.710N>T | p.Ser237Phe | p.S237F | P49840 | protein_coding | deleterious(0.01) | probably_damaging(0.983) | TCGA-BH-A0BV-01 | Breast | breast invasive carcinoma | Female | >=65 | I/II | Chemotherapy | doxorubicin | SD | |
| GSK3A | SNV | Missense_Mutation | c.758N>G | p.Asp253Gly | p.D253G | P49840 | protein_coding | deleterious(0) | probably_damaging(0.971) | TCGA-E9-A1R7-01 | Breast | breast invasive carcinoma | Female | <65 | I/II | Hormone Therapy | fareston | SD | |
| GSK3A | insertion | Frame_Shift_Ins | novel | c.1322_1323insTACAGGCGTGAAC | p.Pro442ThrfsTer26 | p.P442Tfs*26 | P49840 | protein_coding | TCGA-AR-A0TY-01 | Breast | breast invasive carcinoma | Female | <65 | I/II | Unspecific | Paclitaxel | PD | ||
| GSK3A | insertion | Frame_Shift_Ins | novel | c.1320_1321insCCGCTTGGCCTCCTAAAGTGTTGGG | p.Ile441ProfsTer31 | p.I441Pfs*31 | P49840 | protein_coding | TCGA-AR-A0TY-01 | Breast | breast invasive carcinoma | Female | <65 | I/II | Unspecific | Paclitaxel | PD | ||
| GSK3A | SNV | Missense_Mutation | novel | c.787N>A | p.Asp263Asn | p.D263N | P49840 | protein_coding | deleterious(0) | probably_damaging(0.994) | TCGA-2W-A8YY-01 | Cervix | cervical & endocervical cancer | Female | <65 | I/II | Chemotherapy | cisplatin | CR |
| GSK3A | SNV | Missense_Mutation | novel | c.616G>C | p.Ala206Pro | p.A206P | P49840 | protein_coding | deleterious(0.01) | probably_damaging(0.994) | TCGA-C5-A1M5-01 | Cervix | cervical & endocervical cancer | Female | <65 | I/II | Unknown | Unknown | PD |
| GSK3A | SNV | Missense_Mutation | novel | c.288C>A | p.Asp96Glu | p.D96E | P49840 | protein_coding | tolerated(0.21) | benign(0.056) | TCGA-C5-A8ZZ-01 | Cervix | cervical & endocervical cancer | Female | <65 | I/II | Unspecific | Cisplatin | SD |
| GSK3A | SNV | Missense_Mutation | c.1264N>G | p.Leu422Val | p.L422V | P49840 | protein_coding | deleterious(0) | benign(0.377) | TCGA-EK-A2RJ-01 | Cervix | cervical & endocervical cancer | Female | <65 | I/II | Unknown | Unknown | SD |
| Page: 1 2 3 4 5 6 |
Top |
Related drugs of malignant transformation related genes |
| Identification of chemicals and drugs interact with genes involved in malignant transfromation |
| (DGIdb 4.0) |
| Entrez ID | Symbol | Category | Interaction Types | Drug Claim Name | Drug Name | PMIDs |
| 2931 | GSK3A | DRUGGABLE GENOME, SERINE THREONINE KINASE, TRANSCRIPTION FACTOR, KINASE, ENZYME | Thiadiazolidindione derivative 2 | |||
| 2931 | GSK3A | DRUGGABLE GENOME, SERINE THREONINE KINASE, TRANSCRIPTION FACTOR, KINASE, ENZYME | PMID27828716-Compound-BIO-acetoxime | |||
| 2931 | GSK3A | DRUGGABLE GENOME, SERINE THREONINE KINASE, TRANSCRIPTION FACTOR, KINASE, ENZYME | CHIR-99021 | CHIR-99021 | ||
| 2931 | GSK3A | DRUGGABLE GENOME, SERINE THREONINE KINASE, TRANSCRIPTION FACTOR, KINASE, ENZYME | inhibitor | 249565696 | ||
| 2931 | GSK3A | DRUGGABLE GENOME, SERINE THREONINE KINASE, TRANSCRIPTION FACTOR, KINASE, ENZYME | PHA-767491 | CHEMBL225519 | ||
| 2931 | GSK3A | DRUGGABLE GENOME, SERINE THREONINE KINASE, TRANSCRIPTION FACTOR, KINASE, ENZYME | AR-A014418 | CHEMBL259850 | ||
| 2931 | GSK3A | DRUGGABLE GENOME, SERINE THREONINE KINASE, TRANSCRIPTION FACTOR, KINASE, ENZYME | KENPAULLONE | KENPAULLONE | ||
| 2931 | GSK3A | DRUGGABLE GENOME, SERINE THREONINE KINASE, TRANSCRIPTION FACTOR, KINASE, ENZYME | PMID27828716-Compound-17 | |||
| 2931 | GSK3A | DRUGGABLE GENOME, SERINE THREONINE KINASE, TRANSCRIPTION FACTOR, KINASE, ENZYME | Maleimides derivative 3 | |||
| 2931 | GSK3A | DRUGGABLE GENOME, SERINE THREONINE KINASE, TRANSCRIPTION FACTOR, KINASE, ENZYME | Indazole derivative 6 |
| Page: 1 2 3 4 5 6 7 |

Copyright 2023-Present -The University of Texas Health Science Center at Houston |