
|
|||||
|
 | |
| |
| |
| |
| |
| |
|
Gene: GLRX |
Gene summary for GLRX |
| Gene information | Species | Human | Gene symbol | GLRX | Gene ID | 2745 |
| Gene name | glutaredoxin | |
| Gene Alias | GRX | |
| Cytomap | 5q15 | |
| Gene Type | protein-coding | GO ID | GO:0002028 | UniProtAcc | A0A024RAM2 |
Top |
Malignant transformation analysis |
| Identification of the aberrant gene expression in precancerous and cancerous lesions by comparing the gene expression of stem-like cells in diseased tissues with normal stem cells |
| Entrez ID | Symbol | Replicates | Species | Organ | Tissue | Adj P-value | Log2FC | Malignancy |
| 2745 | GLRX | GSM4909285 | Human | Breast | IDC | 3.60e-09 | -3.02e-01 | 0.21 |
| 2745 | GLRX | GSM4909286 | Human | Breast | IDC | 4.91e-06 | -3.09e-01 | 0.1081 |
| 2745 | GLRX | GSM4909291 | Human | Breast | IDC | 1.81e-07 | -3.87e-01 | 0.1753 |
| 2745 | GLRX | GSM4909293 | Human | Breast | IDC | 2.89e-04 | -2.83e-01 | 0.1581 |
| 2745 | GLRX | GSM4909294 | Human | Breast | IDC | 1.34e-04 | -1.63e-01 | 0.2022 |
| 2745 | GLRX | GSM4909295 | Human | Breast | IDC | 3.63e-02 | -3.26e-01 | 0.0898 |
| 2745 | GLRX | GSM4909296 | Human | Breast | IDC | 1.07e-06 | -2.40e-01 | 0.1524 |
| 2745 | GLRX | GSM4909297 | Human | Breast | IDC | 9.92e-12 | -3.10e-01 | 0.1517 |
| 2745 | GLRX | GSM4909299 | Human | Breast | IDC | 3.95e-04 | -2.76e-01 | 0.035 |
| 2745 | GLRX | GSM4909301 | Human | Breast | IDC | 5.76e-06 | -2.72e-01 | 0.1577 |
| 2745 | GLRX | GSM4909302 | Human | Breast | IDC | 1.91e-12 | -3.87e-01 | 0.1545 |
| 2745 | GLRX | GSM4909304 | Human | Breast | IDC | 8.84e-15 | -3.80e-01 | 0.1636 |
| 2745 | GLRX | GSM4909306 | Human | Breast | IDC | 5.35e-09 | -3.38e-01 | 0.1564 |
| 2745 | GLRX | GSM4909307 | Human | Breast | IDC | 4.22e-10 | 5.38e-01 | 0.1569 |
| 2745 | GLRX | GSM4909308 | Human | Breast | IDC | 9.18e-40 | 8.17e-01 | 0.158 |
| 2745 | GLRX | GSM4909309 | Human | Breast | IDC | 7.19e-05 | -3.07e-01 | 0.0483 |
| 2745 | GLRX | GSM4909311 | Human | Breast | IDC | 8.57e-23 | -4.17e-01 | 0.1534 |
| 2745 | GLRX | GSM4909312 | Human | Breast | IDC | 2.96e-12 | -3.45e-01 | 0.1552 |
| 2745 | GLRX | GSM4909313 | Human | Breast | IDC | 3.96e-05 | -2.98e-01 | 0.0391 |
| 2745 | GLRX | GSM4909317 | Human | Breast | IDC | 2.64e-08 | -3.57e-01 | 0.1355 |
| Page: 1 2 3 4 5 |
| Tissue | Expression Dynamics | Abbreviation |
| Breast | 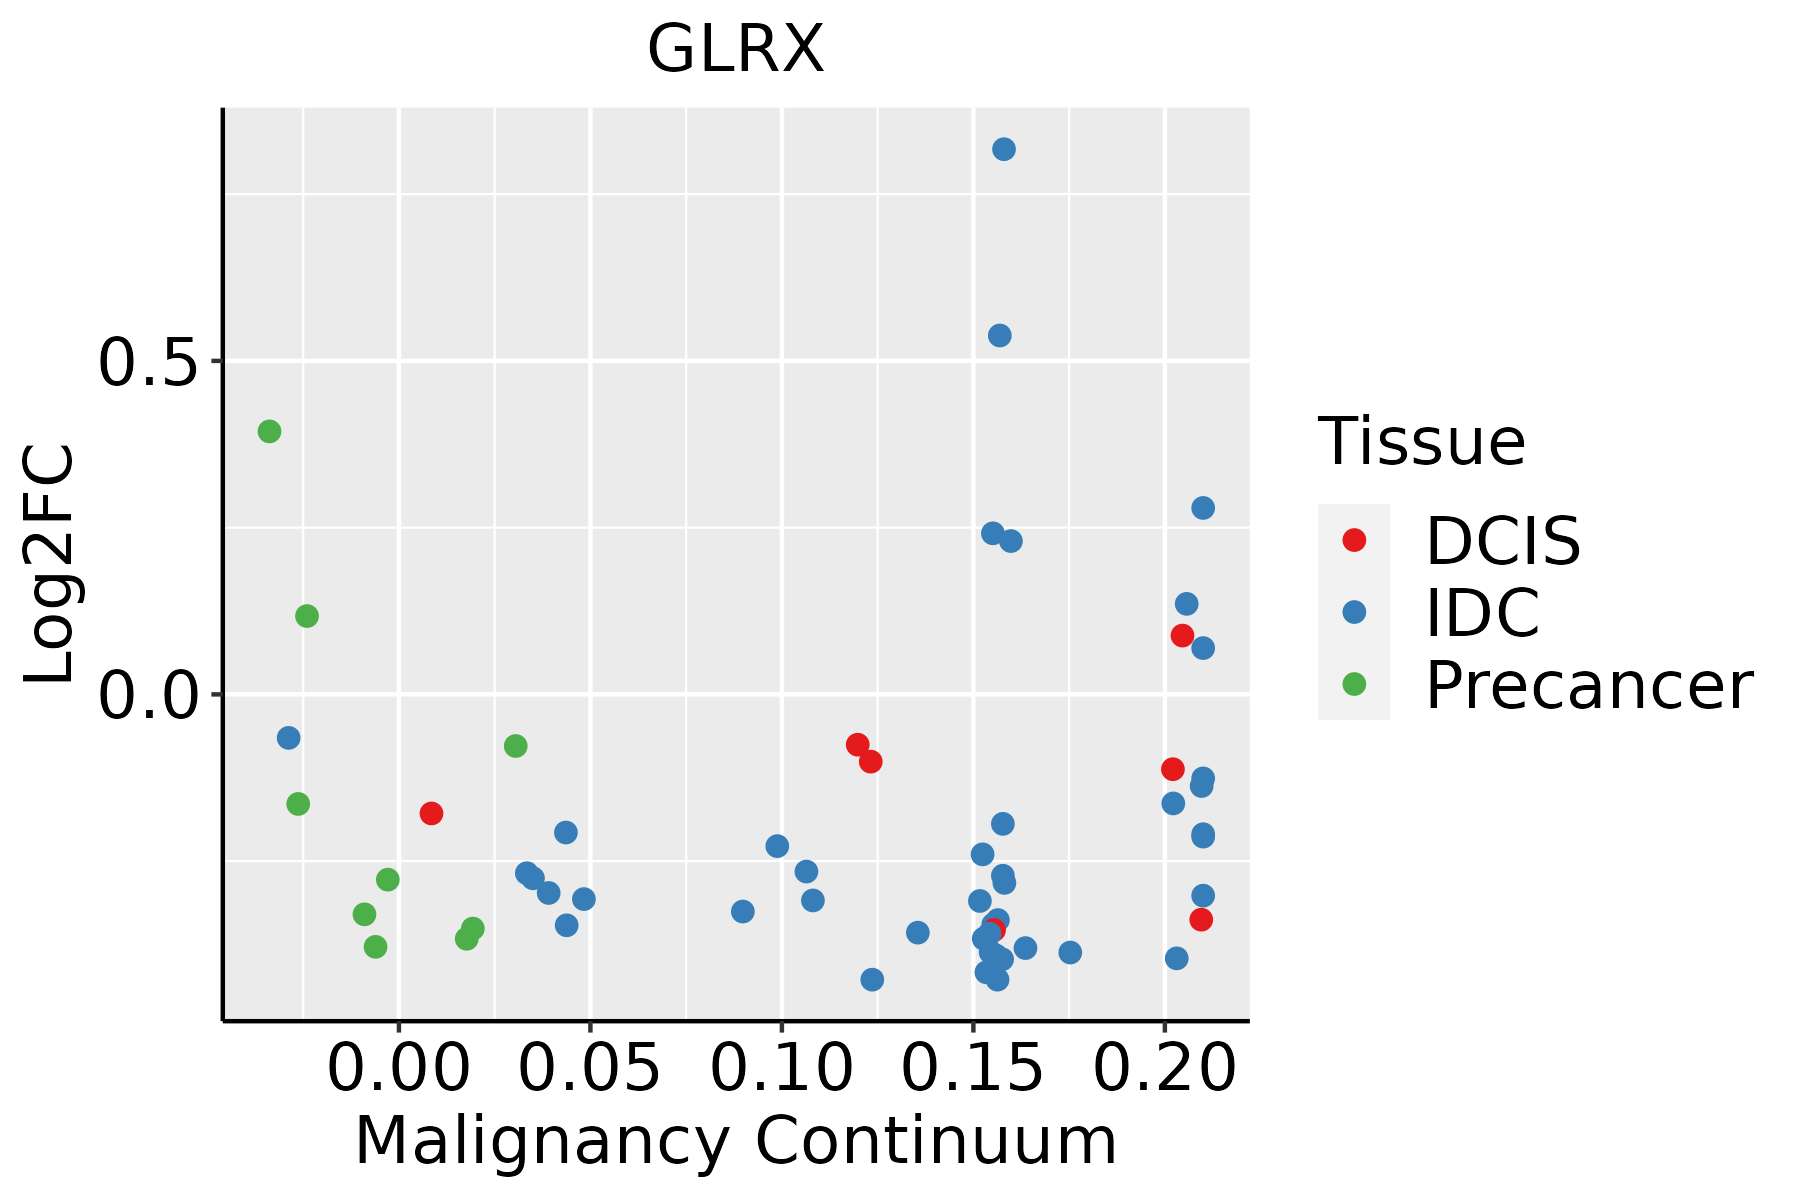 | IDC: Invasive ductal carcinoma |
| DCIS: Ductal carcinoma in situ | ||
| Precancer(BRCA1-mut): Precancerous lesion from BRCA1 mutation carriers | ||
| Esophagus |  | ESCC: Esophageal squamous cell carcinoma |
| HGIN: High-grade intraepithelial neoplasias | ||
| LGIN: Low-grade intraepithelial neoplasias | ||
| Liver | 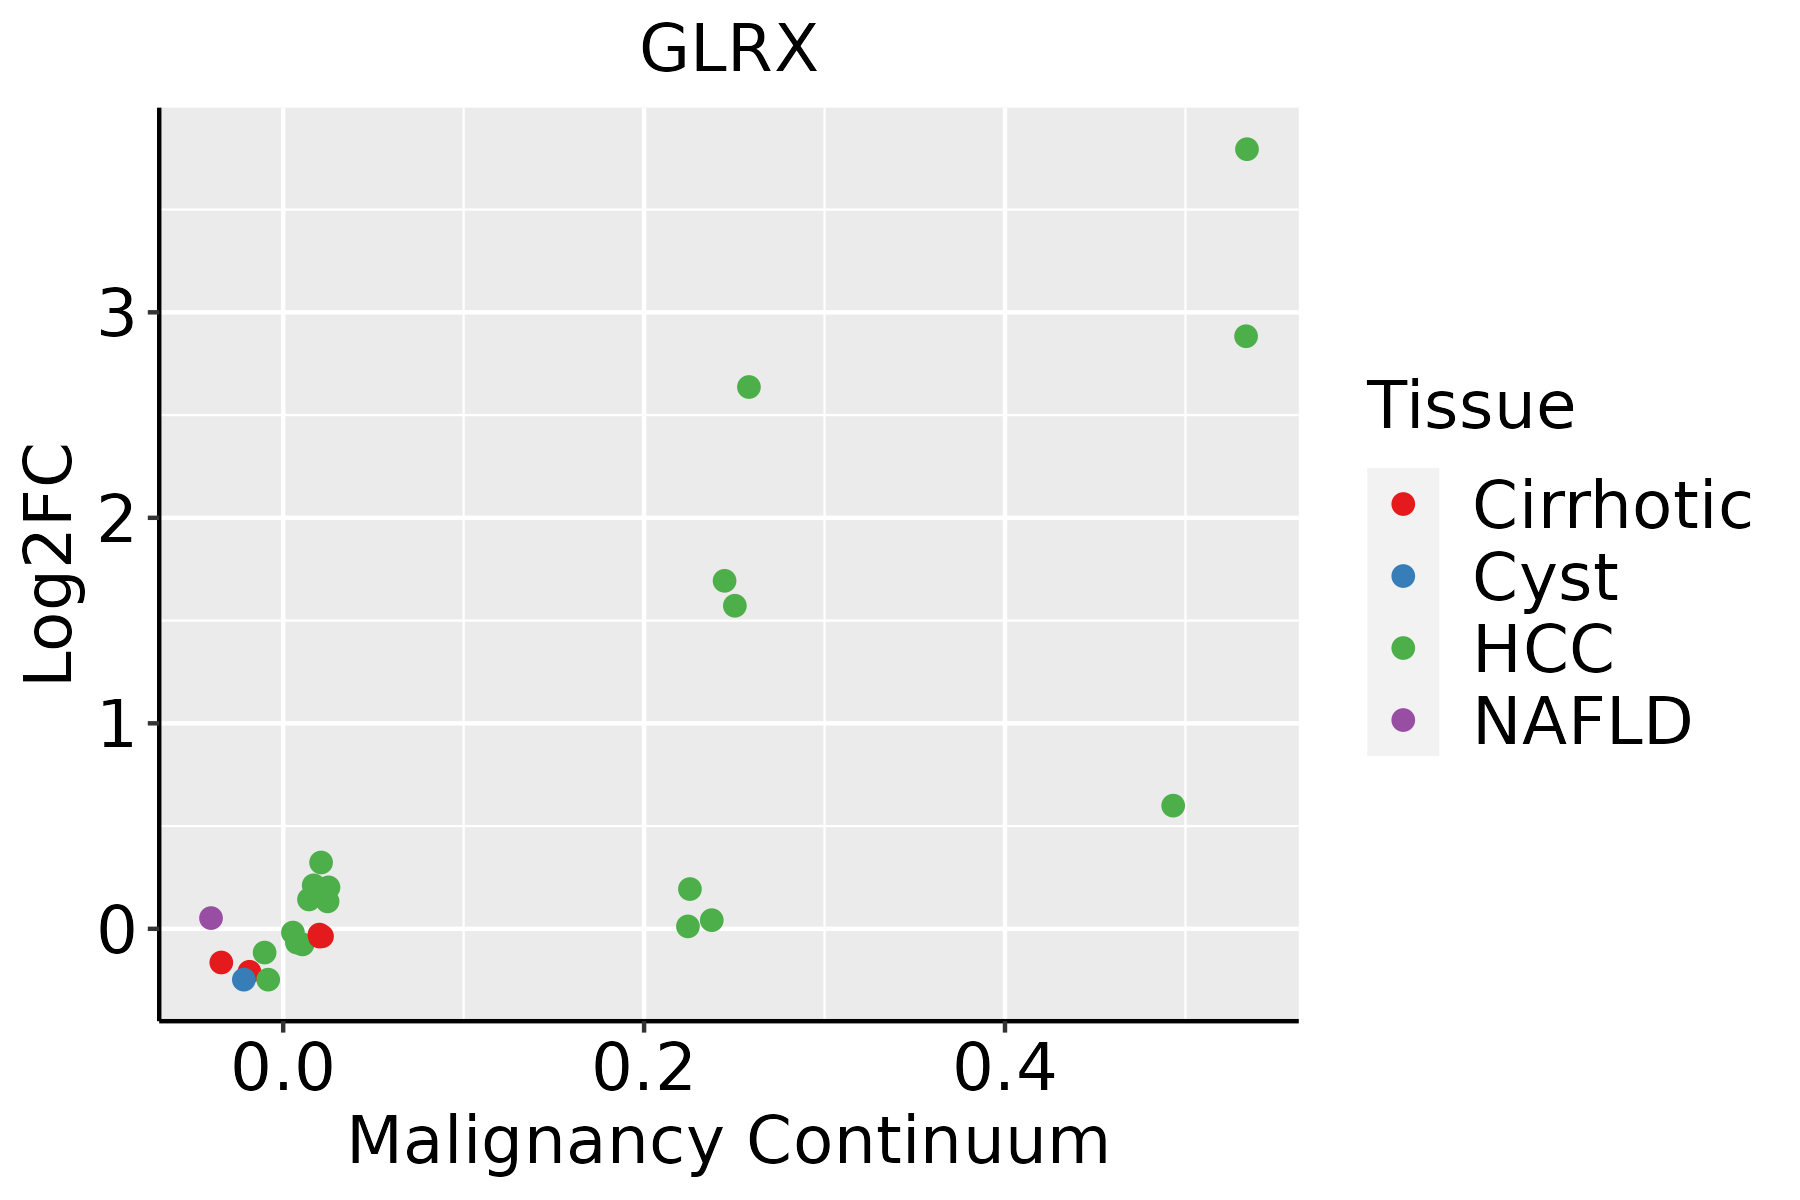 | HCC: Hepatocellular carcinoma |
| NAFLD: Non-alcoholic fatty liver disease | ||
| Oral Cavity | 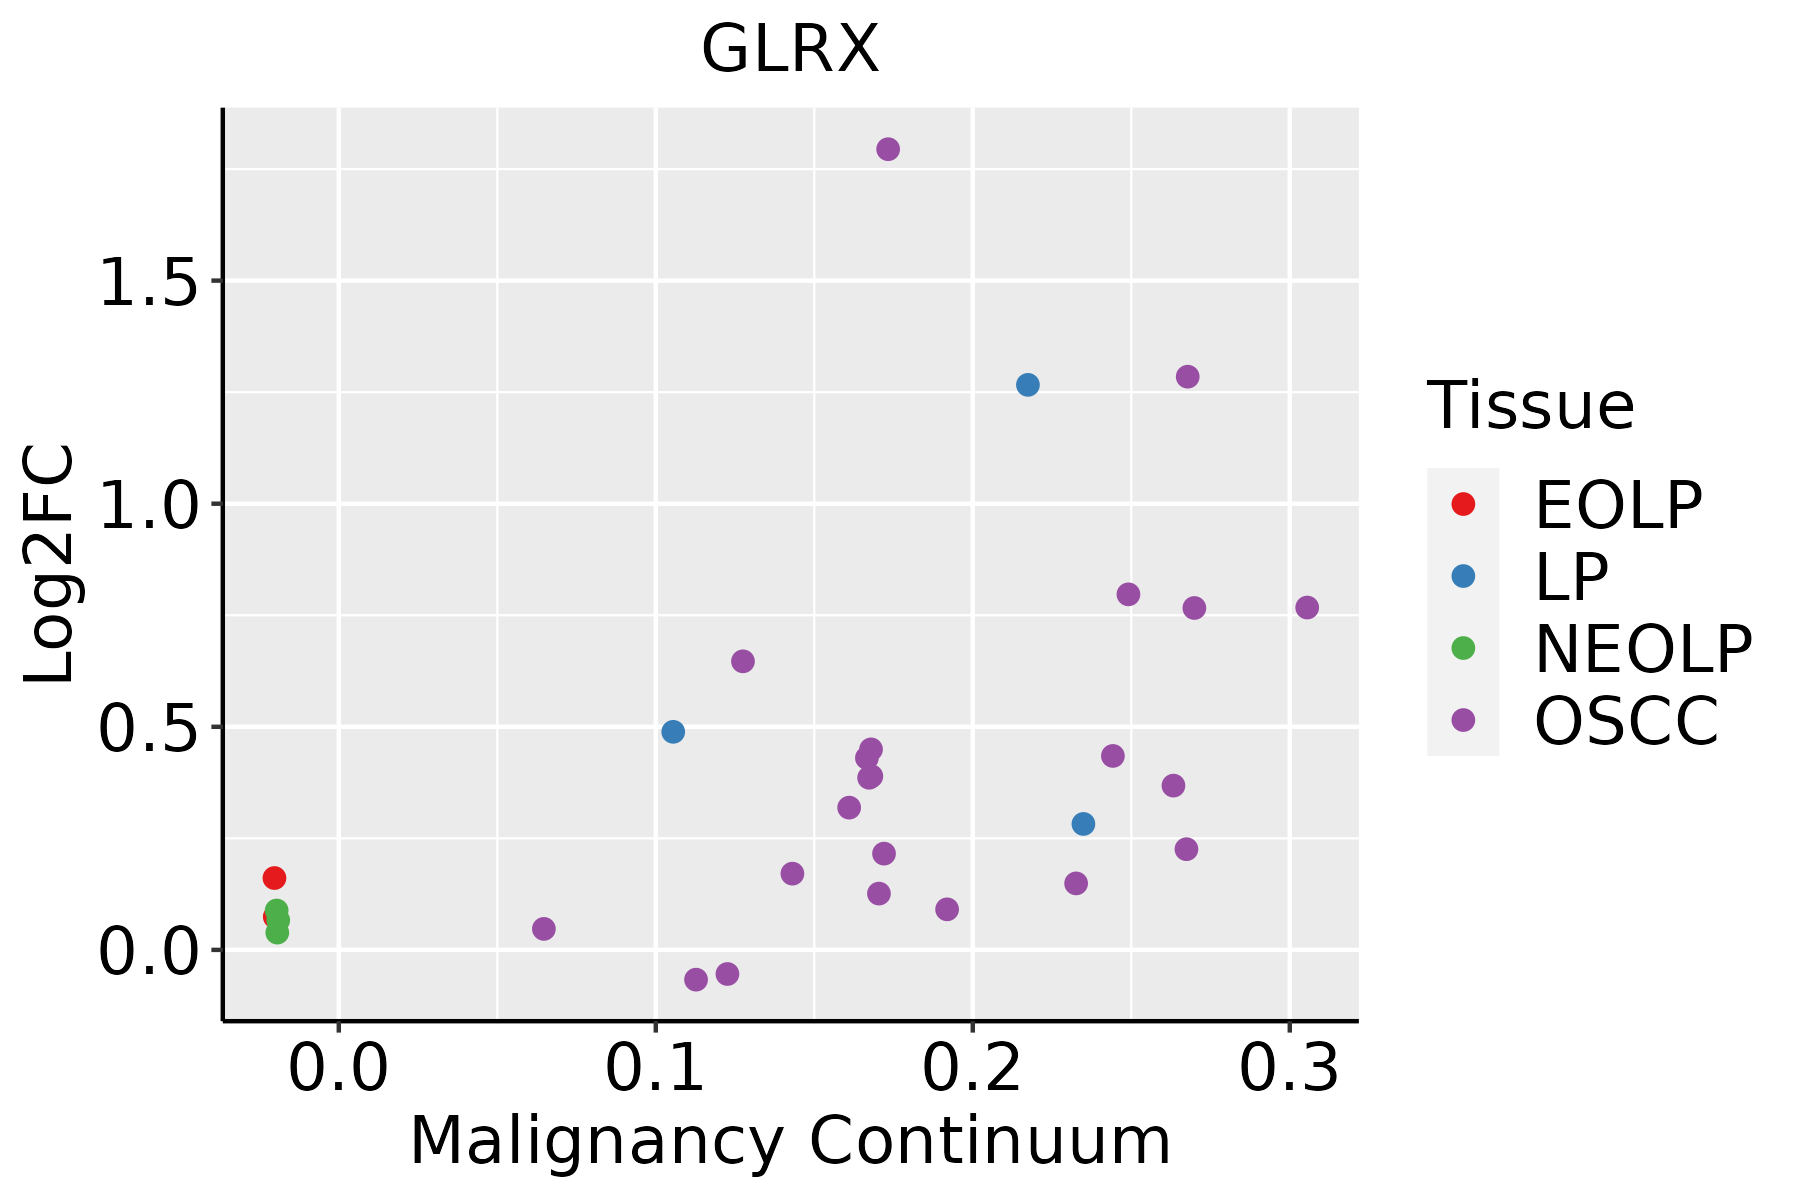 | EOLP: Erosive Oral lichen planus |
| LP: leukoplakia | ||
| NEOLP: Non-erosive oral lichen planus | ||
| OSCC: Oral squamous cell carcinoma | ||
| Thyroid | 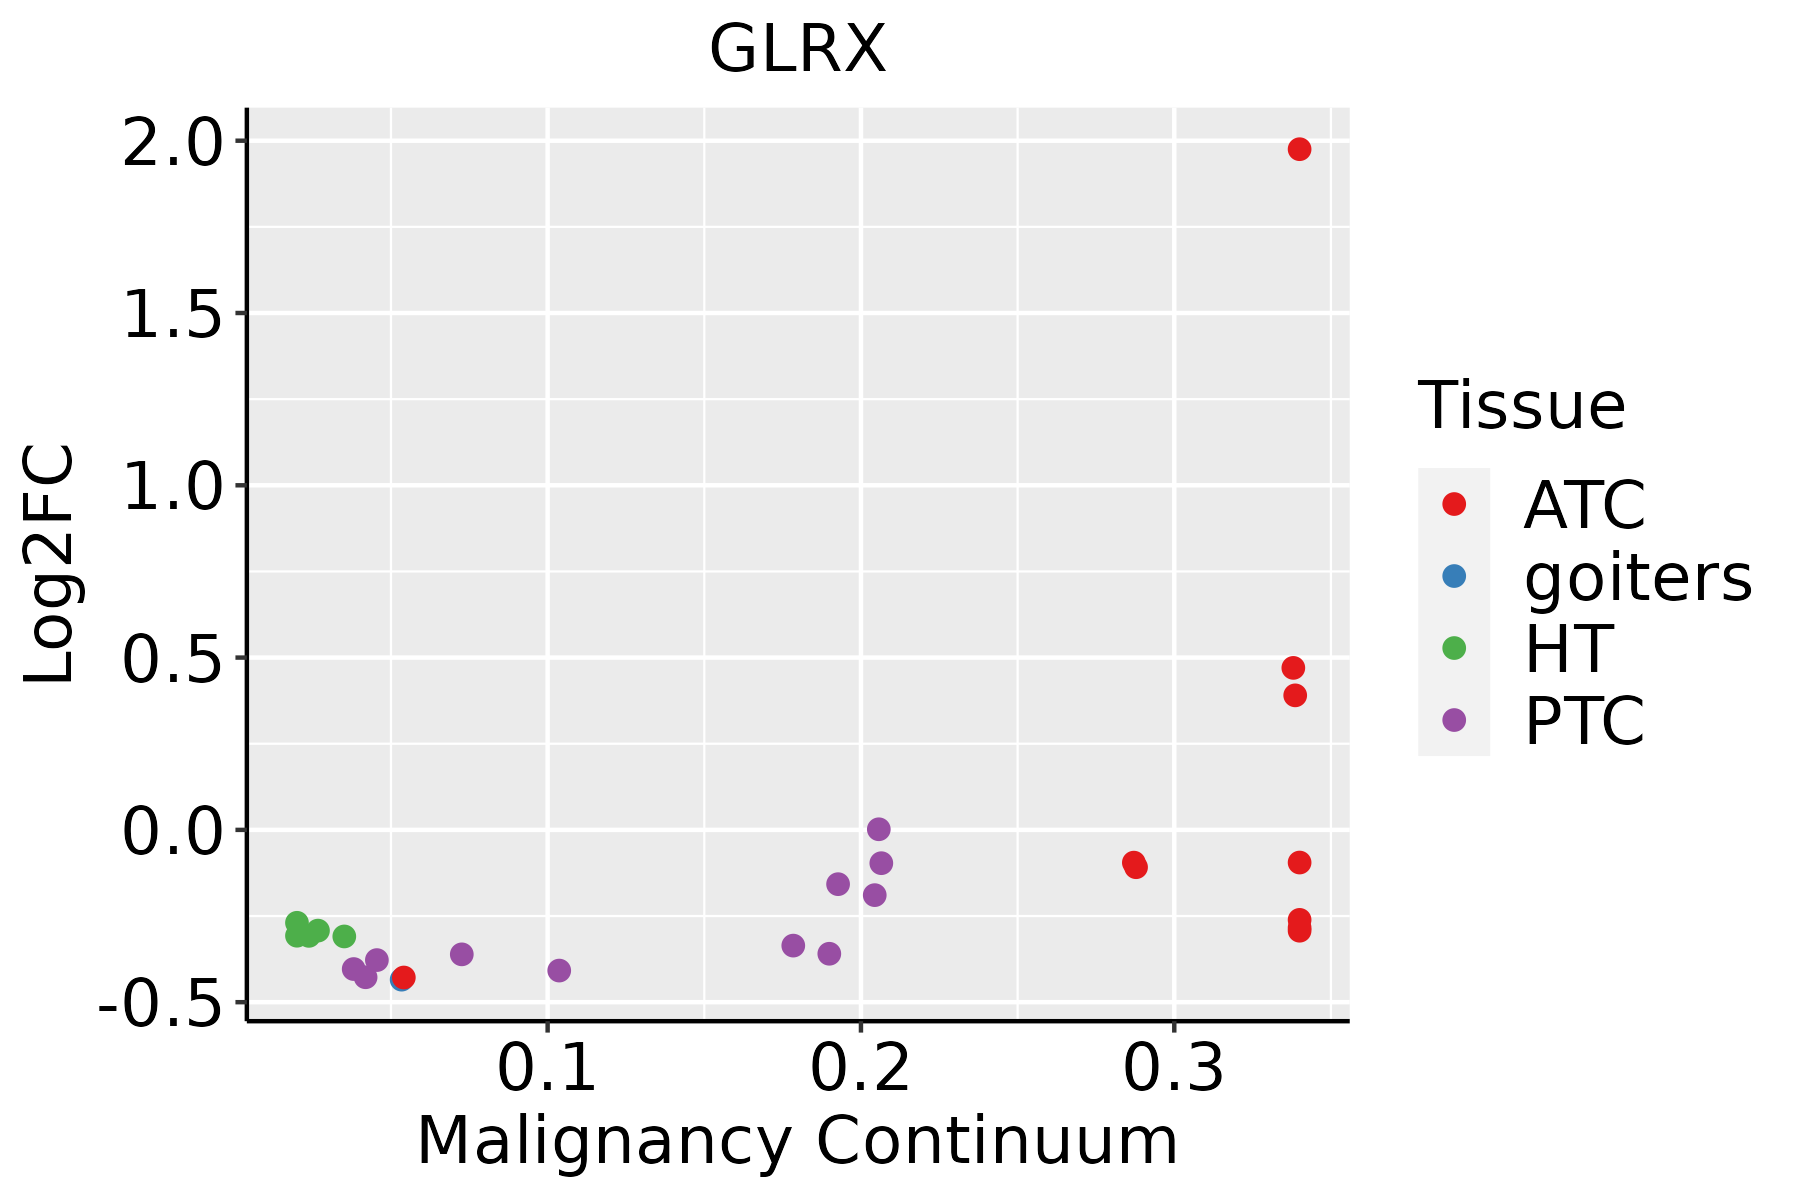 | ATC: Anaplastic thyroid cancer |
| HT: Hashimoto's thyroiditis | ||
| PTC: Papillary thyroid cancer |
| ∗log2FC in expression of this searched gene in stem-like cells from each diseased tissue sample relative to stem-like cells in normal samples in each tissue plotted against the malignancy continuum. Samples are colored based on if they are from different disease stage. |
Top |
Malignant transformation related pathway analysis |
| Find out the enriched GO biological processes and KEGG pathways involved in transition from healthy to precancer to cancer |
| Tissue | Disease Stage | Enriched GO biological Processes |
| Colorectum | AD |  |
| Colorectum | SER |  |
| Colorectum | MSS |  |
| Colorectum | MSI-H |  |
| Colorectum | FAP |  |
| ∗Top 15 enriched GO BP terms are showed in the bar plot of each disease state in each tissue. Each row represents a significant GO biological process which is colored according to the -log10(p.adjust). |
| Page: 1 2 3 4 5 6 7 8 9 |
| GO ID | Tissue | Disease Stage | Description | Gene Ratio | Bg Ratio | pvalue | p.adjust | Count |
| GO:003459922 | Liver | HCC | cellular response to oxidative stress | 183/7958 | 288/18723 | 3.65e-13 | 1.93e-11 | 183 |
| GO:000030222 | Liver | HCC | response to reactive oxygen species | 144/7958 | 222/18723 | 1.24e-11 | 5.09e-10 | 144 |
| GO:004254222 | Liver | HCC | response to hydrogen peroxide | 100/7958 | 146/18723 | 1.79e-10 | 6.15e-09 | 100 |
| GO:007149622 | Liver | HCC | cellular response to external stimulus | 191/7958 | 320/18723 | 3.40e-10 | 1.13e-08 | 191 |
| GO:003461412 | Liver | HCC | cellular response to reactive oxygen species | 102/7958 | 155/18723 | 3.70e-09 | 9.89e-08 | 102 |
| GO:000657521 | Liver | HCC | cellular modified amino acid metabolic process | 119/7958 | 188/18723 | 6.47e-09 | 1.67e-07 | 119 |
| GO:003166812 | Liver | HCC | cellular response to extracellular stimulus | 149/7958 | 246/18723 | 7.35e-09 | 1.86e-07 | 149 |
| GO:005160412 | Liver | HCC | protein maturation | 171/7958 | 294/18723 | 3.80e-08 | 8.30e-07 | 171 |
| GO:000963622 | Liver | HCC | response to toxic substance | 153/7958 | 262/18723 | 1.37e-07 | 2.58e-06 | 153 |
| GO:000756822 | Liver | HCC | aging | 185/7958 | 339/18723 | 4.28e-06 | 5.50e-05 | 185 |
| GO:000674911 | Liver | HCC | glutathione metabolic process | 44/7958 | 64/18723 | 1.95e-05 | 2.09e-04 | 44 |
| GO:199074812 | Liver | HCC | cellular detoxification | 70/7958 | 116/18723 | 7.87e-05 | 7.02e-04 | 70 |
| GO:009723712 | Liver | HCC | cellular response to toxic substance | 74/7958 | 124/18723 | 8.36e-05 | 7.36e-04 | 74 |
| GO:000926611 | Liver | HCC | response to temperature stimulus | 101/7958 | 178/18723 | 8.55e-05 | 7.48e-04 | 101 |
| GO:005507612 | Liver | HCC | transition metal ion homeostasis | 81/7958 | 138/18723 | 8.87e-05 | 7.72e-04 | 81 |
| GO:004545412 | Liver | HCC | cell redox homeostasis | 26/7958 | 35/18723 | 1.37e-04 | 1.11e-03 | 26 |
| GO:009875412 | Liver | HCC | detoxification | 87/7958 | 152/18723 | 1.70e-04 | 1.35e-03 | 87 |
| GO:004691611 | Liver | HCC | cellular transition metal ion homeostasis | 67/7958 | 115/18723 | 4.64e-04 | 3.08e-03 | 67 |
| GO:009886912 | Liver | HCC | cellular oxidant detoxification | 59/7958 | 101/18723 | 9.00e-04 | 5.31e-03 | 59 |
| GO:0051775 | Liver | HCC | response to redox state | 12/7958 | 15/18723 | 3.56e-03 | 1.59e-02 | 12 |
| Page: 1 2 3 4 5 6 7 8 9 10 11 12 13 14 15 16 |
| Pathway ID | Tissue | Disease Stage | Description | Gene Ratio | Bg Ratio | pvalue | p.adjust | qvalue | Count |
| Page: 1 |
Top |
Cell-cell communication analysis |
| Identification of potential cell-cell interactions between two cell types and their ligand-receptor pairs for different disease states |
| Ligand | Receptor | LRpair | Pathway | Tissue | Disease Stage |
| Page: 1 |
Top |
Single-cell gene regulatory network inference analysis |
| Find out the significant the regulons (TFs) and the target genes of each regulon across cell types for different disease states |
| TF | Cell Type | Tissue | Disease Stage | Target Gene | RSS | Regulon Activity |
| ∗The dot plots of a searched regulon are shown for all cell subpopulations in each disease state of each tissue based on the regulon specific score inferred using pySCENIC and by calculating the average expression. |
| Page: 1 |
Top |
Somatic mutation of malignant transformation related genes |
| Annotation of somatic variants for genes involved in malignant transformation |
| Hugo Symbol | Variant Class | Variant Classification | dbSNP RS | HGVSc | HGVSp | HGVSp Short | SWISSPROT | BIOTYPE | SIFT | PolyPhen | Tumor Sample Barcode | Tissue | Histology | Sex | Age | Stage | Therapy Types | Drugs | Outcome |
| GLRX | SNV | Missense_Mutation | c.224N>C | p.Ile75Thr | p.I75T | P35754 | protein_coding | deleterious(0.01) | probably_damaging(0.934) | TCGA-A8-A07W-01 | Breast | breast invasive carcinoma | Female | >=65 | III/IV | Hormone Therapy | exemestane | SD | |
| GLRX | SNV | Missense_Mutation | novel | c.170N>G | p.Ile57Ser | p.I57S | P35754 | protein_coding | deleterious(0) | probably_damaging(0.994) | TCGA-CA-6717-01 | Colorectum | colon adenocarcinoma | Male | <65 | I/II | Chemotherapy | oxaliplatin | CR |
| GLRX | SNV | Missense_Mutation | rs151319399 | c.292N>T | p.Arg98Trp | p.R98W | P35754 | protein_coding | tolerated(0.27) | benign(0.005) | TCGA-G4-6302-01 | Colorectum | colon adenocarcinoma | Female | >=65 | I/II | Unknown | Unknown | SD |
| GLRX | SNV | Missense_Mutation | rs140804825 | c.290N>T | p.Thr97Met | p.T97M | P35754 | protein_coding | tolerated(0.12) | benign(0.001) | TCGA-A5-A0GB-01 | Endometrium | uterine corpus endometrioid carcinoma | Female | >=65 | I/II | Unknown | Unknown | SD |
| GLRX | SNV | Missense_Mutation | novel | c.178T>C | p.Tyr60His | p.Y60H | P35754 | protein_coding | deleterious(0) | probably_damaging(1) | TCGA-A5-A1OK-01 | Endometrium | uterine corpus endometrioid carcinoma | Female | <65 | III/IV | Chemotherapy | taxol | SD |
| GLRX | SNV | Missense_Mutation | novel | c.253G>T | p.Asp85Tyr | p.D85Y | P35754 | protein_coding | deleterious(0.04) | possibly_damaging(0.881) | TCGA-AP-A1E0-01 | Endometrium | uterine corpus endometrioid carcinoma | Female | <65 | III/IV | Chemotherapy | paclitaxel | SD |
| GLRX | SNV | Missense_Mutation | c.215N>A | p.Arg72Gln | p.R72Q | P35754 | protein_coding | tolerated(0.12) | possibly_damaging(0.598) | TCGA-AX-A05Z-01 | Endometrium | uterine corpus endometrioid carcinoma | Female | <65 | III/IV | Chemotherapy | adriamycin | SD | |
| GLRX | SNV | Missense_Mutation | novel | c.232G>A | p.Asp78Asn | p.D78N | P35754 | protein_coding | tolerated(0.15) | benign(0.165) | TCGA-AX-A2HD-01 | Endometrium | uterine corpus endometrioid carcinoma | Female | >=65 | III/IV | Unknown | Unknown | SD |
| GLRX | SNV | Missense_Mutation | novel | c.134T>G | p.Phe45Cys | p.F45C | P35754 | protein_coding | tolerated(0.08) | benign(0.024) | TCGA-EO-A3AV-01 | Endometrium | uterine corpus endometrioid carcinoma | Female | <65 | III/IV | Chemotherapy | carboplatin | CR |
| GLRX | SNV | Missense_Mutation | c.148G>A | p.Ala50Thr | p.A50T | P35754 | protein_coding | tolerated(0.13) | benign(0.042) | TCGA-CD-A4MG-01 | Stomach | stomach adenocarcinoma | Male | >=65 | I/II | Unknown | Unknown | PD |
| Page: 1 |
Top |
Related drugs of malignant transformation related genes |
| Identification of chemicals and drugs interact with genes involved in malignant transfromation |
| (DGIdb 4.0) |
| Entrez ID | Symbol | Category | Interaction Types | Drug Claim Name | Drug Name | PMIDs |
| Page: 1 |

Copyright 2023-Present -The University of Texas Health Science Center at Houston |