| GO ID | Tissue | Disease Stage | Description | Gene Ratio | Bg Ratio | pvalue | p.adjust | Count |
| GO:00400141 | Colorectum | CRC | regulation of multicellular organism growth | 14/2078 | 61/18723 | 6.06e-03 | 4.46e-02 | 14 |
| GO:0048705 | Colorectum | CRC | skeletal system morphogenesis | 37/2078 | 220/18723 | 6.58e-03 | 4.71e-02 | 37 |
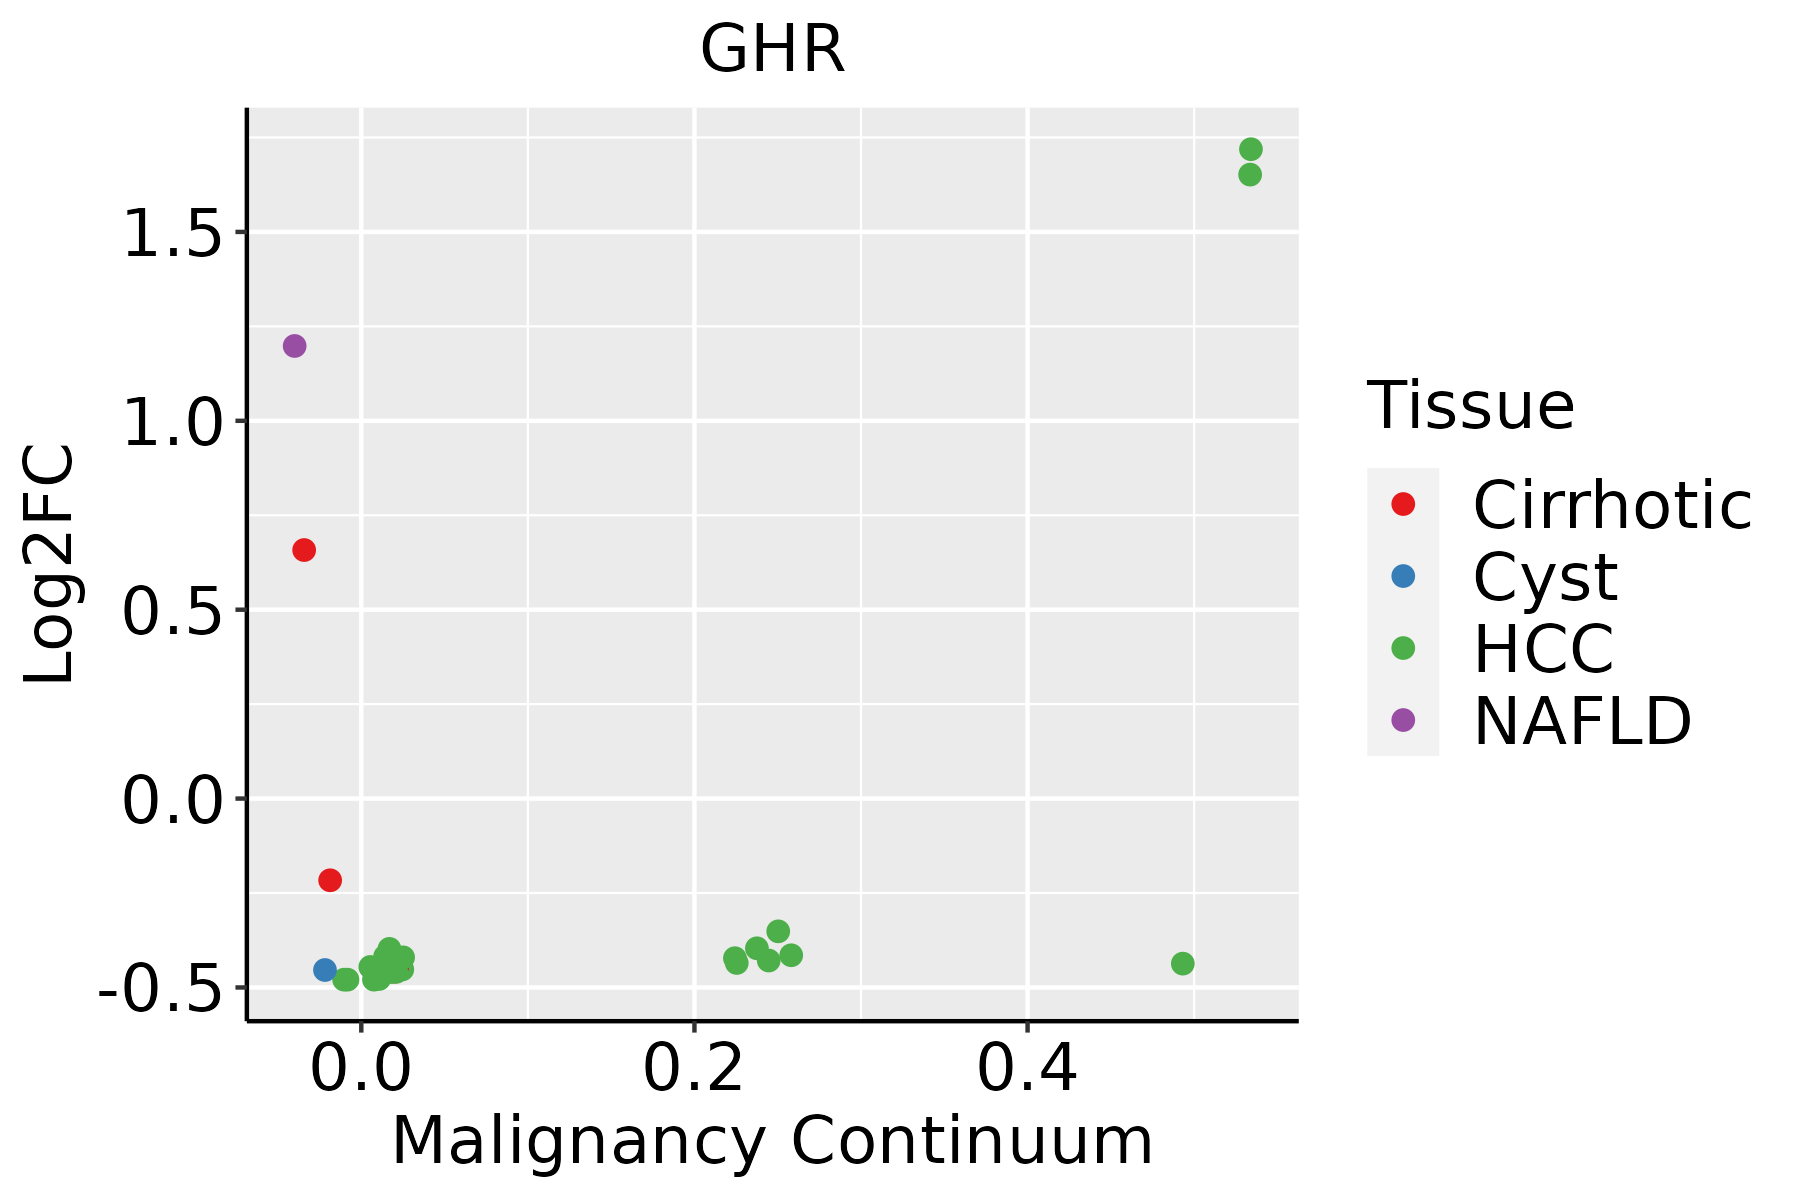
| GO:00485457 | Liver | NAFLD | response to steroid hormone | 75/1882 | 339/18723 | 3.44e-11 | 1.12e-08 | 75 |
| GO:00713755 | Liver | NAFLD | cellular response to peptide hormone stimulus | 65/1882 | 290/18723 | 3.95e-10 | 9.62e-08 | 65 |
| GO:19016536 | Liver | NAFLD | cellular response to peptide | 71/1882 | 359/18723 | 1.82e-08 | 2.09e-06 | 71 |
| GO:00328695 | Liver | NAFLD | cellular response to insulin stimulus | 47/1882 | 203/18723 | 3.60e-08 | 3.63e-06 | 47 |
| GO:00316677 | Liver | NAFLD | response to nutrient levels | 85/1882 | 474/18723 | 8.23e-08 | 7.09e-06 | 85 |
| GO:00434346 | Liver | NAFLD | response to peptide hormone | 76/1882 | 414/18723 | 1.51e-07 | 1.09e-05 | 76 |
| GO:00513846 | Liver | NAFLD | response to glucocorticoid | 36/1882 | 148/18723 | 3.88e-07 | 2.52e-05 | 36 |
| GO:00328685 | Liver | NAFLD | response to insulin | 53/1882 | 264/18723 | 6.99e-07 | 3.95e-05 | 53 |
| GO:00319606 | Liver | NAFLD | response to corticosteroid | 37/1882 | 167/18723 | 3.03e-06 | 1.23e-04 | 37 |
| GO:00097556 | Liver | NAFLD | hormone-mediated signaling pathway | 39/1882 | 190/18723 | 1.15e-05 | 3.58e-04 | 39 |
| GO:00458606 | Liver | NAFLD | positive regulation of protein kinase activity | 65/1882 | 386/18723 | 2.22e-05 | 6.13e-04 | 65 |
| GO:00067904 | Liver | NAFLD | sulfur compound metabolic process | 58/1882 | 339/18723 | 3.79e-05 | 9.38e-04 | 58 |
| GO:00336747 | Liver | NAFLD | positive regulation of kinase activity | 74/1882 | 467/18723 | 5.16e-05 | 1.19e-03 | 74 |
| GO:00352643 | Liver | NAFLD | multicellular organism growth | 27/1882 | 132/18723 | 2.57e-04 | 4.19e-03 | 27 |
| GO:00424452 | Liver | NAFLD | hormone metabolic process | 36/1882 | 218/18723 | 1.98e-03 | 1.98e-02 | 36 |
| GO:0042976 | Liver | NAFLD | activation of Janus kinase activity | 6/1882 | 15/18723 | 2.30e-03 | 2.19e-02 | 6 |
| GO:00480091 | Liver | NAFLD | insulin-like growth factor receptor signaling pathway | 10/1882 | 37/18723 | 2.82e-03 | 2.56e-02 | 10 |
| GO:0032147 | Liver | NAFLD | activation of protein kinase activity | 24/1882 | 134/18723 | 3.66e-03 | 3.13e-02 | 24 |
| Pathway ID | Tissue | Disease Stage | Description | Gene Ratio | Bg Ratio | pvalue | p.adjust | qvalue | Count |
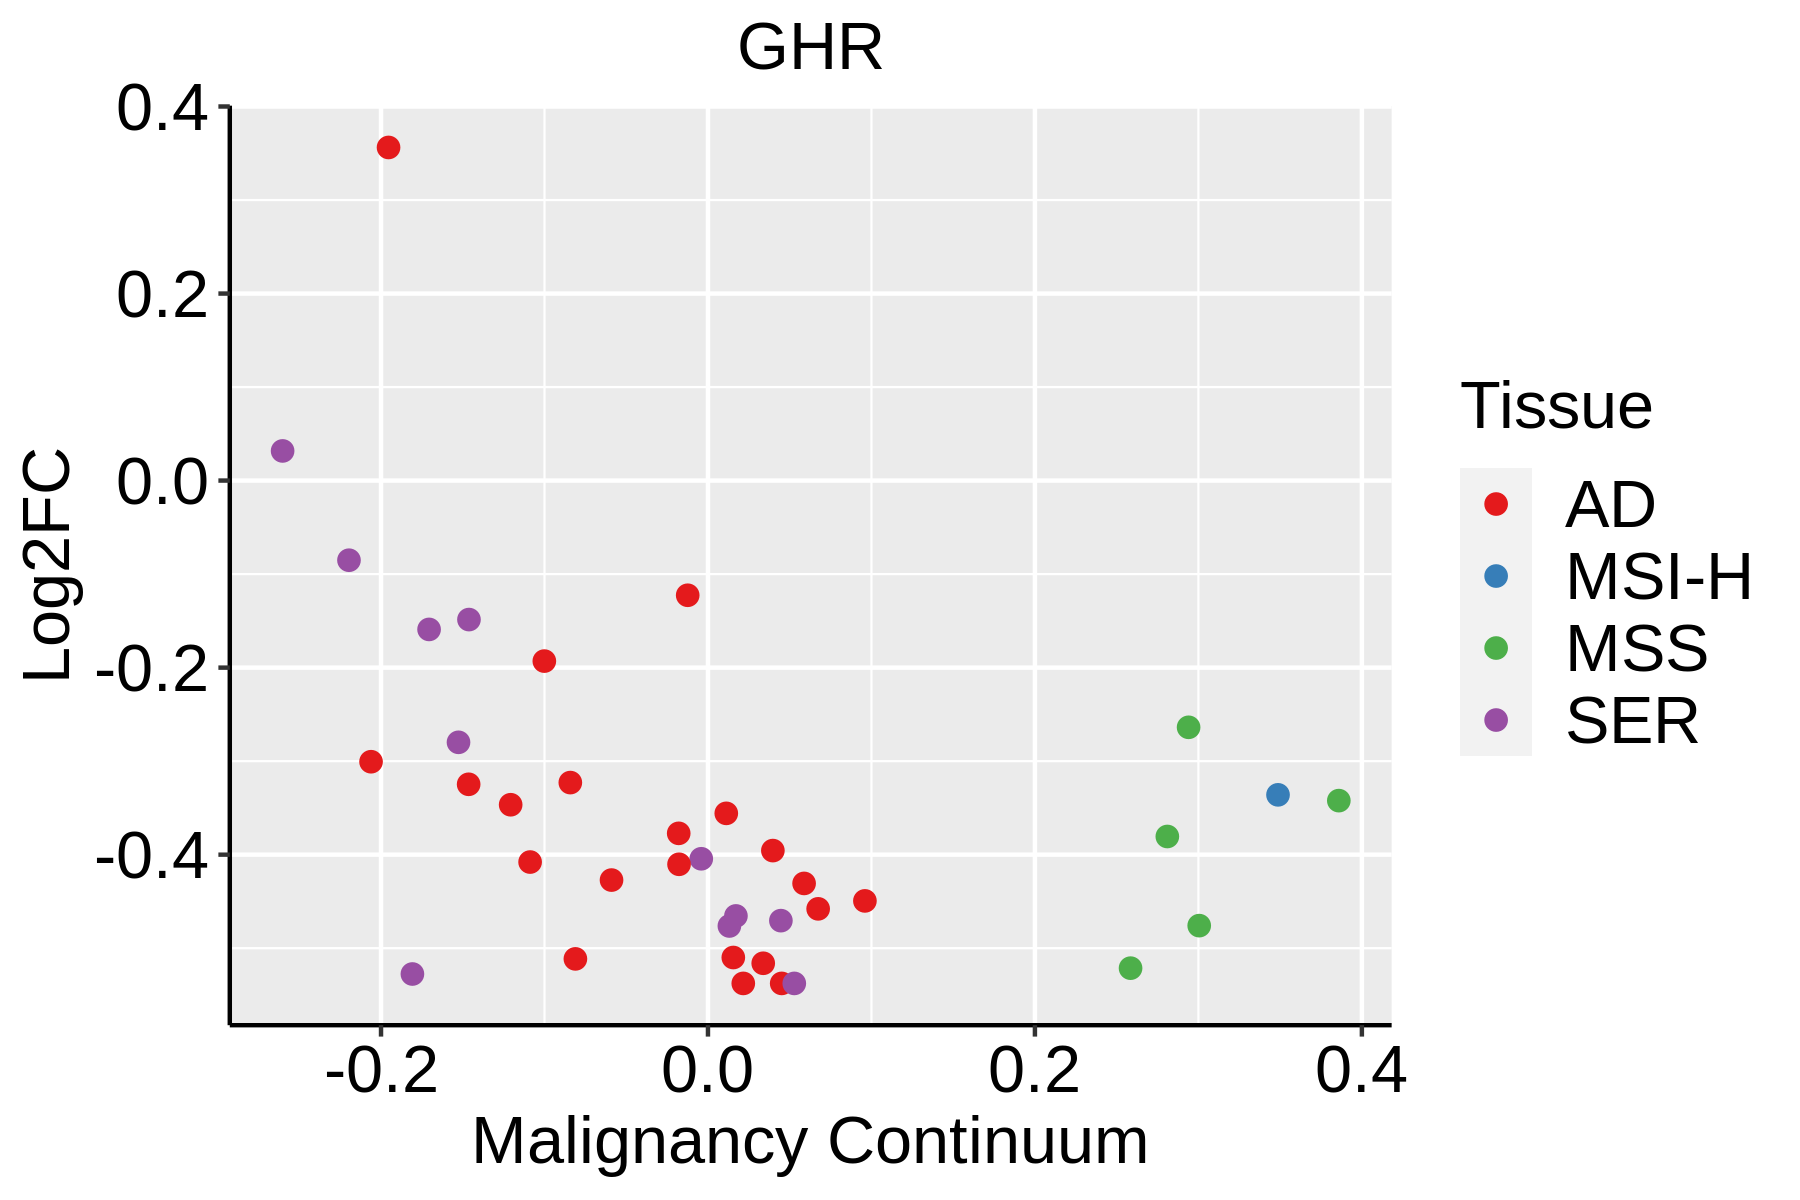
| hsa04935 | Colorectum | MSS | Growth hormone synthesis, secretion and action | 42/1875 | 120/8465 | 8.17e-04 | 5.16e-03 | 3.16e-03 | 42 |
| hsa049351 | Colorectum | MSS | Growth hormone synthesis, secretion and action | 42/1875 | 120/8465 | 8.17e-04 | 5.16e-03 | 3.16e-03 | 42 |
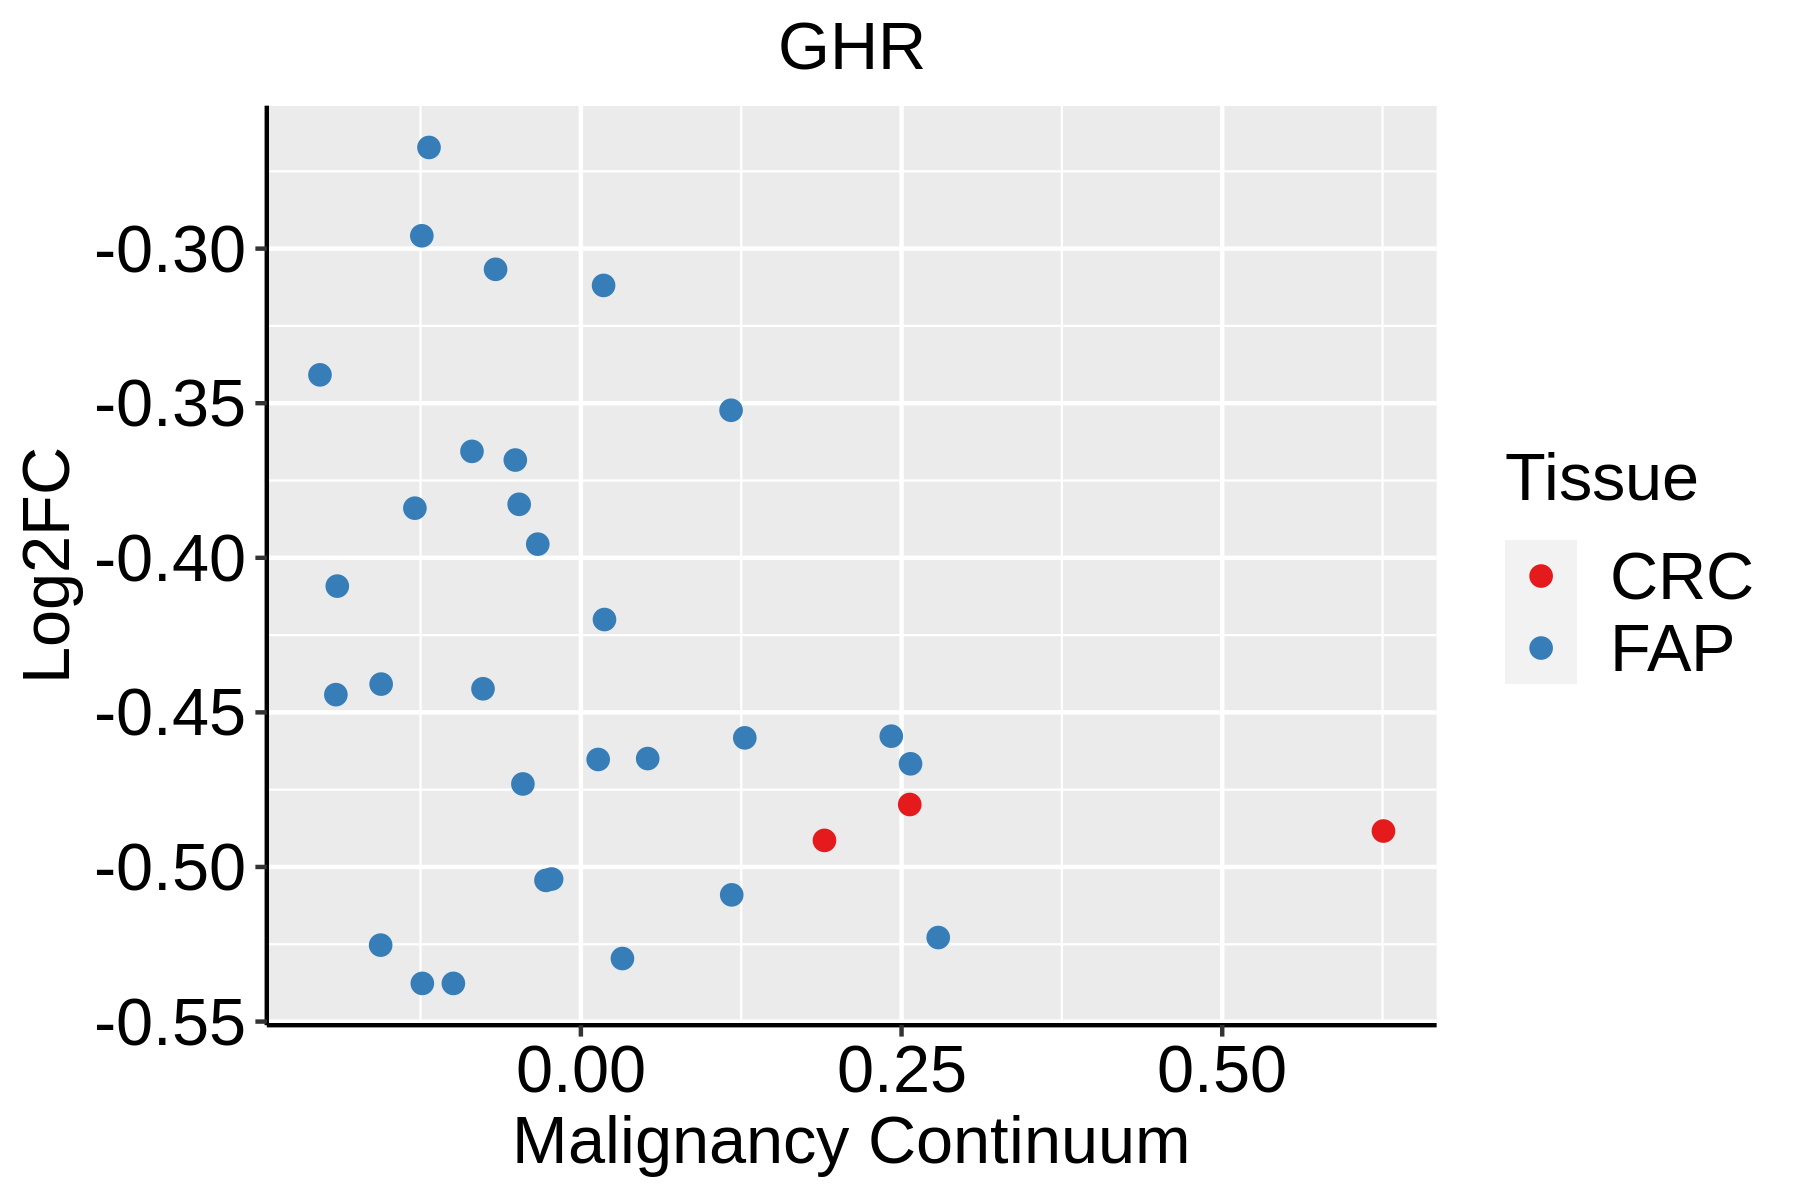
| hsa049352 | Colorectum | FAP | Growth hormone synthesis, secretion and action | 34/1404 | 120/8465 | 8.12e-04 | 5.14e-03 | 3.13e-03 | 34 |
| hsa04151 | Colorectum | FAP | PI3K-Akt signaling pathway | 75/1404 | 354/8465 | 1.23e-02 | 4.19e-02 | 2.55e-02 | 75 |
| hsa049353 | Colorectum | FAP | Growth hormone synthesis, secretion and action | 34/1404 | 120/8465 | 8.12e-04 | 5.14e-03 | 3.13e-03 | 34 |
| hsa041511 | Colorectum | FAP | PI3K-Akt signaling pathway | 75/1404 | 354/8465 | 1.23e-02 | 4.19e-02 | 2.55e-02 | 75 |
| hsa049354 | Colorectum | CRC | Growth hormone synthesis, secretion and action | 27/1091 | 120/8465 | 2.37e-03 | 1.69e-02 | 1.14e-02 | 27 |
| hsa041512 | Colorectum | CRC | PI3K-Akt signaling pathway | 64/1091 | 354/8465 | 2.70e-03 | 1.77e-02 | 1.20e-02 | 64 |
| hsa049355 | Colorectum | CRC | Growth hormone synthesis, secretion and action | 27/1091 | 120/8465 | 2.37e-03 | 1.69e-02 | 1.14e-02 | 27 |
| hsa041513 | Colorectum | CRC | PI3K-Akt signaling pathway | 64/1091 | 354/8465 | 2.70e-03 | 1.77e-02 | 1.20e-02 | 64 |
| Hugo Symbol | Variant Class | Variant Classification | dbSNP RS | HGVSc | HGVSp | HGVSp Short | SWISSPROT | BIOTYPE | SIFT | PolyPhen | Tumor Sample Barcode | Tissue | Histology | Sex | Age | Stage | Therapy Types | Drugs | Outcome |
| GHR | SNV | Missense_Mutation | | c.1288N>A | p.Leu430Ile | p.L430I | | protein_coding | deleterious(0.03) | possibly_damaging(0.506) | TCGA-AN-A046-01 | Breast | breast invasive carcinoma | Female | >=65 | I/II | Unknown | Unknown | SD |
| GHR | SNV | Missense_Mutation | novel | c.1859N>T | p.Ala620Val | p.A620V | | protein_coding | tolerated(0.24) | probably_damaging(0.998) | TCGA-AN-A046-01 | Breast | breast invasive carcinoma | Female | >=65 | I/II | Unknown | Unknown | SD |
| GHR | SNV | Missense_Mutation | | c.402N>G | p.Ile134Met | p.I134M | | protein_coding | tolerated(0.38) | probably_damaging(0.985) | TCGA-AO-A03V-01 | Breast | breast invasive carcinoma | Female | <65 | I/II | Chemotherapy | fluorouracil | SD |
| GHR | insertion | Nonsense_Mutation | novel | c.151_152insCCTTAGCCCCGAGGTAGTGTCTAGGGGTGGGGTGCCTGCAACCCC | p.Lys51delinsThrLeuAlaProArgTerCysLeuGlyValGlyCysLeuGlnProGln | p.K51delinsTLAPR*CLGVGCLQPQ | | protein_coding | | | TCGA-AN-A04C-01 | Breast | breast invasive carcinoma | Female | <65 | I/II | Unknown | Unknown | SD |
| GHR | insertion | Frame_Shift_Ins | novel | c.1715_1716insCAAAATGAGATCTATG | p.Tyr573LysfsTer29 | p.Y573Kfs*29 | | protein_coding | | | TCGA-AO-A03R-01 | Breast | breast invasive carcinoma | Female | <65 | I/II | Chemotherapy | doxorubicin | SD |
| GHR | insertion | Frame_Shift_Ins | novel | c.804_805insT | p.Asp269Ter | p.D269* | | protein_coding | | | TCGA-AO-A128-01 | Breast | breast invasive carcinoma | Female | <65 | I/II | Chemotherapy | doxorubicin | SD |
| GHR | deletion | Frame_Shift_Del | novel | c.302delN | p.Trp101Ter | p.W101* | | protein_coding | | | TCGA-D8-A27V-01 | Breast | breast invasive carcinoma | Female | <65 | I/II | Hormone Therapy | tamoxiphen | SD |
| GHR | SNV | Missense_Mutation | | c.113G>C | p.Arg38Thr | p.R38T | | protein_coding | tolerated_low_confidence(0.26) | benign(0.075) | TCGA-EA-A3HQ-01 | Cervix | cervical & endocervical cancer | Female | <65 | I/II | Unknown | Unknown | SD |
| GHR | SNV | Missense_Mutation | | c.1759N>A | p.Gly587Arg | p.G587R | | protein_coding | tolerated(0.36) | possibly_damaging(0.453) | TCGA-EK-A2GZ-01 | Cervix | cervical & endocervical cancer | Female | <65 | III/IV | Unknown | Unknown | SD |
| GHR | SNV | Missense_Mutation | rs775194712 | c.1853C>T | p.Ala618Val | p.A618V | | protein_coding | deleterious(0.02) | probably_damaging(0.974) | TCGA-EX-A3L1-01 | Cervix | cervical & endocervical cancer | Female | <65 | I/II | Chemotherapy | cisplatin | CR |
| Entrez ID | Symbol | Category | Interaction Types | Drug Claim Name | Drug Name | PMIDs |
| 2690 | GHR | DRUGGABLE GENOME, EXTERNAL SIDE OF PLASMA MEMBRANE, CELL SURFACE | | Syntropin | | |
| 2690 | GHR | DRUGGABLE GENOME, EXTERNAL SIDE OF PLASMA MEMBRANE, CELL SURFACE | | EP-51216 | | |
| 2690 | GHR | DRUGGABLE GENOME, EXTERNAL SIDE OF PLASMA MEMBRANE, CELL SURFACE | | ACCCRETROPIN | | |
| 2690 | GHR | DRUGGABLE GENOME, EXTERNAL SIDE OF PLASMA MEMBRANE, CELL SURFACE | | BVT-A | | |
| 2690 | GHR | DRUGGABLE GENOME, EXTERNAL SIDE OF PLASMA MEMBRANE, CELL SURFACE | | Pegvisomant | PEGVISOMANT | |
| 2690 | GHR | DRUGGABLE GENOME, EXTERNAL SIDE OF PLASMA MEMBRANE, CELL SURFACE | | ACP-001 | ACP-001 | |
| 2690 | GHR | DRUGGABLE GENOME, EXTERNAL SIDE OF PLASMA MEMBRANE, CELL SURFACE | | AOD9604 | | |
| 2690 | GHR | DRUGGABLE GENOME, EXTERNAL SIDE OF PLASMA MEMBRANE, CELL SURFACE | agonist | 178101641 | | |
| 2690 | GHR | DRUGGABLE GENOME, EXTERNAL SIDE OF PLASMA MEMBRANE, CELL SURFACE | antagonist | CHEMBL1201515 | PEGVISOMANT | |
| 2690 | GHR | DRUGGABLE GENOME, EXTERNAL SIDE OF PLASMA MEMBRANE, CELL SURFACE | agonist | CHEMBL1201620 | SOMATREM | |