
|
|||||
|
 | |
| |
| |
| |
| |
| |
|
Gene: GART |
Gene summary for GART |
| Gene information | Species | Human | Gene symbol | GART | Gene ID | 2618 |
| Gene name | phosphoribosylglycinamide formyltransferase, phosphoribosylglycinamide synthetase, phosphoribosylaminoimidazole synthetase | |
| Gene Alias | AIRS | |
| Cytomap | 21q22.11 | |
| Gene Type | protein-coding | GO ID | GO:0003360 | UniProtAcc | P22102 |
Top |
Malignant transformation analysis |
| Identification of the aberrant gene expression in precancerous and cancerous lesions by comparing the gene expression of stem-like cells in diseased tissues with normal stem cells |
| Entrez ID | Symbol | Replicates | Species | Organ | Tissue | Adj P-value | Log2FC | Malignancy |
| 2618 | GART | HTA11_99999970781_79442 | Human | Colorectum | MSS | 1.70e-09 | 6.39e-01 | 0.294 |
| 2618 | GART | HTA11_99999965062_69753 | Human | Colorectum | MSI-H | 2.79e-04 | 1.10e+00 | 0.3487 |
| 2618 | GART | HTA11_99999965104_69814 | Human | Colorectum | MSS | 5.39e-07 | 7.51e-01 | 0.281 |
| 2618 | GART | HTA11_99999971662_82457 | Human | Colorectum | MSS | 9.06e-05 | 5.87e-01 | 0.3859 |
| 2618 | GART | A015-C-203 | Human | Colorectum | FAP | 2.34e-08 | -2.14e-01 | -0.1294 |
| 2618 | GART | A015-C-204 | Human | Colorectum | FAP | 1.52e-03 | -2.37e-01 | -0.0228 |
| 2618 | GART | A002-C-201 | Human | Colorectum | FAP | 9.32e-07 | -1.84e-01 | 0.0324 |
| 2618 | GART | A001-C-119 | Human | Colorectum | FAP | 3.41e-03 | -2.46e-01 | -0.1557 |
| 2618 | GART | A001-C-108 | Human | Colorectum | FAP | 1.18e-03 | -7.50e-02 | -0.0272 |
| 2618 | GART | A002-C-205 | Human | Colorectum | FAP | 5.21e-09 | -1.05e-01 | -0.1236 |
| 2618 | GART | A015-C-006 | Human | Colorectum | FAP | 1.66e-06 | -1.58e-01 | -0.0994 |
| 2618 | GART | A015-C-106 | Human | Colorectum | FAP | 2.69e-02 | -1.23e-01 | -0.0511 |
| 2618 | GART | A002-C-114 | Human | Colorectum | FAP | 7.42e-08 | -2.27e-01 | -0.1561 |
| 2618 | GART | A015-C-104 | Human | Colorectum | FAP | 2.21e-10 | -2.28e-01 | -0.1899 |
| 2618 | GART | A002-C-016 | Human | Colorectum | FAP | 5.82e-09 | -2.06e-01 | 0.0521 |
| 2618 | GART | A015-C-002 | Human | Colorectum | FAP | 2.05e-06 | -3.09e-01 | -0.0763 |
| 2618 | GART | A002-C-116 | Human | Colorectum | FAP | 5.72e-11 | -1.83e-01 | -0.0452 |
| 2618 | GART | A014-C-008 | Human | Colorectum | FAP | 8.97e-05 | -5.24e-02 | -0.191 |
| 2618 | GART | A018-E-020 | Human | Colorectum | FAP | 1.74e-09 | -2.50e-01 | -0.2034 |
| 2618 | GART | F034 | Human | Colorectum | FAP | 6.40e-06 | -1.15e-01 | -0.0665 |
| Page: 1 2 3 4 5 6 7 |
| Tissue | Expression Dynamics | Abbreviation |
| Colorectum (GSE201348) |  | FAP: Familial adenomatous polyposis |
| CRC: Colorectal cancer | ||
| Colorectum (HTA11) |  | AD: Adenomas |
| SER: Sessile serrated lesions | ||
| MSI-H: Microsatellite-high colorectal cancer | ||
| MSS: Microsatellite stable colorectal cancer | ||
| Esophagus |  | ESCC: Esophageal squamous cell carcinoma |
| HGIN: High-grade intraepithelial neoplasias | ||
| LGIN: Low-grade intraepithelial neoplasias | ||
| Liver | 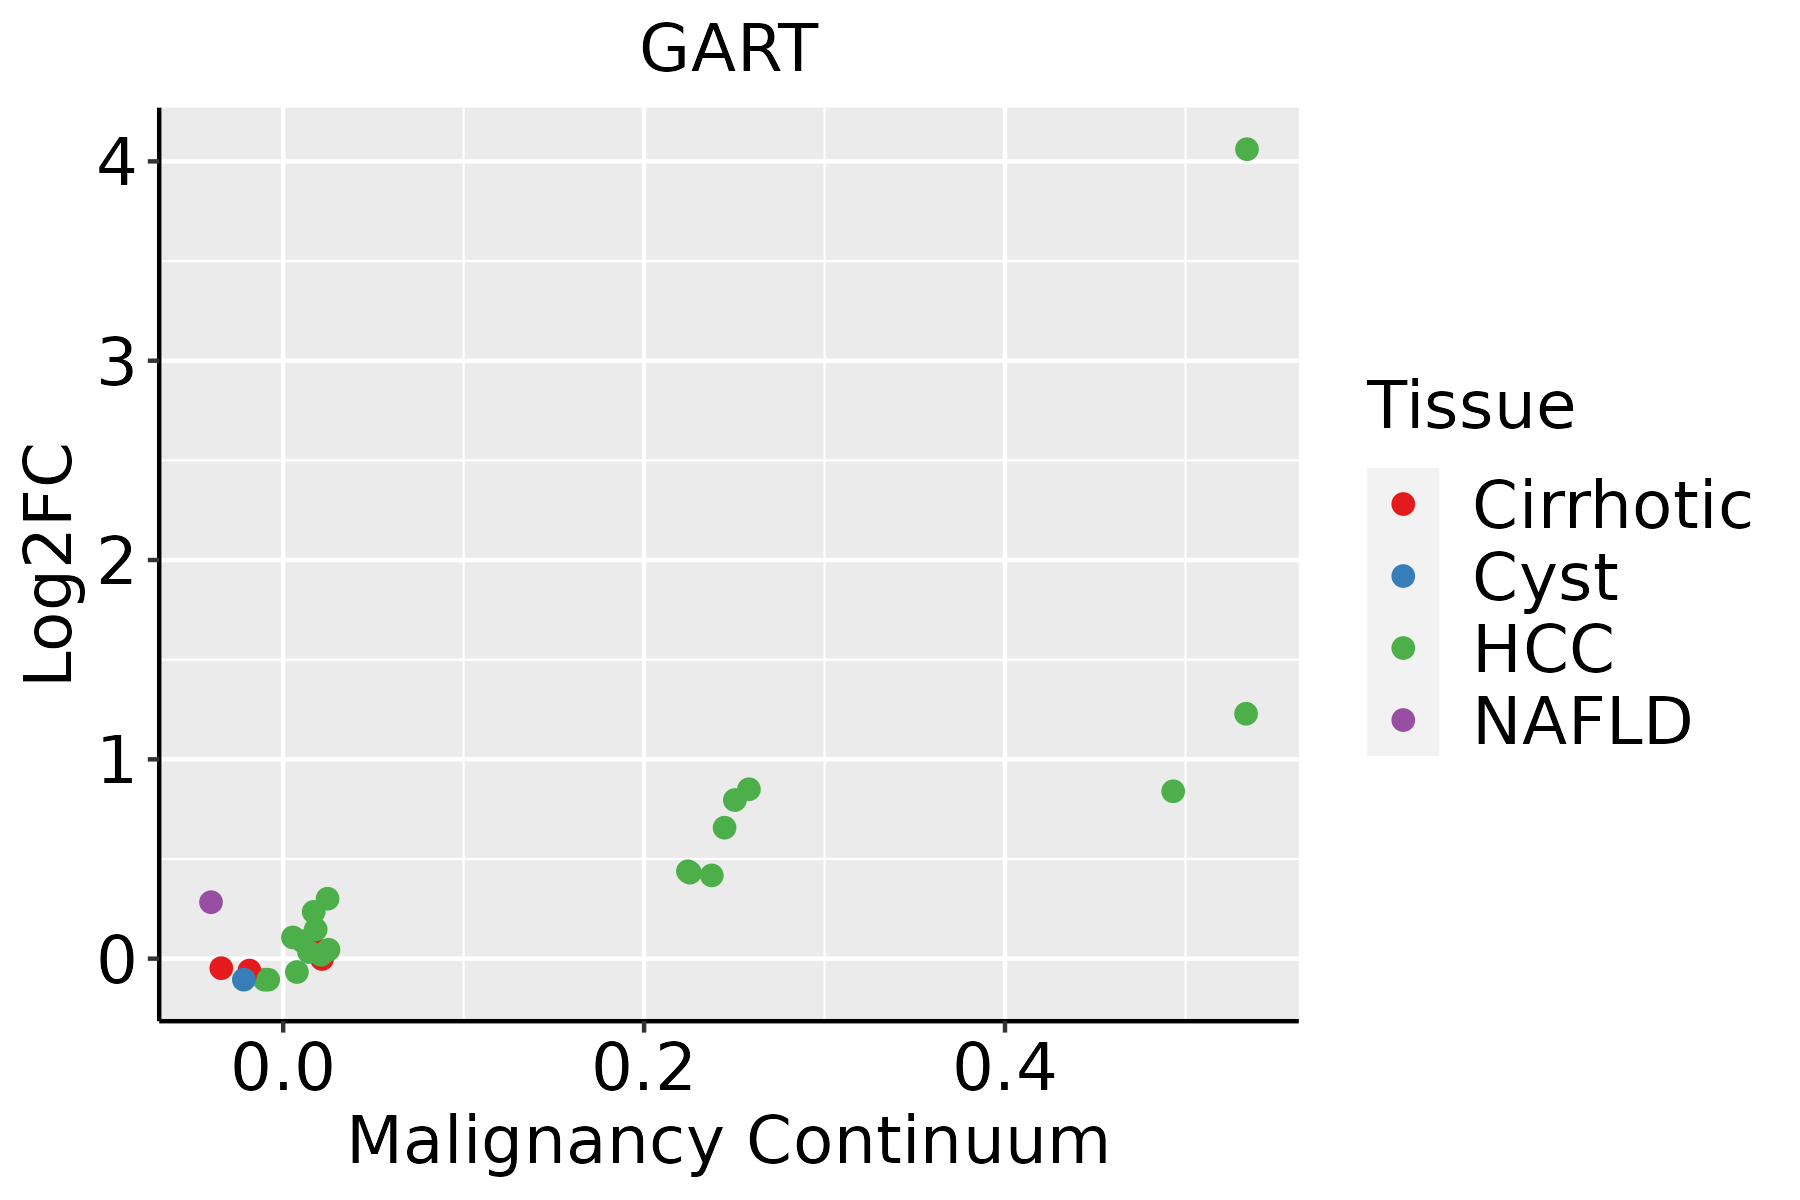 | HCC: Hepatocellular carcinoma |
| NAFLD: Non-alcoholic fatty liver disease | ||
| Oral Cavity | 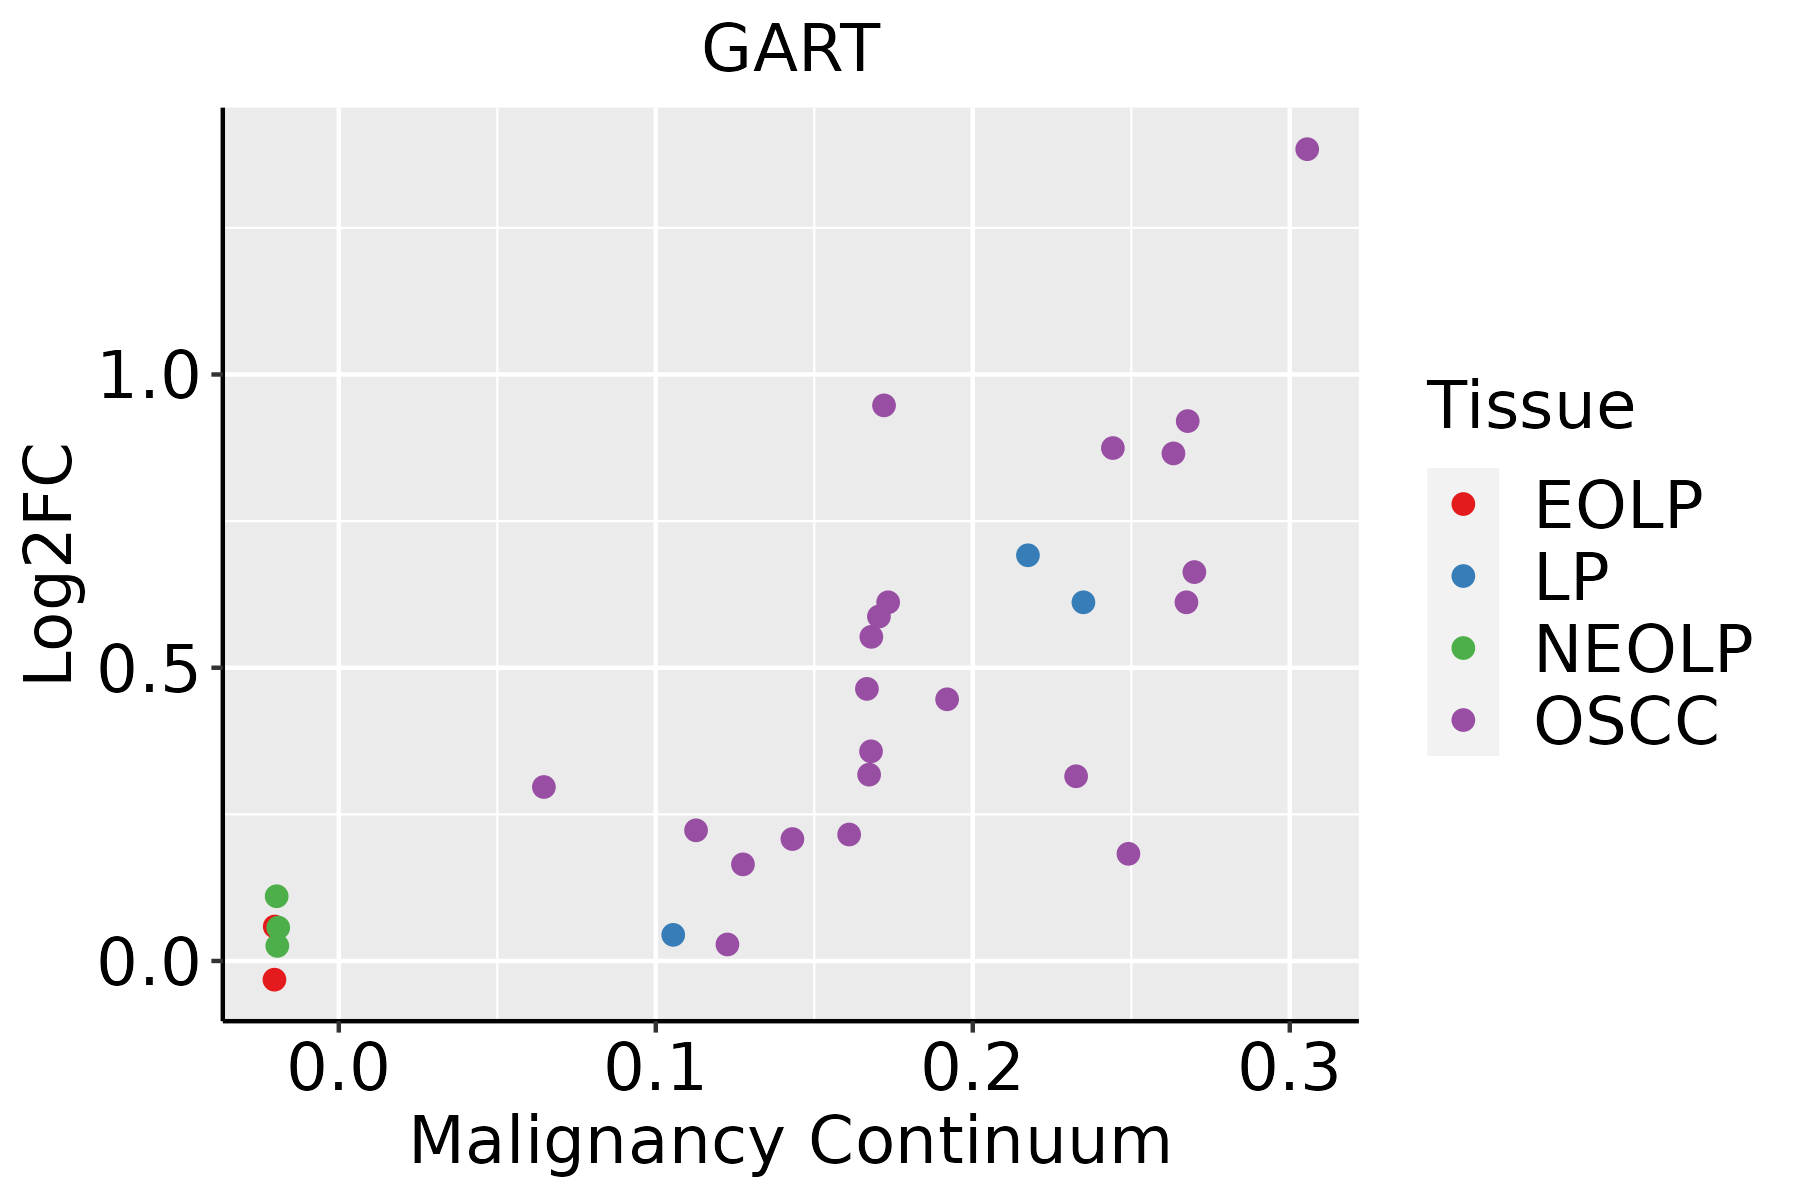 | EOLP: Erosive Oral lichen planus |
| LP: leukoplakia | ||
| NEOLP: Non-erosive oral lichen planus | ||
| OSCC: Oral squamous cell carcinoma | ||
| Skin | 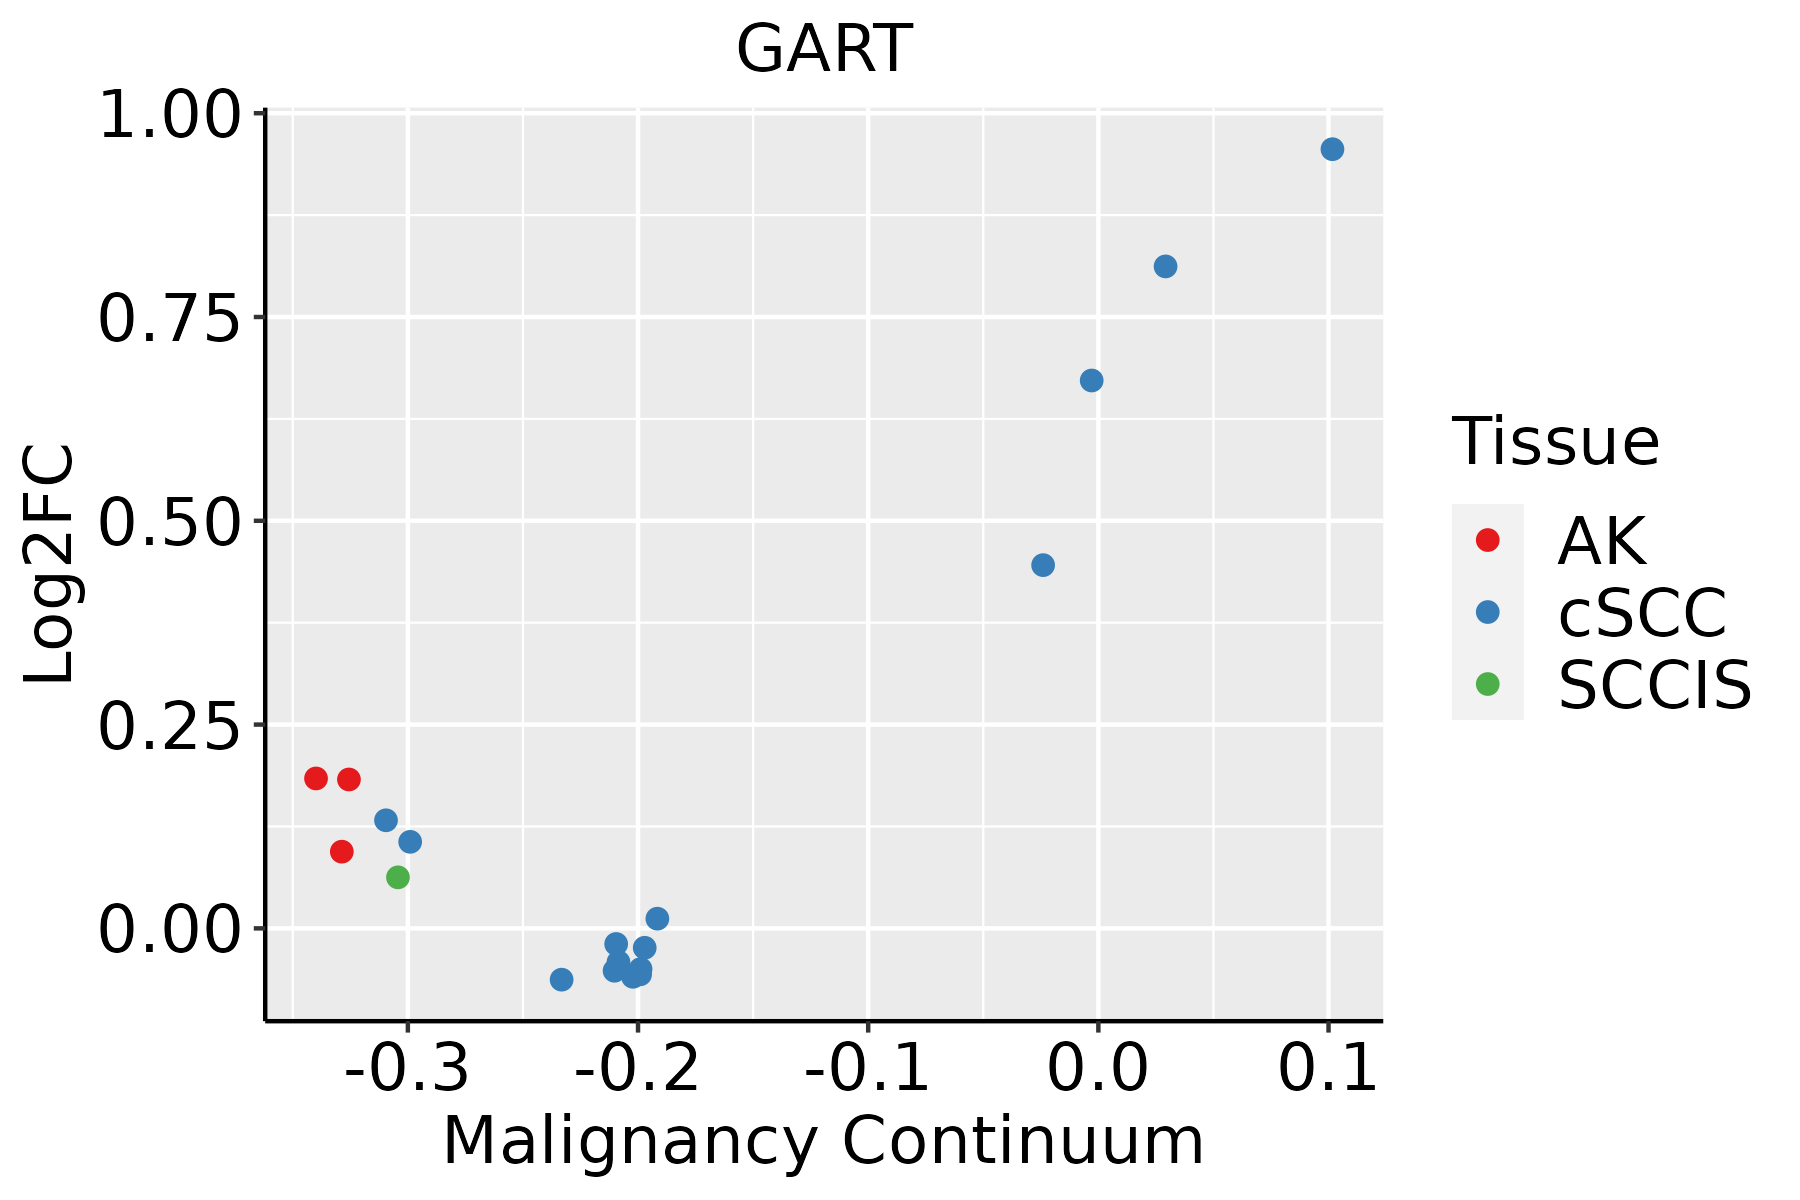 | AK: Actinic keratosis |
| cSCC: Cutaneous squamous cell carcinoma | ||
| SCCIS:squamous cell carcinoma in situ | ||
| Thyroid | 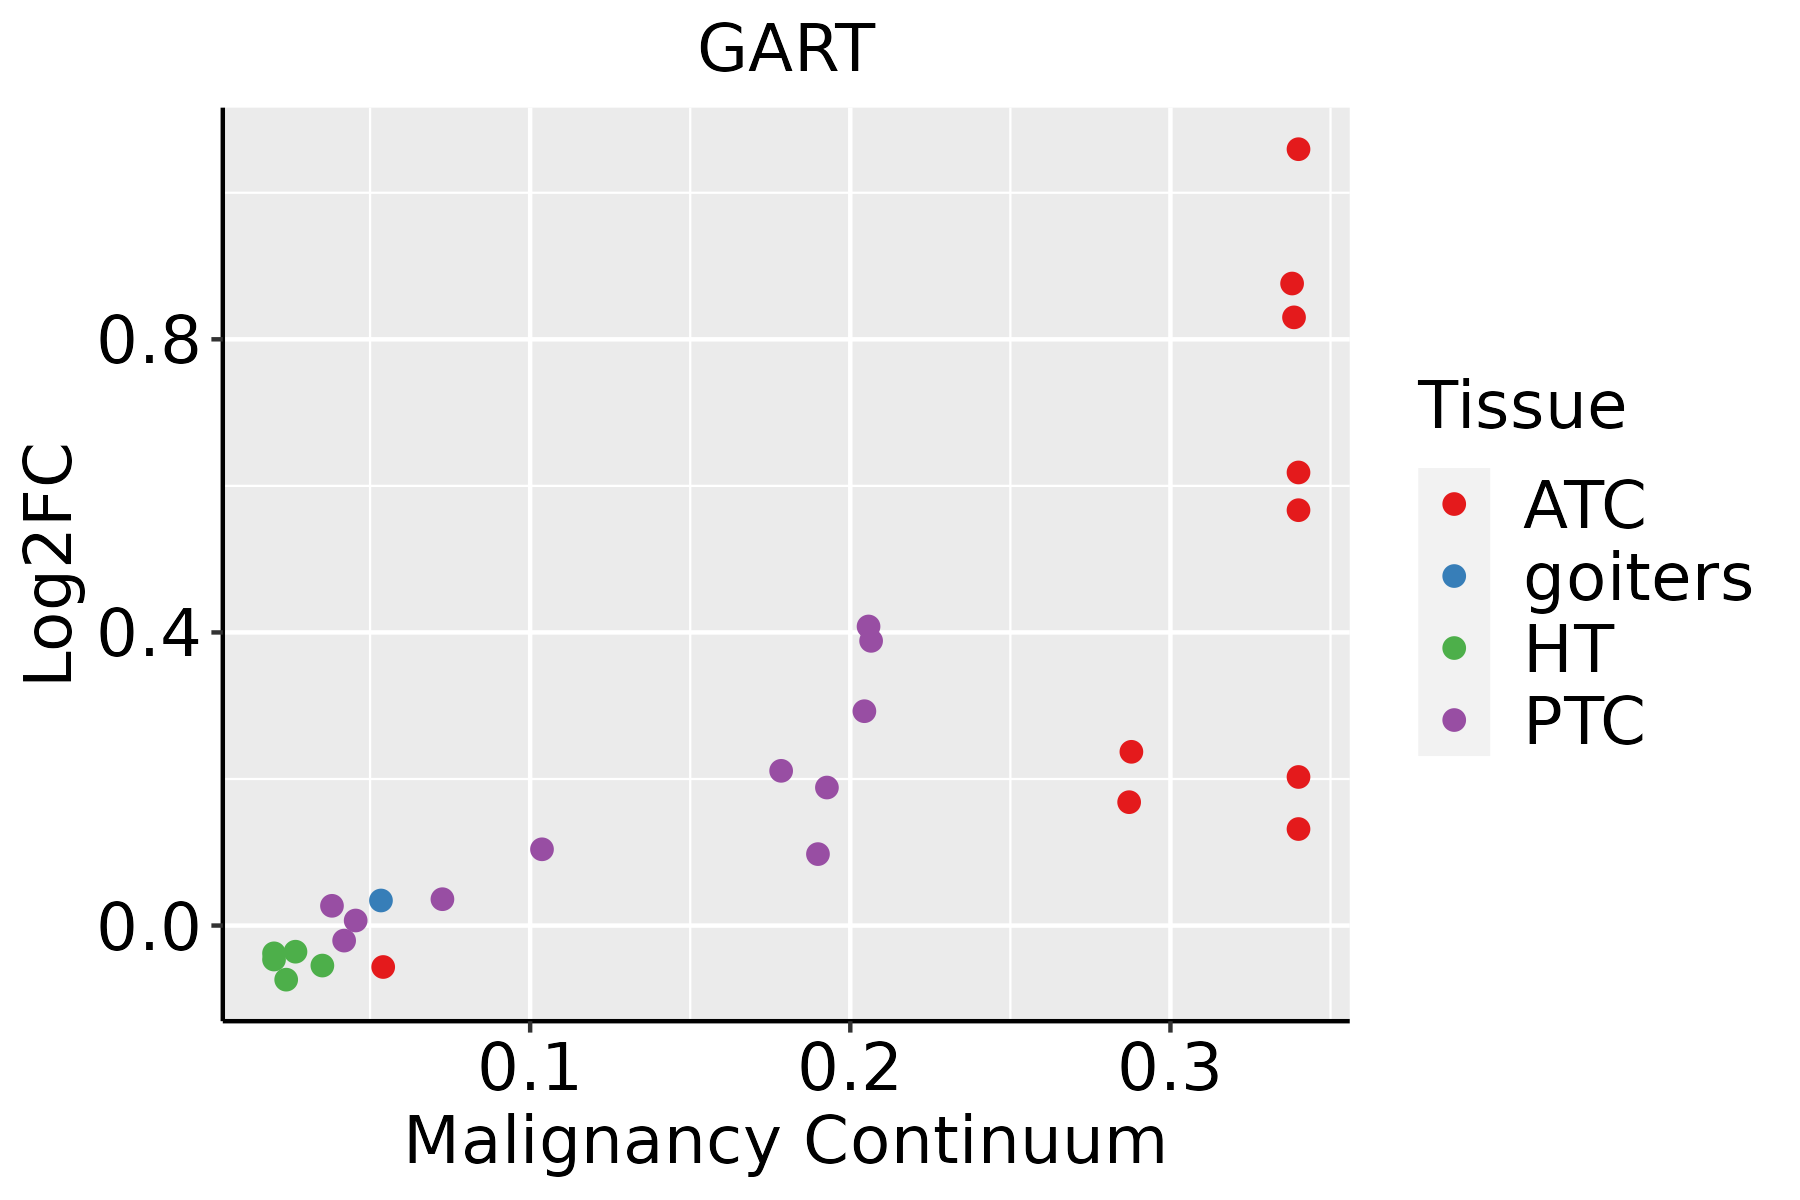 | ATC: Anaplastic thyroid cancer |
| HT: Hashimoto's thyroiditis | ||
| PTC: Papillary thyroid cancer |
| ∗log2FC in expression of this searched gene in stem-like cells from each diseased tissue sample relative to stem-like cells in normal samples in each tissue plotted against the malignancy continuum. Samples are colored based on if they are from different disease stage. |
Top |
Malignant transformation related pathway analysis |
| Find out the enriched GO biological processes and KEGG pathways involved in transition from healthy to precancer to cancer |
| Tissue | Disease Stage | Enriched GO biological Processes |
| Colorectum | AD |  |
| Colorectum | SER |  |
| Colorectum | MSS |  |
| Colorectum | MSI-H |  |
| Colorectum | FAP |  |
| ∗Top 15 enriched GO BP terms are showed in the bar plot of each disease state in each tissue. Each row represents a significant GO biological process which is colored according to the -log10(p.adjust). |
| Page: 1 2 3 4 5 6 7 8 9 |
| GO ID | Tissue | Disease Stage | Description | Gene Ratio | Bg Ratio | pvalue | p.adjust | Count |
| GO:000616312 | Liver | Cirrhotic | purine nucleotide metabolic process | 146/4634 | 396/18723 | 4.12e-08 | 1.34e-06 | 146 |
| GO:19016051 | Liver | Cirrhotic | alpha-amino acid metabolic process | 82/4634 | 195/18723 | 7.72e-08 | 2.30e-06 | 82 |
| GO:000652011 | Liver | Cirrhotic | cellular amino acid metabolic process | 103/4634 | 284/18723 | 8.88e-06 | 1.30e-04 | 103 |
| GO:00091232 | Liver | Cirrhotic | nucleoside monophosphate metabolic process | 36/4634 | 76/18723 | 1.55e-05 | 2.11e-04 | 36 |
| GO:004239811 | Liver | Cirrhotic | cellular modified amino acid biosynthetic process | 25/4634 | 46/18723 | 1.61e-05 | 2.19e-04 | 25 |
| GO:00091121 | Liver | Cirrhotic | nucleobase metabolic process | 20/4634 | 34/18723 | 2.41e-05 | 3.14e-04 | 20 |
| GO:000916111 | Liver | Cirrhotic | ribonucleoside monophosphate metabolic process | 29/4634 | 58/18723 | 2.87e-05 | 3.64e-04 | 29 |
| GO:00090691 | Liver | Cirrhotic | serine family amino acid metabolic process | 22/4634 | 40/18723 | 4.04e-05 | 4.82e-04 | 22 |
| GO:00463905 | Liver | Cirrhotic | ribose phosphate biosynthetic process | 71/4634 | 190/18723 | 7.09e-05 | 7.98e-04 | 71 |
| GO:00091265 | Liver | Cirrhotic | purine nucleoside monophosphate metabolic process | 23/4634 | 44/18723 | 7.87e-05 | 8.61e-04 | 23 |
| GO:000657511 | Liver | Cirrhotic | cellular modified amino acid metabolic process | 70/4634 | 188/18723 | 9.04e-05 | 9.69e-04 | 70 |
| GO:00092605 | Liver | Cirrhotic | ribonucleotide biosynthetic process | 68/4634 | 182/18723 | 1.00e-04 | 1.05e-03 | 68 |
| GO:00091654 | Liver | Cirrhotic | nucleotide biosynthetic process | 89/4634 | 254/18723 | 1.45e-04 | 1.40e-03 | 89 |
| GO:19012934 | Liver | Cirrhotic | nucleoside phosphate biosynthetic process | 89/4634 | 256/18723 | 1.97e-04 | 1.82e-03 | 89 |
| GO:00091675 | Liver | Cirrhotic | purine ribonucleoside monophosphate metabolic process | 21/4634 | 41/18723 | 2.32e-04 | 2.11e-03 | 21 |
| GO:00091526 | Liver | Cirrhotic | purine ribonucleotide biosynthetic process | 62/4634 | 169/18723 | 3.52e-04 | 3.00e-03 | 62 |
| GO:0046112 | Liver | Cirrhotic | nucleobase biosynthetic process | 11/4634 | 18/18723 | 1.13e-03 | 7.73e-03 | 11 |
| GO:00725225 | Liver | Cirrhotic | purine-containing compound biosynthetic process | 69/4634 | 200/18723 | 1.22e-03 | 8.24e-03 | 69 |
| GO:0006544 | Liver | Cirrhotic | glycine metabolic process | 10/4634 | 16/18723 | 1.51e-03 | 9.91e-03 | 10 |
| GO:00061645 | Liver | Cirrhotic | purine nucleotide biosynthetic process | 65/4634 | 191/18723 | 2.42e-03 | 1.46e-02 | 65 |
| Page: 1 2 3 4 5 6 7 8 9 10 11 12 13 14 15 |
| Pathway ID | Tissue | Disease Stage | Description | Gene Ratio | Bg Ratio | pvalue | p.adjust | qvalue | Count |
| hsa00670 | Colorectum | MSI-H | One carbon pool by folate | 7/797 | 20/8465 | 1.65e-03 | 1.73e-02 | 1.45e-02 | 7 |
| hsa006701 | Colorectum | MSI-H | One carbon pool by folate | 7/797 | 20/8465 | 1.65e-03 | 1.73e-02 | 1.45e-02 | 7 |
| hsa015232 | Esophagus | ESCC | Antifolate resistance | 22/4205 | 30/8465 | 7.23e-03 | 1.76e-02 | 8.99e-03 | 22 |
| hsa0152311 | Esophagus | ESCC | Antifolate resistance | 22/4205 | 30/8465 | 7.23e-03 | 1.76e-02 | 8.99e-03 | 22 |
| hsa006702 | Liver | HCC | One carbon pool by folate | 17/4020 | 20/8465 | 6.04e-04 | 2.50e-03 | 1.39e-03 | 17 |
| hsa01523 | Liver | HCC | Antifolate resistance | 21/4020 | 30/8465 | 1.06e-02 | 2.71e-02 | 1.51e-02 | 21 |
| hsa0067011 | Liver | HCC | One carbon pool by folate | 17/4020 | 20/8465 | 6.04e-04 | 2.50e-03 | 1.39e-03 | 17 |
| hsa015231 | Liver | HCC | Antifolate resistance | 21/4020 | 30/8465 | 1.06e-02 | 2.71e-02 | 1.51e-02 | 21 |
| Page: 1 |
Top |
Cell-cell communication analysis |
| Identification of potential cell-cell interactions between two cell types and their ligand-receptor pairs for different disease states |
| Ligand | Receptor | LRpair | Pathway | Tissue | Disease Stage |
| Page: 1 |
Top |
Single-cell gene regulatory network inference analysis |
| Find out the significant the regulons (TFs) and the target genes of each regulon across cell types for different disease states |
| TF | Cell Type | Tissue | Disease Stage | Target Gene | RSS | Regulon Activity |
| ∗The dot plots of a searched regulon are shown for all cell subpopulations in each disease state of each tissue based on the regulon specific score inferred using pySCENIC and by calculating the average expression. |
| Page: 1 |
Top |
Somatic mutation of malignant transformation related genes |
| Annotation of somatic variants for genes involved in malignant transformation |
| Hugo Symbol | Variant Class | Variant Classification | dbSNP RS | HGVSc | HGVSp | HGVSp Short | SWISSPROT | BIOTYPE | SIFT | PolyPhen | Tumor Sample Barcode | Tissue | Histology | Sex | Age | Stage | Therapy Types | Drugs | Outcome |
| GART | SNV | Missense_Mutation | novel | c.2695N>A | p.Leu899Ile | p.L899I | P22102 | protein_coding | tolerated(0.07) | probably_damaging(0.987) | TCGA-AN-A046-01 | Breast | breast invasive carcinoma | Female | >=65 | I/II | Unknown | Unknown | SD |
| GART | SNV | Missense_Mutation | c.667G>C | p.Glu223Gln | p.E223Q | P22102 | protein_coding | deleterious(0.01) | benign(0.179) | TCGA-BH-A1FC-01 | Breast | breast invasive carcinoma | Female | >=65 | I/II | Unknown | Unknown | SD | |
| GART | SNV | Missense_Mutation | c.1193N>T | p.Ser398Leu | p.S398L | P22102 | protein_coding | tolerated(0.39) | benign(0.011) | TCGA-C8-A26Y-01 | Breast | breast invasive carcinoma | Female | >=65 | I/II | Unknown | Unknown | SD | |
| GART | SNV | Missense_Mutation | c.342N>A | p.Met114Ile | p.M114I | P22102 | protein_coding | deleterious(0) | probably_damaging(0.959) | TCGA-C8-A26Y-01 | Breast | breast invasive carcinoma | Female | >=65 | I/II | Unknown | Unknown | SD | |
| GART | insertion | In_Frame_Ins | novel | c.1301_1302insCATACATATCCT | p.Ser434_Leu435insIleHisIleLeu | p.S434_L435insIHIL | P22102 | protein_coding | TCGA-AR-A0U0-01 | Breast | breast invasive carcinoma | Female | >=65 | I/II | Unknown | Unknown | SD | ||
| GART | deletion | Frame_Shift_Del | c.3002delA | p.Asn1001MetfsTer14 | p.N1001Mfs*14 | P22102 | protein_coding | TCGA-BH-A18G-01 | Breast | breast invasive carcinoma | Female | >=65 | I/II | Unknown | Unknown | SD | |||
| GART | deletion | Frame_Shift_Del | rs777845343 | c.2420delA | p.Lys807ArgfsTer7 | p.K807Rfs*7 | P22102 | protein_coding | TCGA-D8-A1XK-01 | Breast | breast invasive carcinoma | Female | <65 | I/II | Chemotherapy | doxorubicine+cyclophosphamide | SD | ||
| GART | SNV | Missense_Mutation | c.1237G>A | p.Glu413Lys | p.E413K | P22102 | protein_coding | tolerated(0.33) | benign(0.012) | TCGA-C5-A8XJ-01 | Cervix | cervical & endocervical cancer | Female | >=65 | I/II | Chemotherapy | cisplatin | SD | |
| GART | SNV | Missense_Mutation | c.2488N>C | p.Glu830Gln | p.E830Q | P22102 | protein_coding | tolerated(0.26) | benign(0.006) | TCGA-JW-A852-01 | Cervix | cervical & endocervical cancer | Female | <65 | I/II | Unknown | Unknown | PD | |
| GART | SNV | Missense_Mutation | c.763N>A | p.Leu255Ile | p.L255I | P22102 | protein_coding | tolerated(0.1) | probably_damaging(0.947) | TCGA-AA-A010-01 | Colorectum | colon adenocarcinoma | Female | <65 | I/II | Chemotherapy | folinic | CR |
| Page: 1 2 3 4 5 6 7 8 9 |
Top |
Related drugs of malignant transformation related genes |
| Identification of chemicals and drugs interact with genes involved in malignant transfromation |
| (DGIdb 4.0) |
| Entrez ID | Symbol | Category | Interaction Types | Drug Claim Name | Drug Name | PMIDs |
| 2618 | GART | ENZYME, DRUGGABLE GENOME | inhibitor | CHEMBL1200373 | ||
| 2618 | GART | ENZYME, DRUGGABLE GENOME | PEMETREXED | PEMETREXED | ||
| 2618 | GART | ENZYME, DRUGGABLE GENOME | PELITREXOL | PELITREXOL | ||
| 2618 | GART | ENZYME, DRUGGABLE GENOME | LY309887 | |||
| 2618 | GART | ENZYME, DRUGGABLE GENOME | PEMETREXED | PEMETREXED | ||
| 2618 | GART | ENZYME, DRUGGABLE GENOME | AG2034 | |||
| 2618 | GART | ENZYME, DRUGGABLE GENOME | LOMETREXOL | LOMETREXOL | 22243528 |
| Page: 1 |

Copyright 2023-Present -The University of Texas Health Science Center at Houston |