
|
|||||
|
 | |
| |
| |
| |
| |
| |
|
Gene: FST |
Gene summary for FST |
| Gene information | Species | Human | Gene symbol | FST | Gene ID | 10468 |
| Gene name | follistatin | |
| Gene Alias | FS | |
| Cytomap | 5q11.2 | |
| Gene Type | protein-coding | GO ID | GO:0000003 | UniProtAcc | P19883 |
Top |
Malignant transformation analysis |
| Identification of the aberrant gene expression in precancerous and cancerous lesions by comparing the gene expression of stem-like cells in diseased tissues with normal stem cells |
| Entrez ID | Symbol | Replicates | Species | Organ | Tissue | Adj P-value | Log2FC | Malignancy |
| 10468 | FST | LZE4T | Human | Esophagus | ESCC | 3.66e-05 | 8.50e-02 | 0.0811 |
| 10468 | FST | LZE20T | Human | Esophagus | ESCC | 5.78e-03 | 6.29e-02 | 0.0662 |
| 10468 | FST | LZE21T | Human | Esophagus | ESCC | 2.84e-02 | 3.42e-01 | 0.0655 |
| 10468 | FST | P2T-E | Human | Esophagus | ESCC | 1.71e-05 | 2.23e-01 | 0.1177 |
| 10468 | FST | P4T-E | Human | Esophagus | ESCC | 5.99e-37 | 1.92e+00 | 0.1323 |
| 10468 | FST | P9T-E | Human | Esophagus | ESCC | 1.52e-18 | 8.37e-01 | 0.1131 |
| 10468 | FST | P10T-E | Human | Esophagus | ESCC | 3.35e-80 | 1.75e+00 | 0.116 |
| 10468 | FST | P11T-E | Human | Esophagus | ESCC | 1.81e-02 | 3.11e-01 | 0.1426 |
| 10468 | FST | P12T-E | Human | Esophagus | ESCC | 2.80e-100 | 4.00e+00 | 0.1122 |
| 10468 | FST | P15T-E | Human | Esophagus | ESCC | 2.08e-49 | 2.34e+00 | 0.1149 |
| 10468 | FST | P16T-E | Human | Esophagus | ESCC | 1.65e-11 | 4.88e-01 | 0.1153 |
| 10468 | FST | P17T-E | Human | Esophagus | ESCC | 1.42e-07 | 6.57e-01 | 0.1278 |
| 10468 | FST | P20T-E | Human | Esophagus | ESCC | 1.94e-16 | 5.90e-01 | 0.1124 |
| 10468 | FST | P21T-E | Human | Esophagus | ESCC | 1.03e-59 | 3.43e+00 | 0.1617 |
| 10468 | FST | P22T-E | Human | Esophagus | ESCC | 2.21e-35 | 1.04e+00 | 0.1236 |
| 10468 | FST | P23T-E | Human | Esophagus | ESCC | 2.01e-03 | 3.77e-01 | 0.108 |
| 10468 | FST | P26T-E | Human | Esophagus | ESCC | 1.59e-60 | 2.03e+00 | 0.1276 |
| 10468 | FST | P27T-E | Human | Esophagus | ESCC | 4.51e-30 | 1.24e+00 | 0.1055 |
| 10468 | FST | P28T-E | Human | Esophagus | ESCC | 9.63e-06 | 4.30e-01 | 0.1149 |
| 10468 | FST | P30T-E | Human | Esophagus | ESCC | 5.42e-14 | 1.39e+00 | 0.137 |
| Page: 1 2 3 4 5 |
| Tissue | Expression Dynamics | Abbreviation |
| Esophagus |  | ESCC: Esophageal squamous cell carcinoma |
| HGIN: High-grade intraepithelial neoplasias | ||
| LGIN: Low-grade intraepithelial neoplasias | ||
| Liver | 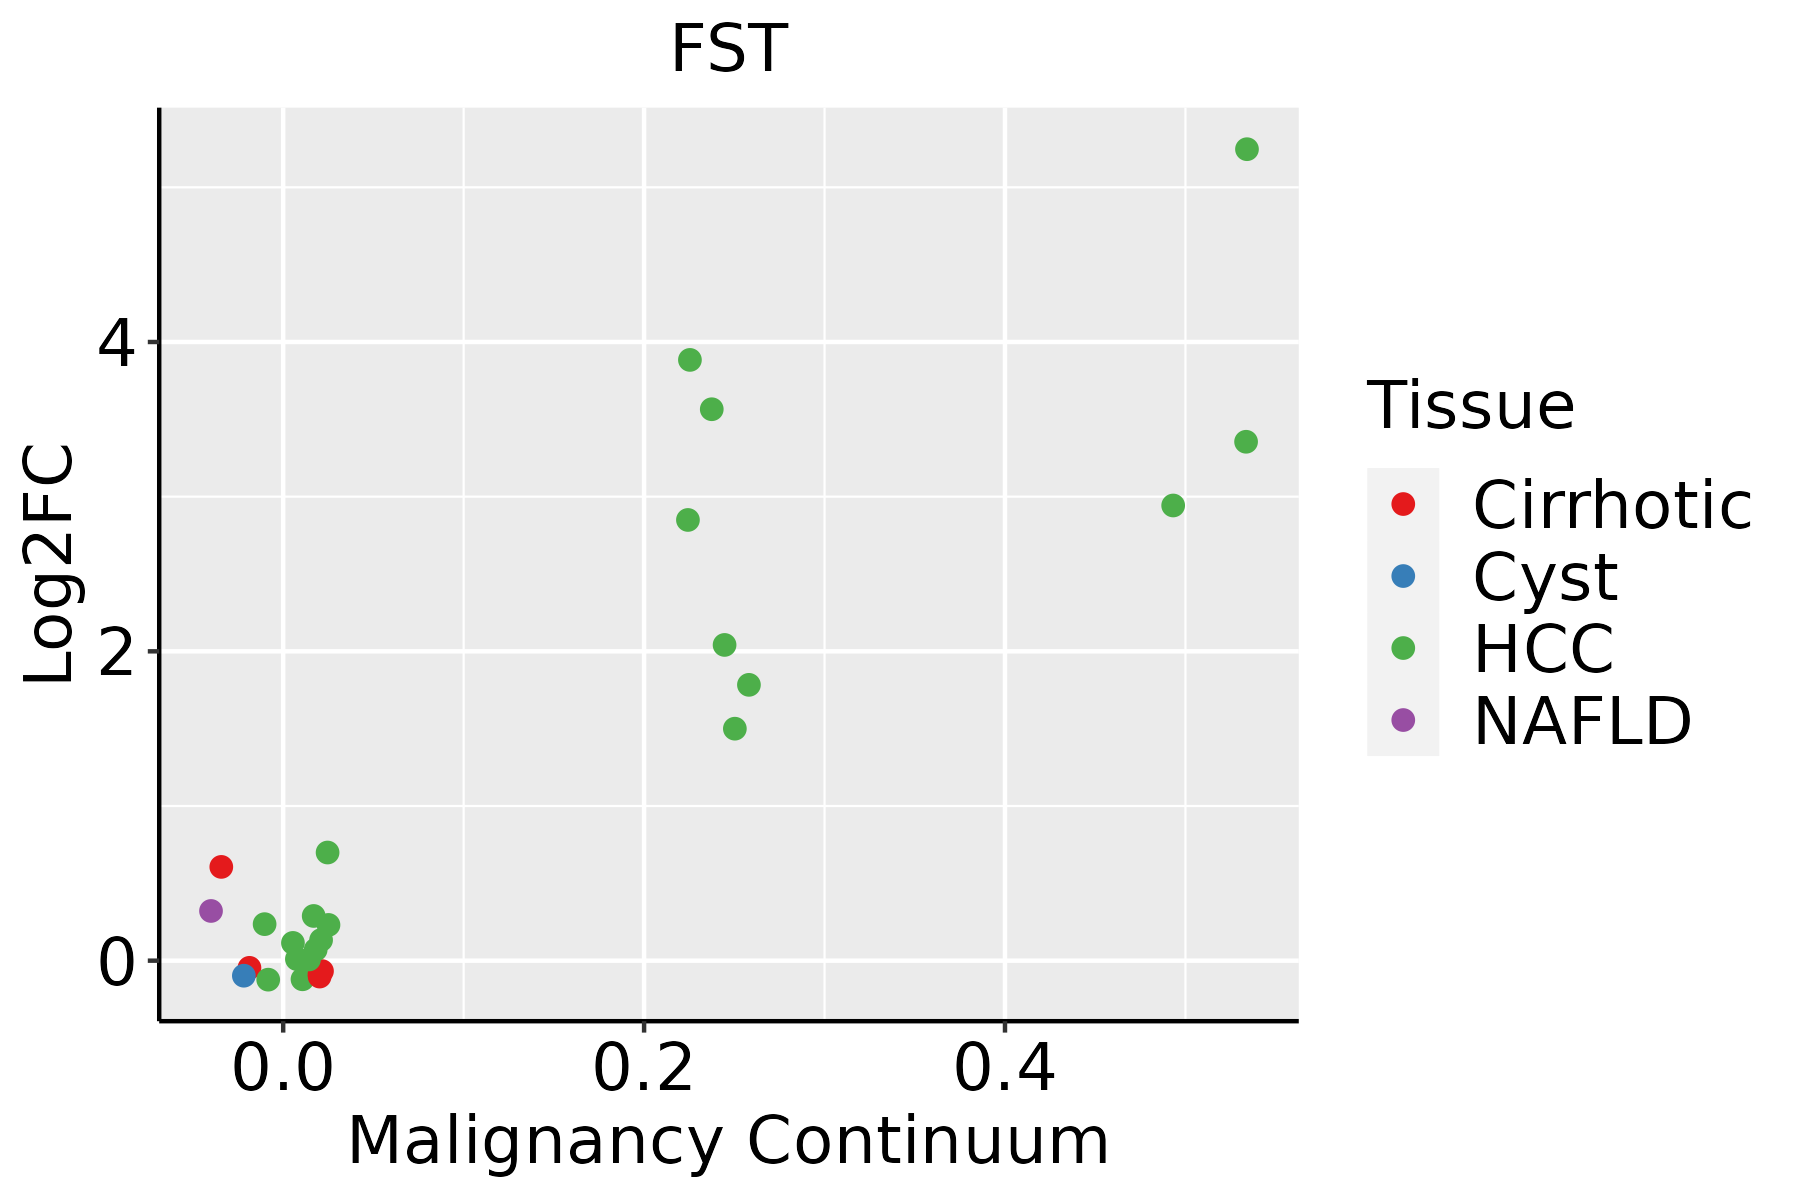 | HCC: Hepatocellular carcinoma |
| NAFLD: Non-alcoholic fatty liver disease | ||
| Oral Cavity | 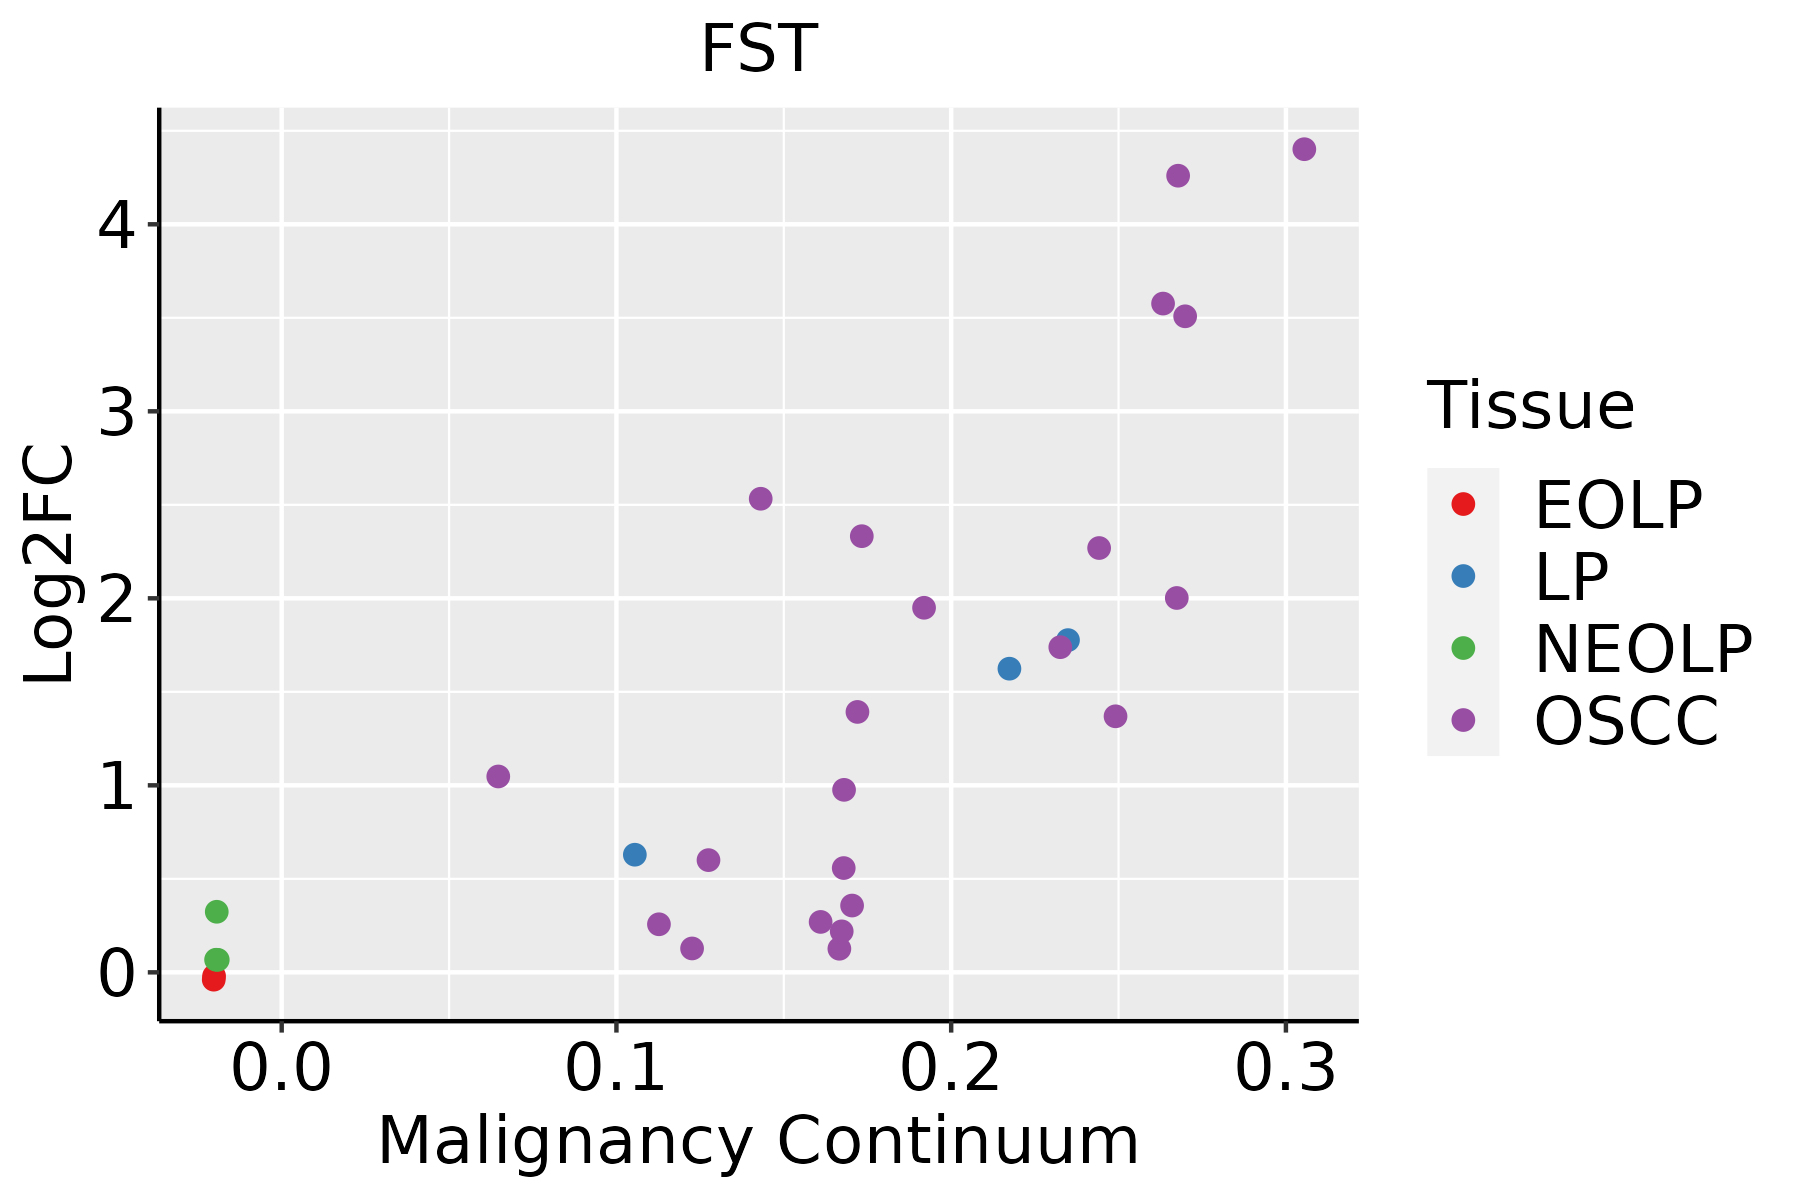 | EOLP: Erosive Oral lichen planus |
| LP: leukoplakia | ||
| NEOLP: Non-erosive oral lichen planus | ||
| OSCC: Oral squamous cell carcinoma | ||
| Skin |  | AK: Actinic keratosis |
| cSCC: Cutaneous squamous cell carcinoma | ||
| SCCIS:squamous cell carcinoma in situ |
| ∗log2FC in expression of this searched gene in stem-like cells from each diseased tissue sample relative to stem-like cells in normal samples in each tissue plotted against the malignancy continuum. Samples are colored based on if they are from different disease stage. |
Top |
Malignant transformation related pathway analysis |
| Find out the enriched GO biological processes and KEGG pathways involved in transition from healthy to precancer to cancer |
| Tissue | Disease Stage | Enriched GO biological Processes |
| Colorectum | AD |  |
| Colorectum | SER |  |
| Colorectum | MSS |  |
| Colorectum | MSI-H |  |
| Colorectum | FAP |  |
| ∗Top 15 enriched GO BP terms are showed in the bar plot of each disease state in each tissue. Each row represents a significant GO biological process which is colored according to the -log10(p.adjust). |
| Page: 1 2 3 4 5 6 7 8 9 |
| GO ID | Tissue | Disease Stage | Description | Gene Ratio | Bg Ratio | pvalue | p.adjust | Count |
| GO:19037067 | Liver | Cyst | regulation of hemopoiesis | 20/496 | 367/18723 | 1.97e-03 | 4.15e-02 | 20 |
| GO:00224077 | Liver | Cyst | regulation of cell-cell adhesion | 23/496 | 448/18723 | 2.04e-03 | 4.25e-02 | 23 |
| GO:003009920 | Oral cavity | OSCC | myeloid cell differentiation | 213/7305 | 381/18723 | 1.24e-11 | 4.42e-10 | 213 |
| GO:004887220 | Oral cavity | OSCC | homeostasis of number of cells | 152/7305 | 272/18723 | 1.08e-08 | 2.23e-07 | 152 |
| GO:004873220 | Oral cavity | OSCC | gland development | 226/7305 | 436/18723 | 2.78e-08 | 5.39e-07 | 226 |
| GO:004578520 | Oral cavity | OSCC | positive regulation of cell adhesion | 225/7305 | 437/18723 | 6.06e-08 | 1.09e-06 | 225 |
| GO:000257310 | Oral cavity | OSCC | myeloid leukocyte differentiation | 119/7305 | 208/18723 | 7.29e-08 | 1.29e-06 | 119 |
| GO:00435887 | Oral cavity | OSCC | skin development | 143/7305 | 263/18723 | 2.77e-07 | 4.27e-06 | 143 |
| GO:00085449 | Oral cavity | OSCC | epidermis development | 171/7305 | 324/18723 | 2.89e-07 | 4.43e-06 | 171 |
| GO:006145817 | Oral cavity | OSCC | reproductive system development | 217/7305 | 427/18723 | 3.75e-07 | 5.63e-06 | 217 |
| GO:004860816 | Oral cavity | OSCC | reproductive structure development | 214/7305 | 424/18723 | 8.58e-07 | 1.18e-05 | 214 |
| GO:001003820 | Oral cavity | OSCC | response to metal ion | 188/7305 | 373/18723 | 4.34e-06 | 5.00e-05 | 188 |
| GO:000150310 | Oral cavity | OSCC | ossification | 203/7305 | 408/18723 | 5.54e-06 | 6.19e-05 | 203 |
| GO:002240718 | Oral cavity | OSCC | regulation of cell-cell adhesion | 218/7305 | 448/18723 | 1.71e-05 | 1.68e-04 | 218 |
| GO:005067310 | Oral cavity | OSCC | epithelial cell proliferation | 212/7305 | 437/18723 | 2.82e-05 | 2.61e-04 | 212 |
| GO:000166719 | Oral cavity | OSCC | ameboidal-type cell migration | 228/7305 | 475/18723 | 3.46e-05 | 3.10e-04 | 228 |
| GO:190370618 | Oral cavity | OSCC | regulation of hemopoiesis | 180/7305 | 367/18723 | 5.16e-05 | 4.30e-04 | 180 |
| GO:001063118 | Oral cavity | OSCC | epithelial cell migration | 174/7305 | 357/18723 | 1.04e-04 | 7.70e-04 | 174 |
| GO:009013218 | Oral cavity | OSCC | epithelium migration | 175/7305 | 360/18723 | 1.18e-04 | 8.54e-04 | 175 |
| GO:00303238 | Oral cavity | OSCC | respiratory tube development | 95/7305 | 181/18723 | 1.53e-04 | 1.07e-03 | 95 |
| Page: 1 2 3 4 5 6 7 8 9 10 11 12 13 14 15 16 17 |
| Pathway ID | Tissue | Disease Stage | Description | Gene Ratio | Bg Ratio | pvalue | p.adjust | qvalue | Count |
| hsa043507 | Esophagus | ESCC | TGF-beta signaling pathway | 69/4205 | 108/8465 | 1.92e-03 | 5.54e-03 | 2.84e-03 | 69 |
| hsa0435014 | Esophagus | ESCC | TGF-beta signaling pathway | 69/4205 | 108/8465 | 1.92e-03 | 5.54e-03 | 2.84e-03 | 69 |
| hsa043506 | Oral cavity | OSCC | TGF-beta signaling pathway | 60/3704 | 108/8465 | 8.66e-03 | 1.97e-02 | 1.00e-02 | 60 |
| hsa0435013 | Oral cavity | OSCC | TGF-beta signaling pathway | 60/3704 | 108/8465 | 8.66e-03 | 1.97e-02 | 1.00e-02 | 60 |
| hsa0435041 | Oral cavity | NEOLP | TGF-beta signaling pathway | 28/1112 | 108/8465 | 2.46e-04 | 1.62e-03 | 1.02e-03 | 28 |
| hsa0435051 | Oral cavity | NEOLP | TGF-beta signaling pathway | 28/1112 | 108/8465 | 2.46e-04 | 1.62e-03 | 1.02e-03 | 28 |
| Page: 1 |
Top |
Cell-cell communication analysis |
| Identification of potential cell-cell interactions between two cell types and their ligand-receptor pairs for different disease states |
| Ligand | Receptor | LRpair | Pathway | Tissue | Disease Stage |
| Page: 1 |
Top |
Single-cell gene regulatory network inference analysis |
| Find out the significant the regulons (TFs) and the target genes of each regulon across cell types for different disease states |
| TF | Cell Type | Tissue | Disease Stage | Target Gene | RSS | Regulon Activity |
| ∗The dot plots of a searched regulon are shown for all cell subpopulations in each disease state of each tissue based on the regulon specific score inferred using pySCENIC and by calculating the average expression. |
| Page: 1 |
Top |
Somatic mutation of malignant transformation related genes |
| Annotation of somatic variants for genes involved in malignant transformation |
| Hugo Symbol | Variant Class | Variant Classification | dbSNP RS | HGVSc | HGVSp | HGVSp Short | SWISSPROT | BIOTYPE | SIFT | PolyPhen | Tumor Sample Barcode | Tissue | Histology | Sex | Age | Stage | Therapy Types | Drugs | Outcome |
| FST | SNV | Missense_Mutation | c.495A>C | p.Lys165Asn | p.K165N | P19883 | protein_coding | deleterious(0) | possibly_damaging(0.845) | TCGA-AR-A24Q-01 | Breast | breast invasive carcinoma | Female | <65 | I/II | Chemotherapy | doxorubicin | SD | |
| FST | SNV | Missense_Mutation | rs370731523 | c.940N>A | p.Gly314Arg | p.G314R | P19883 | protein_coding | deleterious(0) | probably_damaging(1) | TCGA-LD-A7W5-01 | Breast | breast invasive carcinoma | Female | <65 | III/IV | Chemotherapy | taxotere | SD |
| FST | insertion | Frame_Shift_Ins | novel | c.922_923insT | p.Glu309GlyfsTer22 | p.E309Gfs*22 | P19883 | protein_coding | TCGA-E2-A1IO-01 | Breast | breast invasive carcinoma | Female | <65 | I/II | Chemotherapy | docetaxel | SD | ||
| FST | SNV | Missense_Mutation | rs202174134 | c.836N>T | p.Ser279Leu | p.S279L | P19883 | protein_coding | deleterious(0.05) | benign(0.178) | TCGA-UC-A7PG-06 | Cervix | cervical & endocervical cancer | Female | <65 | III/IV | Chemotherapy | cisplatin | PD |
| FST | SNV | Missense_Mutation | novel | c.898G>T | p.Ala300Ser | p.A300S | P19883 | protein_coding | tolerated(0.56) | possibly_damaging(0.732) | TCGA-VS-A8EJ-01 | Cervix | cervical & endocervical cancer | Female | <65 | I/II | Chemotherapy | cisplatin | PD |
| FST | SNV | Missense_Mutation | c.695N>A | p.Gly232Glu | p.G232E | P19883 | protein_coding | deleterious(0.04) | probably_damaging(1) | TCGA-AA-A00N-01 | Colorectum | colon adenocarcinoma | Male | >=65 | I/II | Unknown | Unknown | PD | |
| FST | SNV | Missense_Mutation | c.498N>T | p.Lys166Asn | p.K166N | P19883 | protein_coding | deleterious(0) | benign(0.092) | TCGA-AZ-4315-01 | Colorectum | colon adenocarcinoma | Male | <65 | I/II | Unknown | Unknown | SD | |
| FST | SNV | Missense_Mutation | rs371840444 | c.959C>T | p.Ser320Leu | p.S320L | P19883 | protein_coding | tolerated(0.07) | benign(0.003) | TCGA-CA-6718-01 | Colorectum | colon adenocarcinoma | Male | <65 | I/II | Unknown | Unknown | PD |
| FST | SNV | Missense_Mutation | novel | c.446G>T | p.Arg149Ile | p.R149I | P19883 | protein_coding | deleterious(0) | possibly_damaging(0.568) | TCGA-AG-A002-01 | Colorectum | rectum adenocarcinoma | Male | <65 | I/II | Unknown | Unknown | SD |
| FST | SNV | Missense_Mutation | rs150238035 | c.52N>T | p.Leu18Phe | p.L18F | P19883 | protein_coding | tolerated(0.21) | benign(0.001) | TCGA-F5-6814-01 | Colorectum | rectum adenocarcinoma | Male | <65 | I/II | Unknown | Unknown | SD |
| Page: 1 2 3 4 5 |
Top |
Related drugs of malignant transformation related genes |
| Identification of chemicals and drugs interact with genes involved in malignant transfromation |
| (DGIdb 4.0) |
| Entrez ID | Symbol | Category | Interaction Types | Drug Claim Name | Drug Name | PMIDs |
| 10468 | FST | DRUGGABLE GENOME | ANTI-ANDROGEN | 14761877 | ||
| 10468 | FST | DRUGGABLE GENOME | TUMOR NECROSIS FACTOR | 17436000 | ||
| 10468 | FST | DRUGGABLE GENOME | KINASE INHIBITOR | 16854407 | ||
| 10468 | FST | DRUGGABLE GENOME | INDOMETHACIN | INDOMETHACIN | 15941869 | |
| 10468 | FST | DRUGGABLE GENOME | FREUNDS ADJUVANT | 10734405 | ||
| 10468 | FST | DRUGGABLE GENOME | INHIBINS | 10864854 | ||
| 10468 | FST | DRUGGABLE GENOME | ALPHA-ADRENERGIC AGONIST | 9427529 | ||
| 10468 | FST | DRUGGABLE GENOME | NERVE GROWTH FACTOR | 9770356 | ||
| 10468 | FST | DRUGGABLE GENOME | BICALUTAMIDE | BICALUTAMIDE | 14761877 | |
| 10468 | FST | DRUGGABLE GENOME | ANDROGENS | 14512439 |
| Page: 1 2 |

Copyright 2023-Present -The University of Texas Health Science Center at Houston |