| Tissue | Expression Dynamics | Abbreviation |
| Colorectum (GSE201348) |  | FAP: Familial adenomatous polyposis |
| CRC: Colorectal cancer |
| Colorectum (HTA11) |  | AD: Adenomas |
| SER: Sessile serrated lesions |
| MSI-H: Microsatellite-high colorectal cancer |
| MSS: Microsatellite stable colorectal cancer |
| Esophagus | 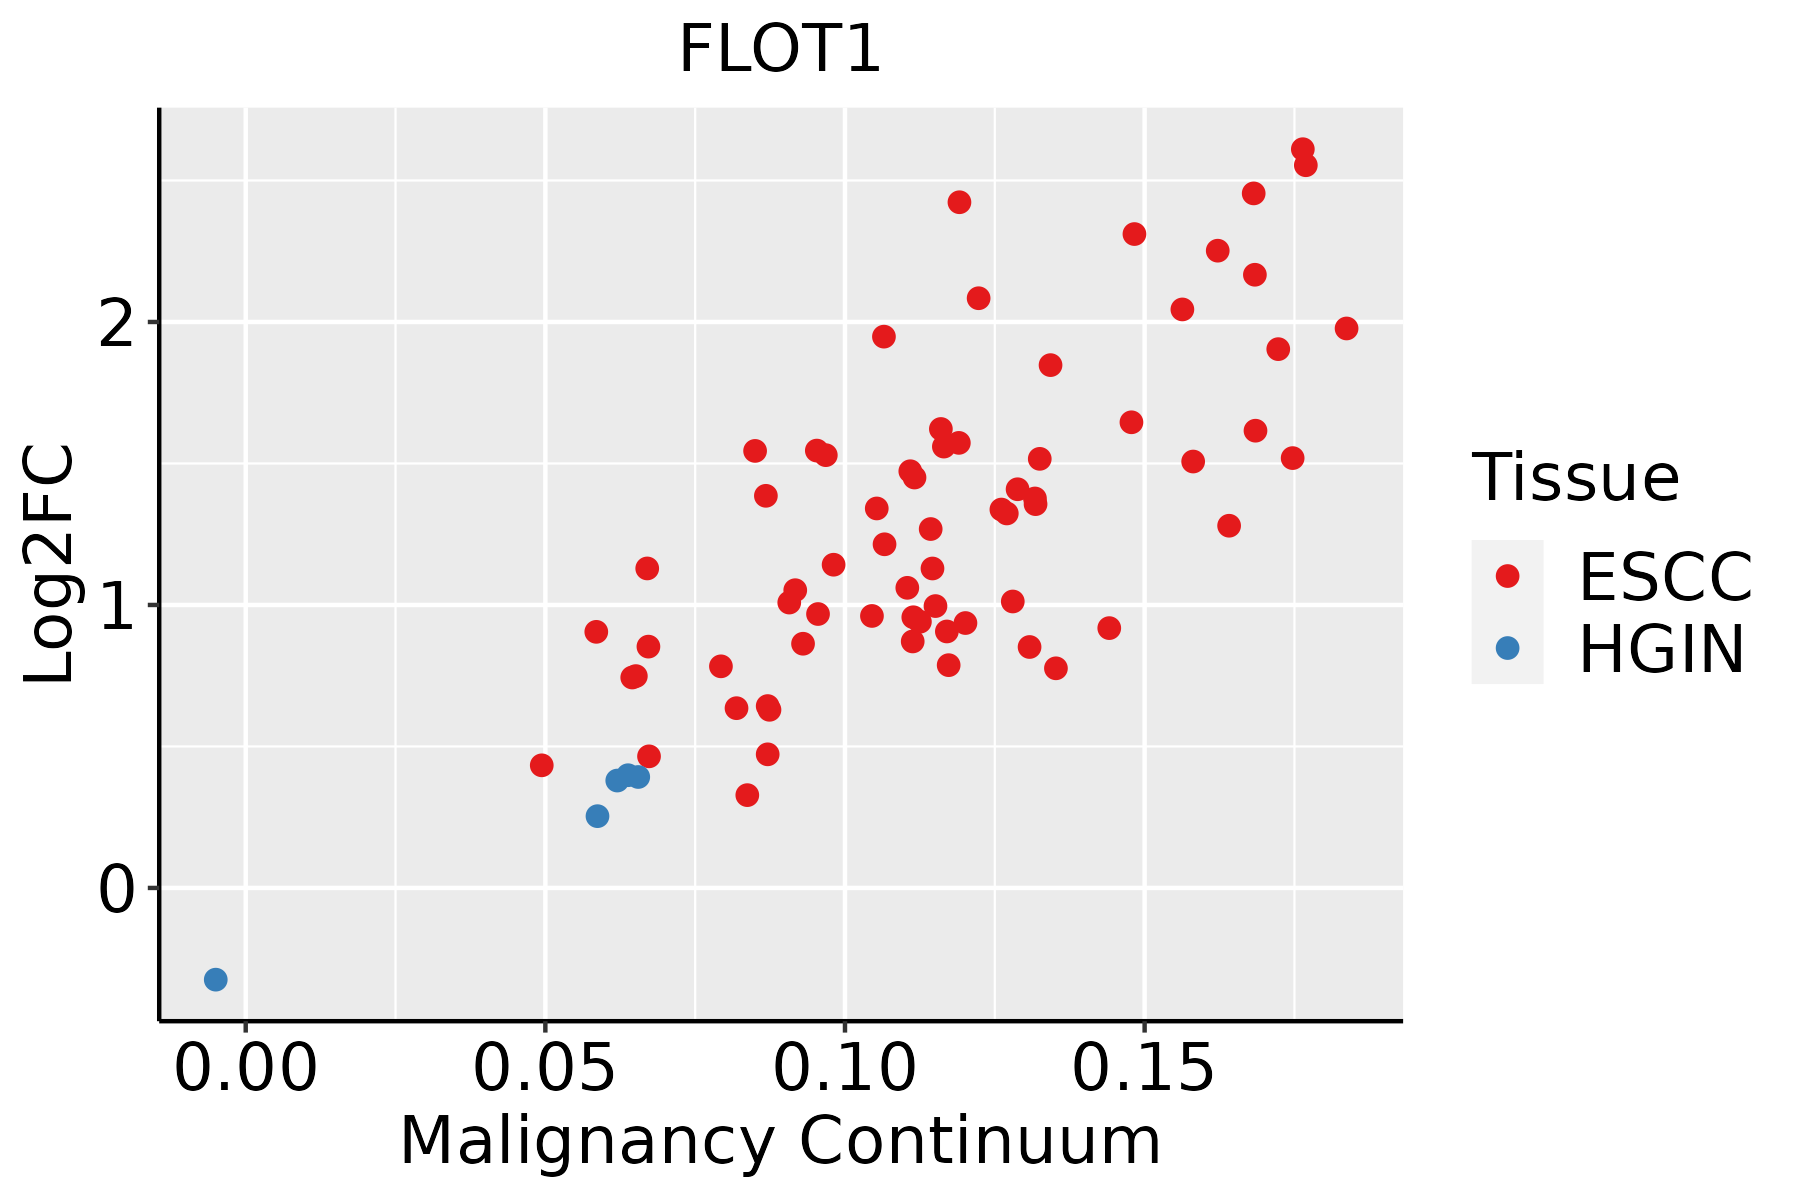 | ESCC: Esophageal squamous cell carcinoma |
| HGIN: High-grade intraepithelial neoplasias |
| LGIN: Low-grade intraepithelial neoplasias |
| Liver |  | HCC: Hepatocellular carcinoma |
| NAFLD: Non-alcoholic fatty liver disease |
| Oral Cavity |  | EOLP: Erosive Oral lichen planus |
| LP: leukoplakia |
| NEOLP: Non-erosive oral lichen planus |
| OSCC: Oral squamous cell carcinoma |
| Prostate | 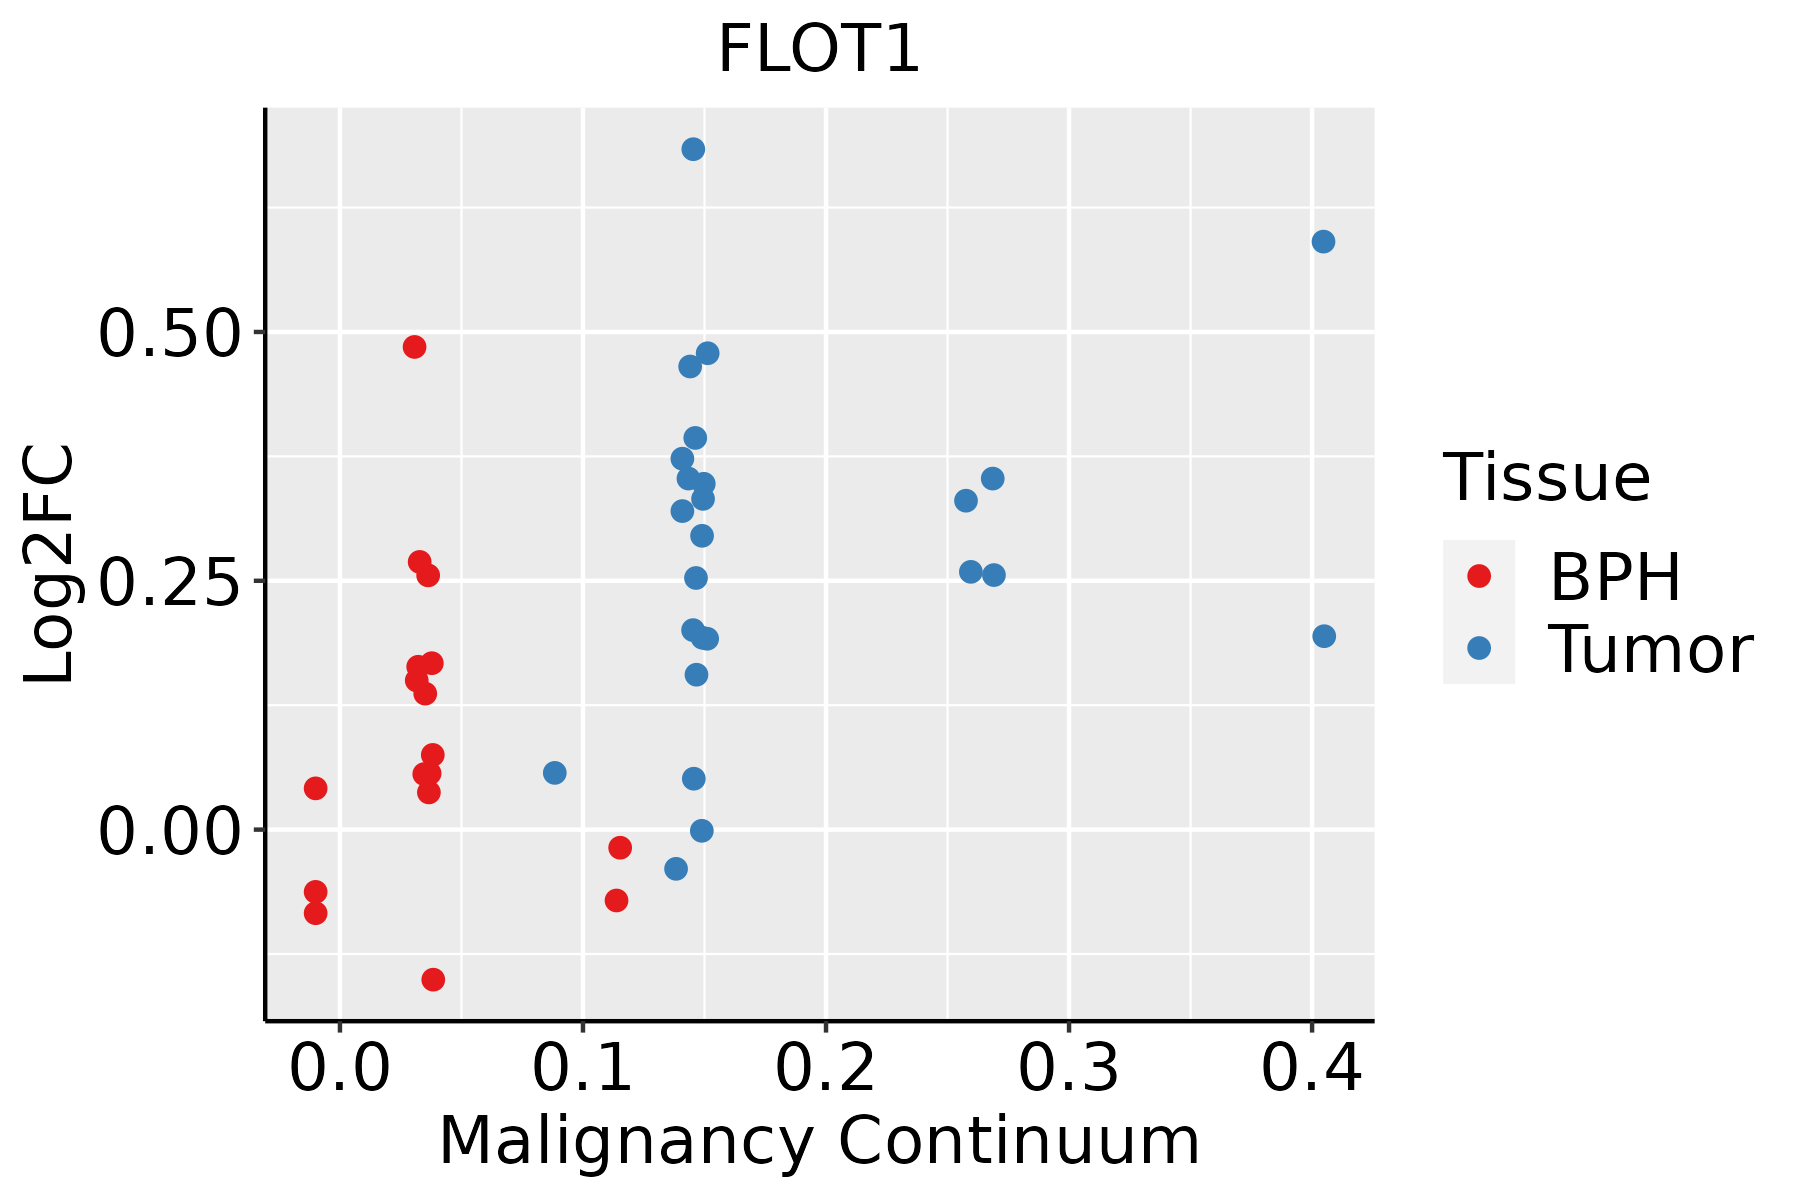 | BPH: Benign Prostatic Hyperplasia |
| Skin | 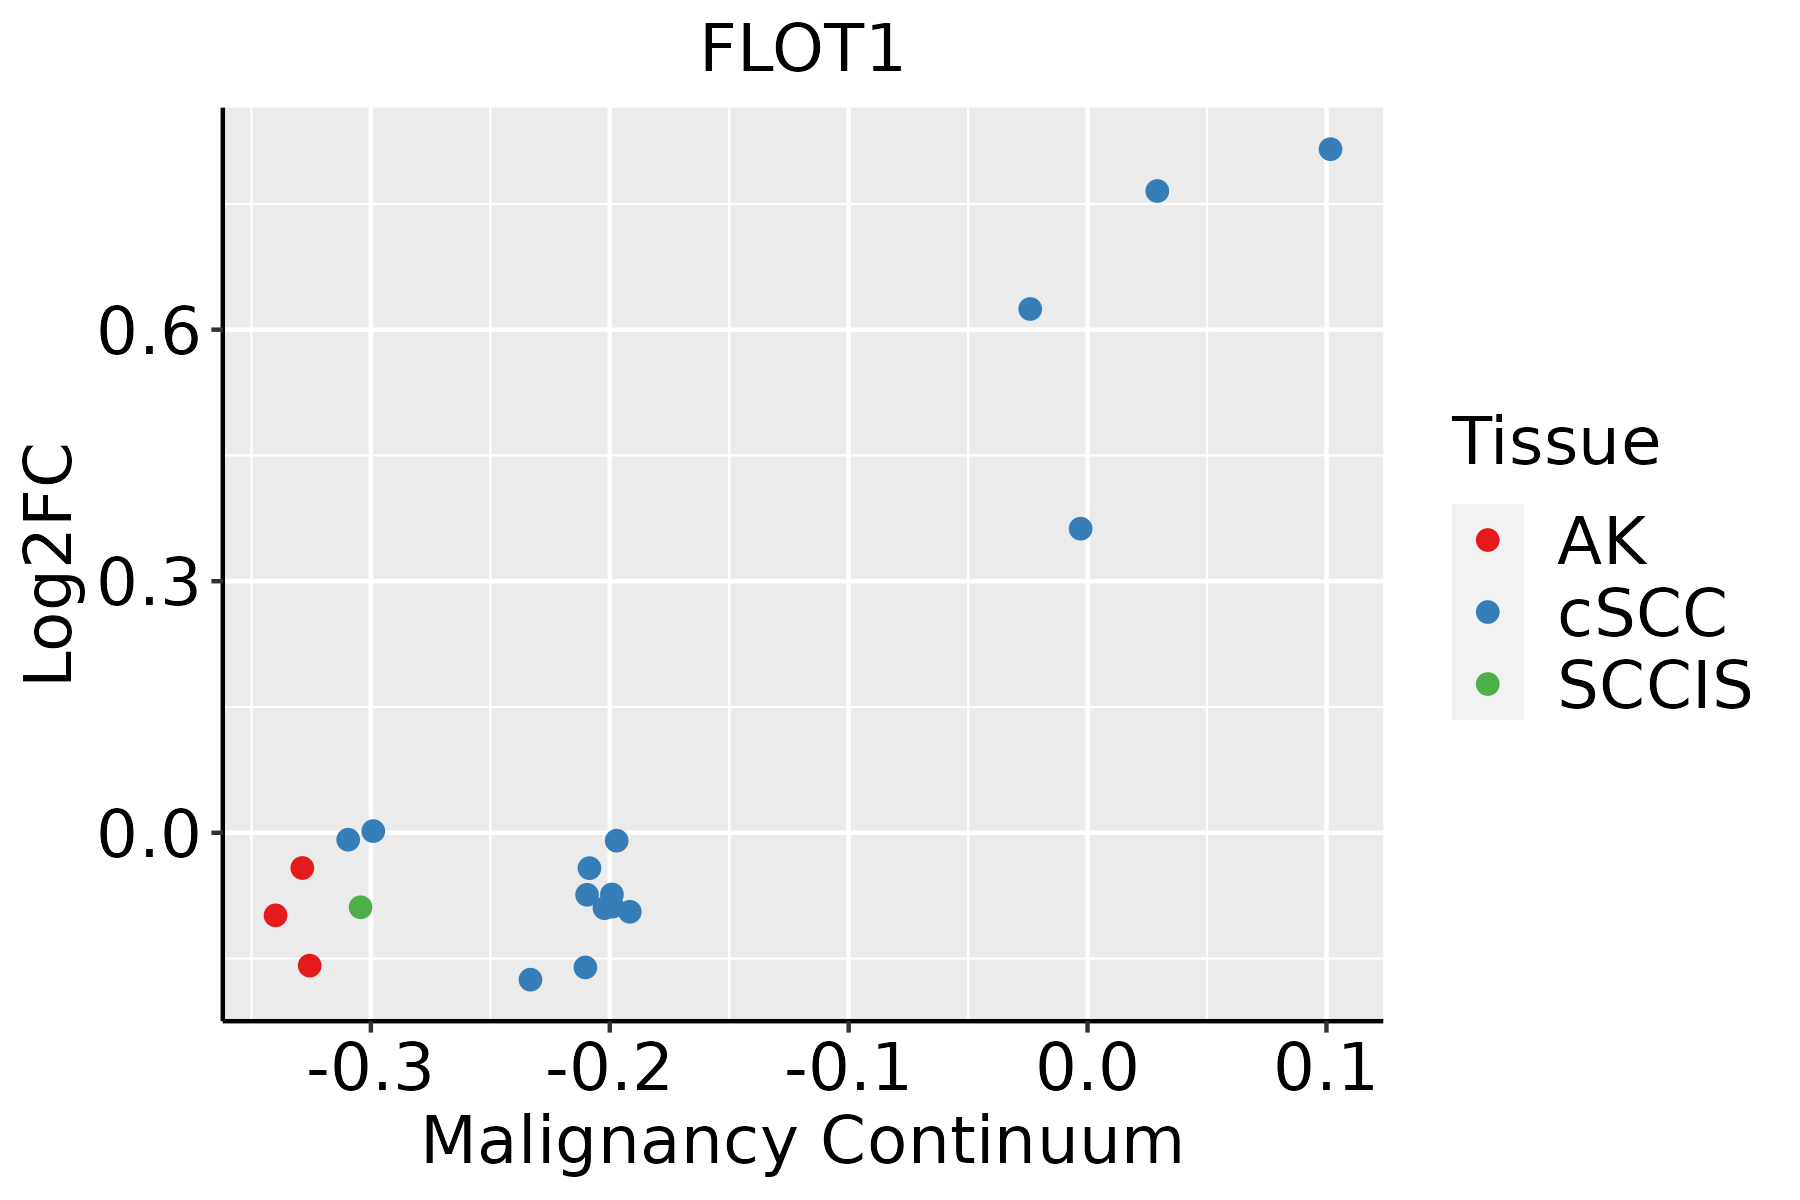 | AK: Actinic keratosis |
| cSCC: Cutaneous squamous cell carcinoma |
| SCCIS:squamous cell carcinoma in situ |
| Thyroid | 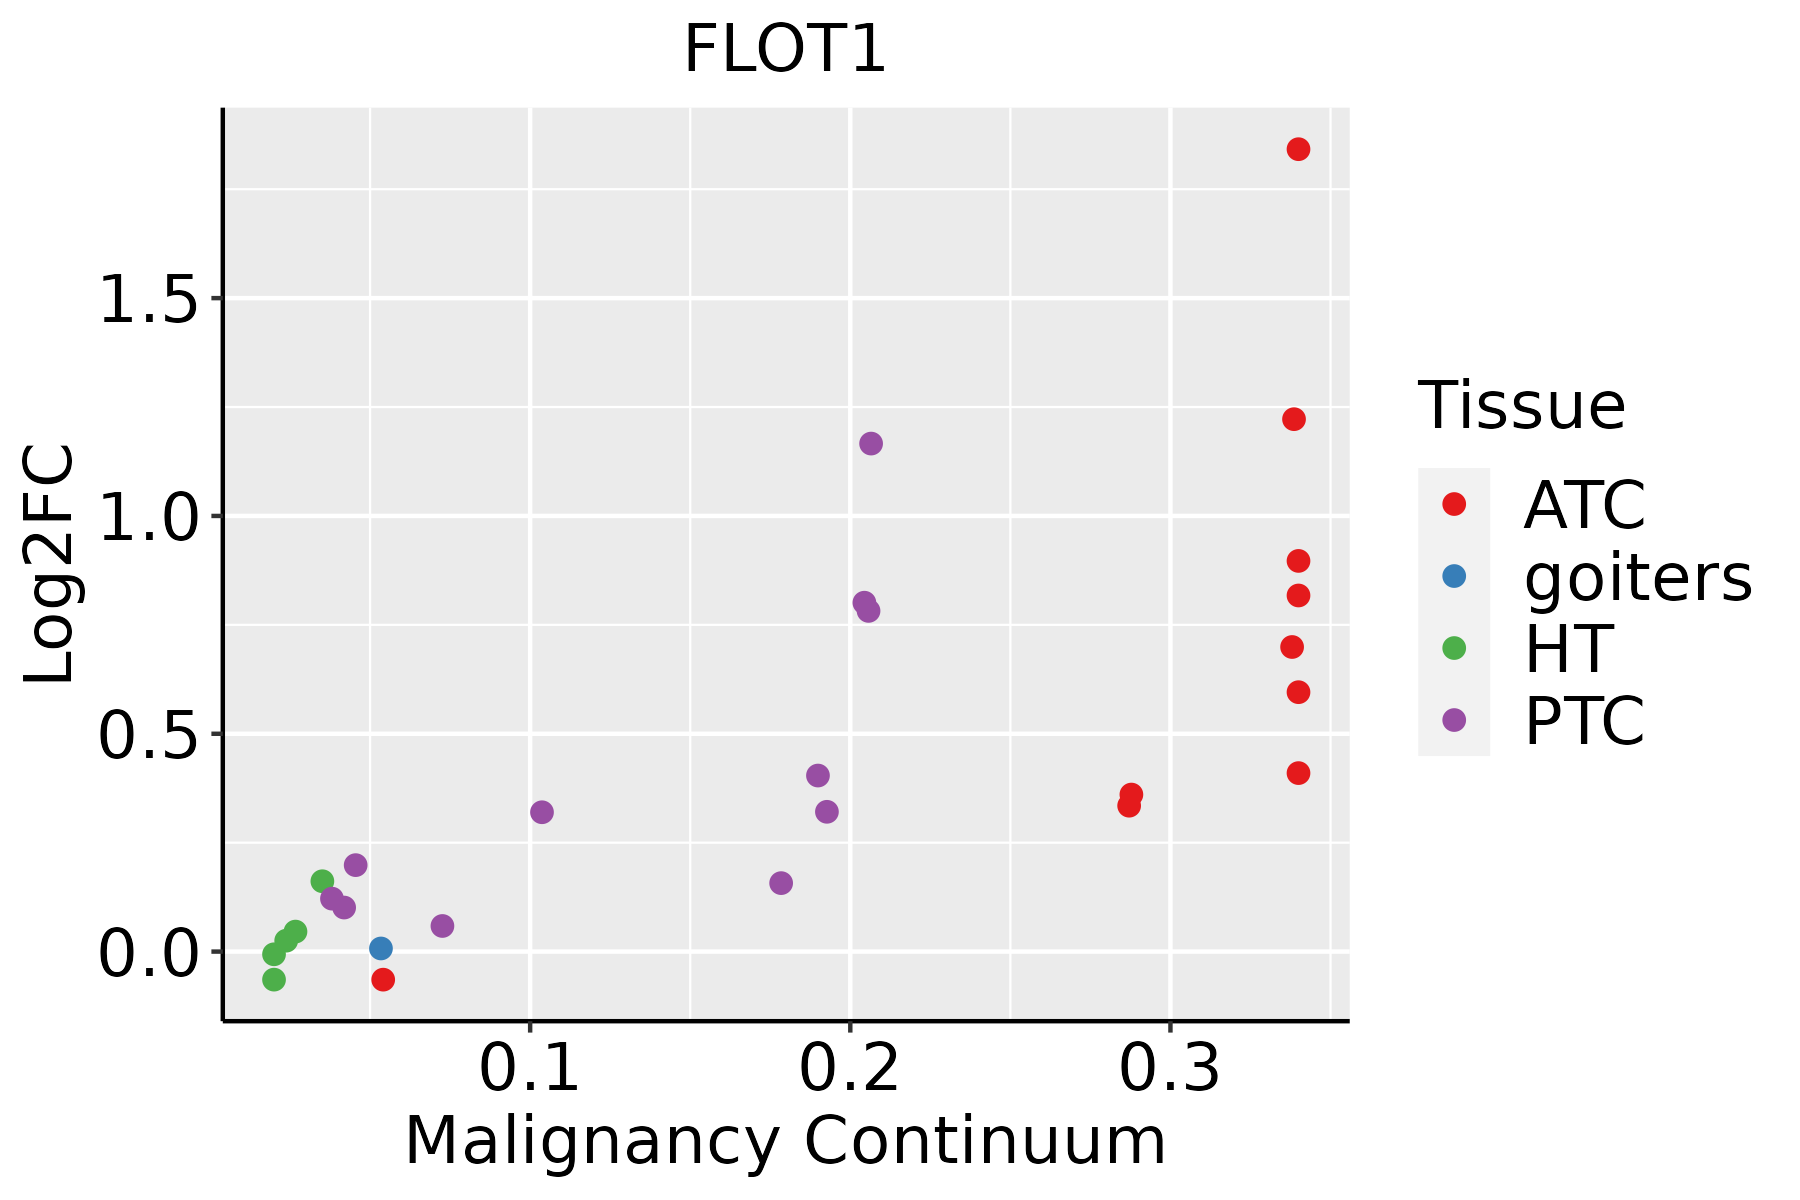 | ATC: Anaplastic thyroid cancer |
| HT: Hashimoto's thyroiditis |
| PTC: Papillary thyroid cancer |
| GO ID | Tissue | Disease Stage | Description | Gene Ratio | Bg Ratio | pvalue | p.adjust | Count |
| GO:00508214 | Colorectum | FAP | protein stabilization | 51/2622 | 191/18723 | 2.63e-06 | 9.96e-05 | 51 |
| GO:00431122 | Colorectum | FAP | receptor metabolic process | 46/2622 | 166/18723 | 2.70e-06 | 1.02e-04 | 46 |
| GO:00224114 | Colorectum | FAP | cellular component disassembly | 97/2622 | 443/18723 | 3.44e-06 | 1.23e-04 | 97 |
| GO:00316474 | Colorectum | FAP | regulation of protein stability | 70/2622 | 298/18723 | 6.60e-06 | 2.04e-04 | 70 |
| GO:00458072 | Colorectum | FAP | positive regulation of endocytosis | 31/2622 | 100/18723 | 9.77e-06 | 2.85e-04 | 31 |
| GO:00510984 | Colorectum | FAP | regulation of binding | 81/2622 | 363/18723 | 1.04e-05 | 2.97e-04 | 81 |
| GO:00349764 | Colorectum | FAP | response to endoplasmic reticulum stress | 61/2622 | 256/18723 | 1.58e-05 | 4.10e-04 | 61 |
| GO:00301003 | Colorectum | FAP | regulation of endocytosis | 52/2622 | 211/18723 | 2.47e-05 | 5.77e-04 | 52 |
| GO:00457854 | Colorectum | FAP | positive regulation of cell adhesion | 92/2622 | 437/18723 | 3.09e-05 | 7.04e-04 | 92 |
| GO:00510994 | Colorectum | FAP | positive regulation of binding | 44/2622 | 173/18723 | 4.52e-05 | 9.40e-04 | 44 |
| GO:00465781 | Colorectum | FAP | regulation of Ras protein signal transduction | 47/2622 | 189/18723 | 4.67e-05 | 9.60e-04 | 47 |
| GO:00320923 | Colorectum | FAP | positive regulation of protein binding | 25/2622 | 85/18723 | 1.76e-04 | 2.62e-03 | 25 |
| GO:00482592 | Colorectum | FAP | regulation of receptor-mediated endocytosis | 30/2622 | 110/18723 | 1.89e-04 | 2.76e-03 | 30 |
| GO:00064034 | Colorectum | FAP | RNA localization | 47/2622 | 201/18723 | 2.27e-04 | 3.22e-03 | 47 |
| GO:00433934 | Colorectum | FAP | regulation of protein binding | 46/2622 | 196/18723 | 2.40e-04 | 3.35e-03 | 46 |
| GO:00717093 | Colorectum | FAP | membrane assembly | 17/2622 | 50/18723 | 2.86e-04 | 3.77e-03 | 17 |
| GO:19018882 | Colorectum | FAP | regulation of cell junction assembly | 47/2622 | 204/18723 | 3.25e-04 | 4.16e-03 | 47 |
| GO:00072661 | Colorectum | FAP | Rho protein signal transduction | 34/2622 | 137/18723 | 5.11e-04 | 5.82e-03 | 34 |
| GO:00512364 | Colorectum | FAP | establishment of RNA localization | 39/2622 | 166/18723 | 6.71e-04 | 7.28e-03 | 39 |
| GO:00506574 | Colorectum | FAP | nucleic acid transport | 38/2622 | 163/18723 | 9.12e-04 | 9.19e-03 | 38 |
| Pathway ID | Tissue | Disease Stage | Description | Gene Ratio | Bg Ratio | pvalue | p.adjust | qvalue | Count |
| hsa04910 | Colorectum | MSS | Insulin signaling pathway | 43/1875 | 137/8465 | 7.37e-03 | 2.84e-02 | 1.74e-02 | 43 |
| hsa049101 | Colorectum | MSS | Insulin signaling pathway | 43/1875 | 137/8465 | 7.37e-03 | 2.84e-02 | 1.74e-02 | 43 |
| hsa049102 | Colorectum | FAP | Insulin signaling pathway | 36/1404 | 137/8465 | 2.51e-03 | 1.18e-02 | 7.18e-03 | 36 |
| hsa049103 | Colorectum | FAP | Insulin signaling pathway | 36/1404 | 137/8465 | 2.51e-03 | 1.18e-02 | 7.18e-03 | 36 |
| hsa049109 | Esophagus | ESCC | Insulin signaling pathway | 89/4205 | 137/8465 | 1.97e-04 | 7.32e-04 | 3.75e-04 | 89 |
| hsa0491014 | Esophagus | ESCC | Insulin signaling pathway | 89/4205 | 137/8465 | 1.97e-04 | 7.32e-04 | 3.75e-04 | 89 |
| hsa0491021 | Liver | Cirrhotic | Insulin signaling pathway | 56/2530 | 137/8465 | 3.74e-03 | 1.50e-02 | 9.26e-03 | 56 |
| hsa0491031 | Liver | Cirrhotic | Insulin signaling pathway | 56/2530 | 137/8465 | 3.74e-03 | 1.50e-02 | 9.26e-03 | 56 |
| hsa0491041 | Liver | HCC | Insulin signaling pathway | 95/4020 | 137/8465 | 1.53e-07 | 1.97e-06 | 1.10e-06 | 95 |
| hsa0491051 | Liver | HCC | Insulin signaling pathway | 95/4020 | 137/8465 | 1.53e-07 | 1.97e-06 | 1.10e-06 | 95 |
| hsa049108 | Oral cavity | OSCC | Insulin signaling pathway | 83/3704 | 137/8465 | 4.83e-05 | 2.00e-04 | 1.02e-04 | 83 |
| hsa0491013 | Oral cavity | OSCC | Insulin signaling pathway | 83/3704 | 137/8465 | 4.83e-05 | 2.00e-04 | 1.02e-04 | 83 |
| hsa0491023 | Oral cavity | EOLP | Insulin signaling pathway | 33/1218 | 137/8465 | 1.61e-03 | 5.60e-03 | 3.30e-03 | 33 |
| hsa0491033 | Oral cavity | EOLP | Insulin signaling pathway | 33/1218 | 137/8465 | 1.61e-03 | 5.60e-03 | 3.30e-03 | 33 |
| hsa049107 | Prostate | BPH | Insulin signaling pathway | 43/1718 | 137/8465 | 1.34e-03 | 5.81e-03 | 3.60e-03 | 43 |
| hsa0491012 | Prostate | BPH | Insulin signaling pathway | 43/1718 | 137/8465 | 1.34e-03 | 5.81e-03 | 3.60e-03 | 43 |
| hsa0491022 | Prostate | Tumor | Insulin signaling pathway | 44/1791 | 137/8465 | 1.69e-03 | 7.10e-03 | 4.40e-03 | 44 |
| hsa0491032 | Prostate | Tumor | Insulin signaling pathway | 44/1791 | 137/8465 | 1.69e-03 | 7.10e-03 | 4.40e-03 | 44 |
| Hugo Symbol | Variant Class | Variant Classification | dbSNP RS | HGVSc | HGVSp | HGVSp Short | SWISSPROT | BIOTYPE | SIFT | PolyPhen | Tumor Sample Barcode | Tissue | Histology | Sex | Age | Stage | Therapy Types | Drugs | Outcome |
| FLOT1 | SNV | Missense_Mutation | | c.782N>A | p.Arg261Gln | p.R261Q | O75955 | protein_coding | deleterious(0) | possibly_damaging(0.87) | TCGA-A8-A08S-01 | Breast | breast invasive carcinoma | Female | >=65 | I/II | Hormone Therapy | anastrozole | SD |
| FLOT1 | insertion | Frame_Shift_Ins | novel | c.476_477insGTCAAGCACATGCAAATGTGGCATGACTTATTGGGAGCAGAAAC | p.Asp159GlufsTer61 | p.D159Efs*61 | O75955 | protein_coding | | | TCGA-A2-A0CX-01 | Breast | breast invasive carcinoma | Female | <65 | I/II | Chemotherapy | adriamycin | SD |
| FLOT1 | insertion | Nonsense_Mutation | novel | c.381_382insAATATATTTTACATAAGGTGTCTTTAAACAGAAACA | p.Phe127_Ser128insAsnIlePheTyrIleArgCysLeuTerThrGluThr | p.F127_S128insNIFYIRCL*TET | O75955 | protein_coding | | | TCGA-A8-A06O-01 | Breast | breast invasive carcinoma | Female | <65 | I/II | Hormone Therapy | letrozole | SD |
| FLOT1 | insertion | Frame_Shift_Ins | novel | c.508_509insGCTGTGCCCGTGCAAAGGAG | p.Ala170GlyfsTer42 | p.A170Gfs*42 | O75955 | protein_coding | | | TCGA-AR-A0TY-01 | Breast | breast invasive carcinoma | Female | <65 | I/II | Unspecific | Paclitaxel | PD |
| FLOT1 | SNV | Missense_Mutation | rs568759969 | c.692G>A | p.Arg231Gln | p.R231Q | O75955 | protein_coding | tolerated(0.16) | benign(0.007) | TCGA-2W-A8YY-01 | Cervix | cervical & endocervical cancer | Female | <65 | I/II | Chemotherapy | cisplatin | CR |
| FLOT1 | SNV | Missense_Mutation | novel | c.1138C>A | p.Leu380Met | p.L380M | O75955 | protein_coding | tolerated(1) | benign(0.007) | TCGA-VS-A9V0-01 | Cervix | cervical & endocervical cancer | Female | <65 | I/II | Chemotherapy | cisplatin | PD |
| FLOT1 | SNV | Missense_Mutation | | c.11N>T | p.Thr4Ile | p.T4I | O75955 | protein_coding | tolerated(0.06) | benign(0.257) | TCGA-AA-3854-01 | Colorectum | colon adenocarcinoma | Female | >=65 | I/II | Unknown | Unknown | SD |
| FLOT1 | SNV | Missense_Mutation | | c.83N>T | p.Arg28Leu | p.R28L | O75955 | protein_coding | tolerated(0.16) | probably_damaging(0.964) | TCGA-AA-3989-01 | Colorectum | colon adenocarcinoma | Male | >=65 | III/IV | Unknown | Unknown | PD |
| FLOT1 | SNV | Missense_Mutation | | c.245N>A | p.Ala82Glu | p.A82E | O75955 | protein_coding | tolerated(0.27) | possibly_damaging(0.544) | TCGA-AA-A010-01 | Colorectum | colon adenocarcinoma | Female | <65 | I/II | Chemotherapy | folinic | CR |
| FLOT1 | SNV | Missense_Mutation | rs201200201 | c.1240N>A | p.Val414Met | p.V414M | O75955 | protein_coding | deleterious(0) | probably_damaging(0.915) | TCGA-AD-6889-01 | Colorectum | colon adenocarcinoma | Male | >=65 | I/II | Chemotherapy | xeloda | PD |


