
|
|||||
|
 | |
| |
| |
| |
| |
| |
|
Gene: ETS1 |
Gene summary for ETS1 |
| Gene information | Species | Human | Gene symbol | ETS1 | Gene ID | 2113 |
| Gene name | ETS proto-oncogene 1, transcription factor | |
| Gene Alias | ETS-1 | |
| Cytomap | 11q24.3 | |
| Gene Type | protein-coding | GO ID | GO:0000003 | UniProtAcc | P14921 |
Top |
Malignant transformation analysis |
| Identification of the aberrant gene expression in precancerous and cancerous lesions by comparing the gene expression of stem-like cells in diseased tissues with normal stem cells |
| Entrez ID | Symbol | Replicates | Species | Organ | Tissue | Adj P-value | Log2FC | Malignancy |
| 2113 | ETS1 | AEH-subject1 | Human | Endometrium | AEH | 1.69e-02 | 2.64e-01 | -0.3059 |
| 2113 | ETS1 | AEH-subject4 | Human | Endometrium | AEH | 2.04e-03 | 2.46e-01 | -0.2657 |
| 2113 | ETS1 | AEH-subject5 | Human | Endometrium | AEH | 1.65e-03 | 2.50e-01 | -0.2953 |
| 2113 | ETS1 | EEC-subject3 | Human | Endometrium | EEC | 3.60e-04 | 3.49e-01 | -0.2525 |
| 2113 | ETS1 | EEC-subject4 | Human | Endometrium | EEC | 3.68e-07 | 2.80e-01 | -0.2571 |
| 2113 | ETS1 | GSM5276934 | Human | Endometrium | EEC | 2.37e-15 | 4.52e-01 | -0.0913 |
| 2113 | ETS1 | GSM5276937 | Human | Endometrium | EEC | 7.27e-37 | 7.46e-01 | -0.0897 |
| 2113 | ETS1 | GSM6177620_NYU_UCEC1_lib1_lib1 | Human | Endometrium | EEC | 3.31e-02 | 7.00e-02 | -0.1869 |
| 2113 | ETS1 | GSM6177622_NYU_UCEC3_lib1_lib1 | Human | Endometrium | EEC | 5.38e-06 | 6.79e-02 | -0.1917 |
| 2113 | ETS1 | HCC2_Meng | Human | Liver | HCC | 5.83e-06 | 2.28e-02 | 0.0107 |
| 2113 | ETS1 | HCC2 | Human | Liver | HCC | 1.58e-03 | 3.03e+00 | 0.5341 |
| 2113 | ETS1 | HCC5 | Human | Liver | HCC | 5.46e-05 | 1.62e+00 | 0.4932 |
| 2113 | ETS1 | Pt13.b | Human | Liver | HCC | 6.72e-05 | 1.16e-01 | 0.0251 |
| 2113 | ETS1 | C04 | Human | Oral cavity | OSCC | 1.93e-13 | 6.05e-01 | 0.2633 |
| 2113 | ETS1 | C21 | Human | Oral cavity | OSCC | 2.20e-14 | 5.23e-01 | 0.2678 |
| 2113 | ETS1 | C30 | Human | Oral cavity | OSCC | 1.55e-09 | 6.77e-01 | 0.3055 |
| 2113 | ETS1 | C43 | Human | Oral cavity | OSCC | 4.35e-02 | -1.39e-01 | 0.1704 |
| 2113 | ETS1 | C06 | Human | Oral cavity | OSCC | 3.87e-02 | 5.48e-01 | 0.2699 |
| 2113 | ETS1 | C07 | Human | Oral cavity | OSCC | 5.36e-03 | 4.11e-01 | 0.2491 |
| 2113 | ETS1 | EOLP-1 | Human | Oral cavity | EOLP | 3.09e-11 | 4.34e-01 | -0.0202 |
| Page: 1 2 3 |
| Tissue | Expression Dynamics | Abbreviation |
| Endometrium |  | AEH: Atypical endometrial hyperplasia |
| EEC: Endometrioid Cancer | ||
| Liver |  | HCC: Hepatocellular carcinoma |
| NAFLD: Non-alcoholic fatty liver disease | ||
| Oral Cavity | 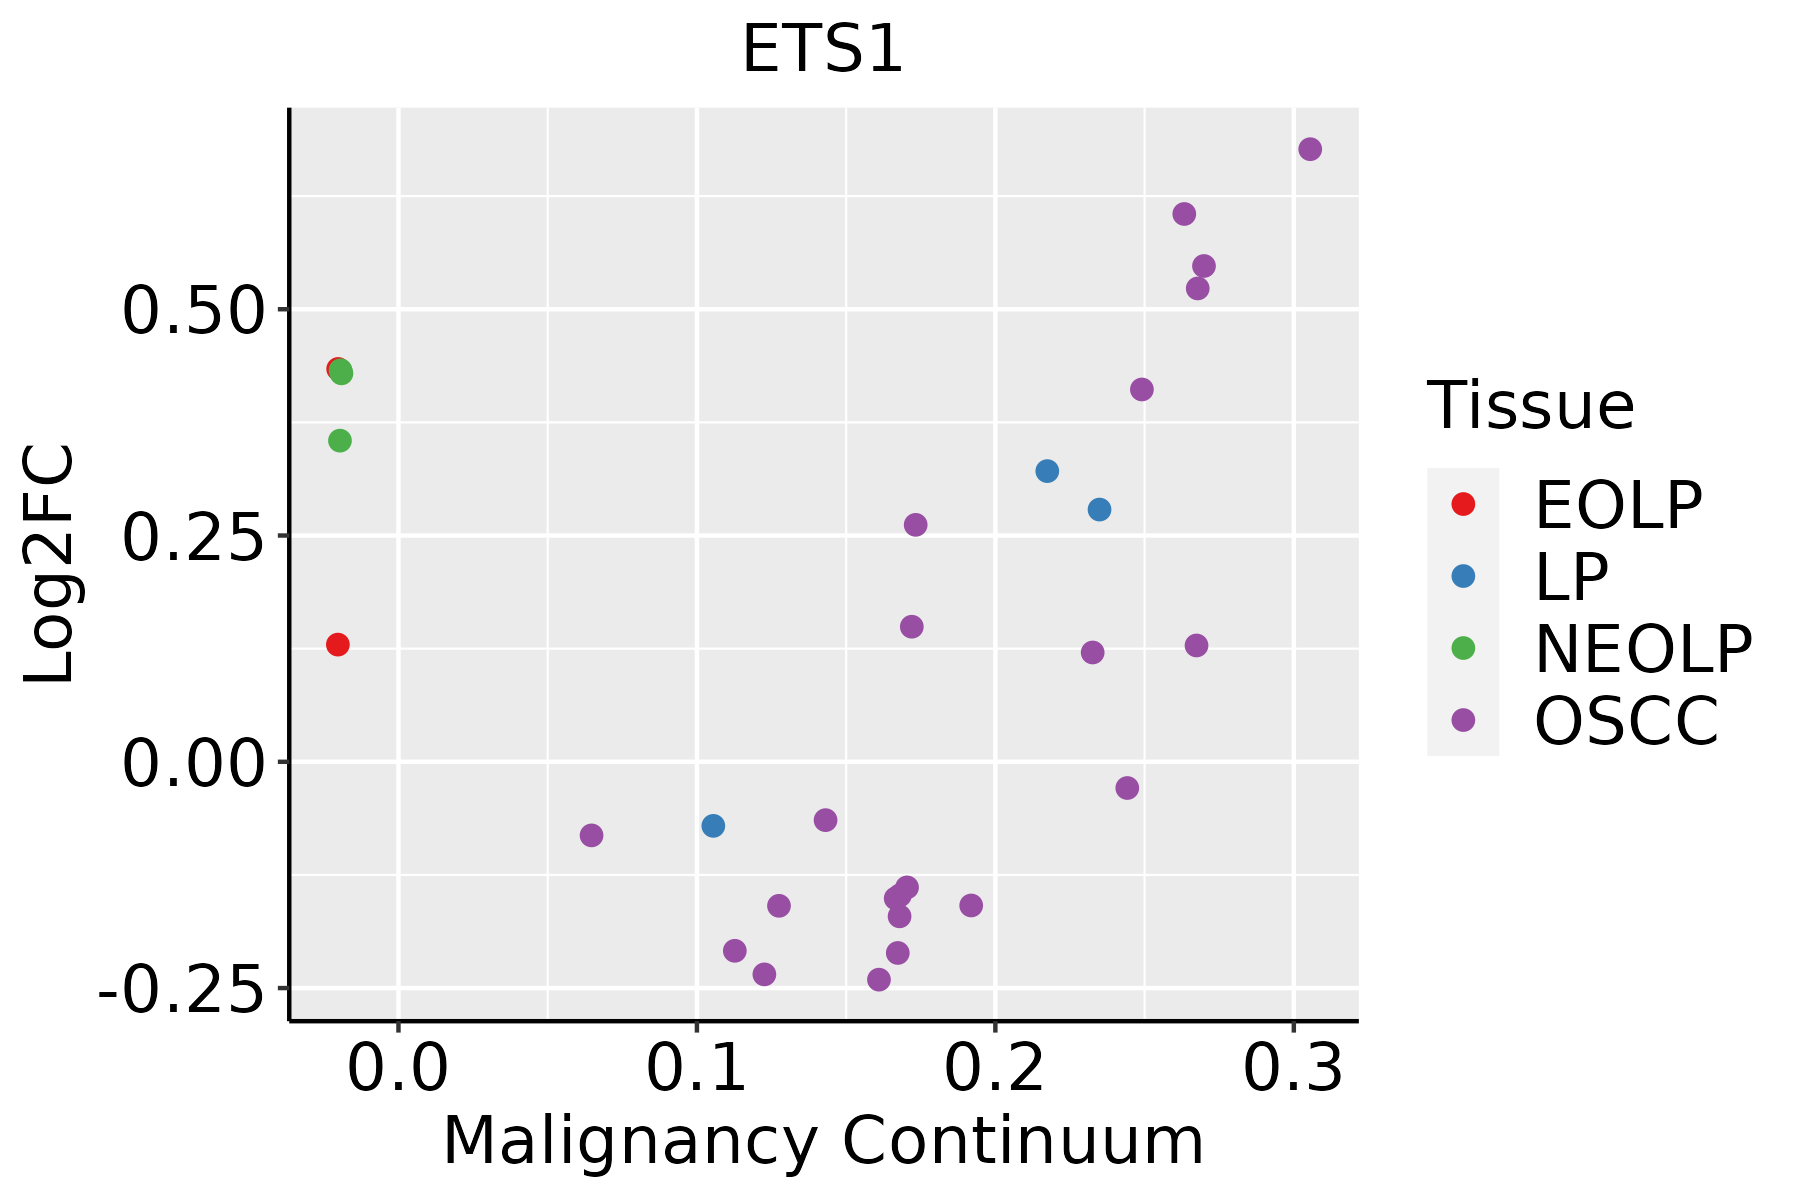 | EOLP: Erosive Oral lichen planus |
| LP: leukoplakia | ||
| NEOLP: Non-erosive oral lichen planus | ||
| OSCC: Oral squamous cell carcinoma | ||
| Prostate | 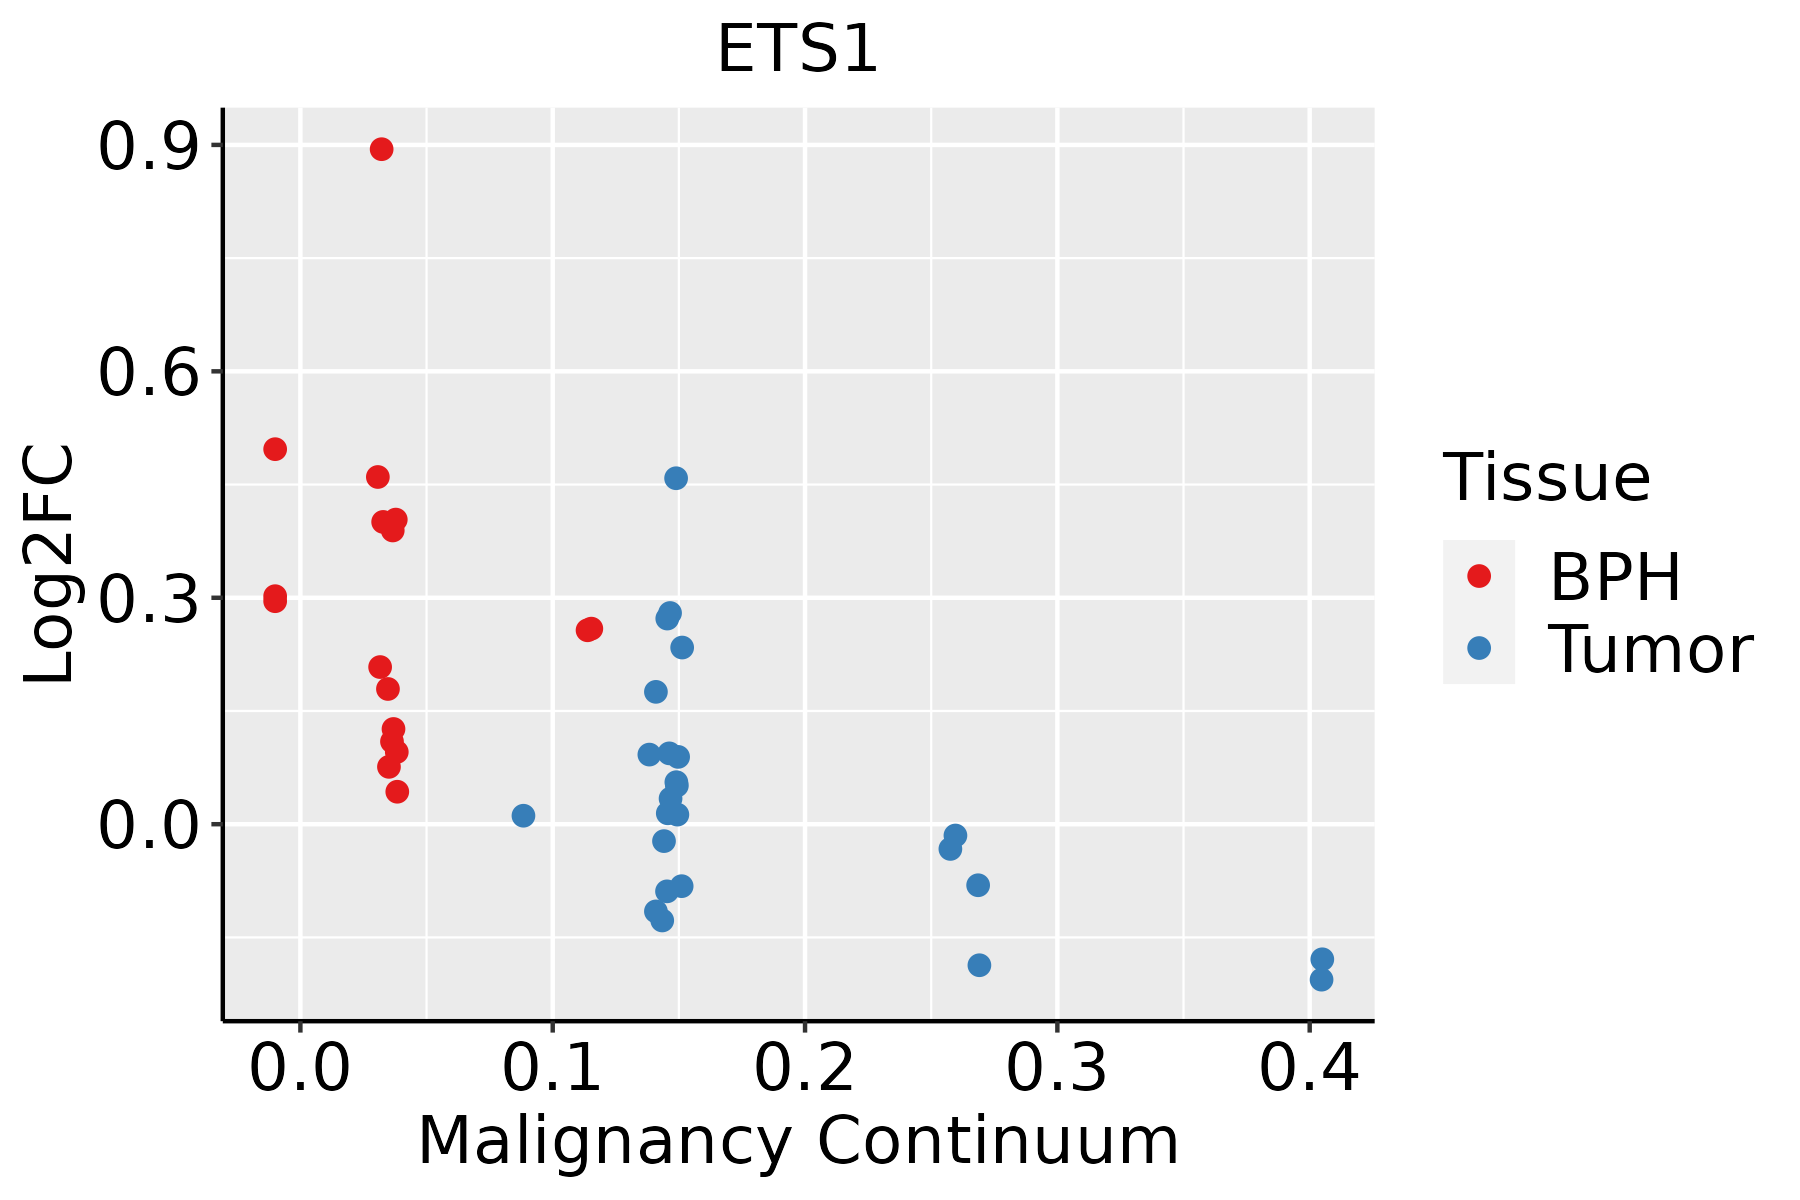 | BPH: Benign Prostatic Hyperplasia |
| Thyroid | 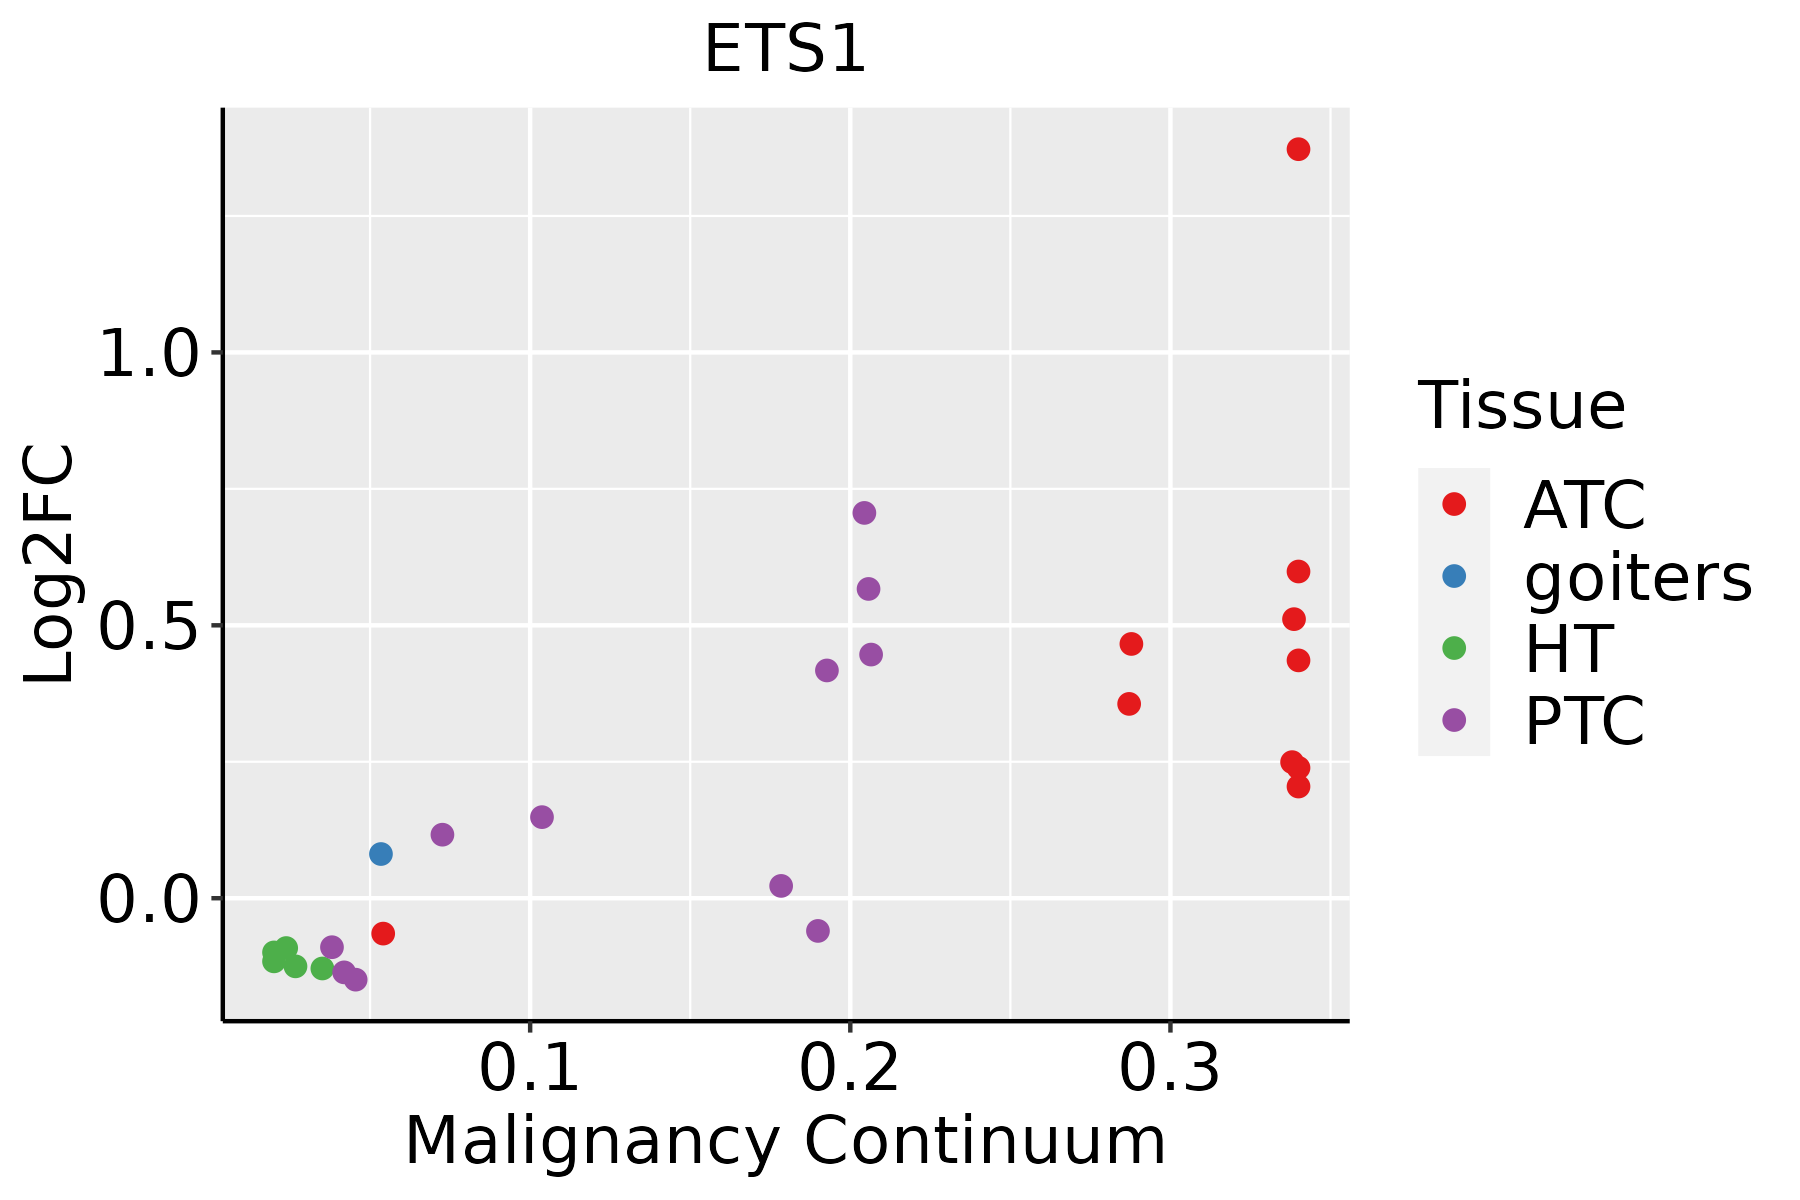 | ATC: Anaplastic thyroid cancer |
| HT: Hashimoto's thyroiditis | ||
| PTC: Papillary thyroid cancer |
| ∗log2FC in expression of this searched gene in stem-like cells from each diseased tissue sample relative to stem-like cells in normal samples in each tissue plotted against the malignancy continuum. Samples are colored based on if they are from different disease stage. |
Top |
Malignant transformation related pathway analysis |
| Find out the enriched GO biological processes and KEGG pathways involved in transition from healthy to precancer to cancer |
| Tissue | Disease Stage | Enriched GO biological Processes |
| Colorectum | AD |  |
| Colorectum | SER |  |
| Colorectum | MSS |  |
| Colorectum | MSI-H |  |
| Colorectum | FAP |  |
| ∗Top 15 enriched GO BP terms are showed in the bar plot of each disease state in each tissue. Each row represents a significant GO biological process which is colored according to the -log10(p.adjust). |
| Page: 1 2 3 4 5 6 7 8 9 |
| GO ID | Tissue | Disease Stage | Description | Gene Ratio | Bg Ratio | pvalue | p.adjust | Count |
| GO:004353411 | Endometrium | EEC | blood vessel endothelial cell migration | 33/2168 | 176/18723 | 3.48e-03 | 2.35e-02 | 33 |
| GO:00457664 | Endometrium | EEC | positive regulation of angiogenesis | 33/2168 | 181/18723 | 5.43e-03 | 3.32e-02 | 33 |
| GO:19040184 | Endometrium | EEC | positive regulation of vasculature development | 33/2168 | 181/18723 | 5.43e-03 | 3.32e-02 | 33 |
| GO:004563914 | Endometrium | EEC | positive regulation of myeloid cell differentiation | 21/2168 | 103/18723 | 6.75e-03 | 3.93e-02 | 21 |
| GO:004484911 | Endometrium | EEC | estrous cycle | 6/2168 | 16/18723 | 6.84e-03 | 3.96e-02 | 6 |
| GO:007055511 | Endometrium | EEC | response to interleukin-1 | 27/2168 | 143/18723 | 6.99e-03 | 4.01e-02 | 27 |
| GO:002241112 | Liver | HCC | cellular component disassembly | 282/7958 | 443/18723 | 1.02e-19 | 1.38e-17 | 282 |
| GO:000697922 | Liver | HCC | response to oxidative stress | 281/7958 | 446/18723 | 9.75e-19 | 1.24e-16 | 281 |
| GO:006219722 | Liver | HCC | cellular response to chemical stress | 216/7958 | 337/18723 | 6.86e-16 | 5.44e-14 | 216 |
| GO:003459922 | Liver | HCC | cellular response to oxidative stress | 183/7958 | 288/18723 | 3.65e-13 | 1.93e-11 | 183 |
| GO:000030222 | Liver | HCC | response to reactive oxygen species | 144/7958 | 222/18723 | 1.24e-11 | 5.09e-10 | 144 |
| GO:004254222 | Liver | HCC | response to hydrogen peroxide | 100/7958 | 146/18723 | 1.79e-10 | 6.15e-09 | 100 |
| GO:003461412 | Liver | HCC | cellular response to reactive oxygen species | 102/7958 | 155/18723 | 3.70e-09 | 9.89e-08 | 102 |
| GO:004873222 | Liver | HCC | gland development | 242/7958 | 436/18723 | 2.26e-08 | 5.28e-07 | 242 |
| GO:00703011 | Liver | HCC | cellular response to hydrogen peroxide | 66/7958 | 98/18723 | 5.74e-07 | 9.07e-06 | 66 |
| GO:000166612 | Liver | HCC | response to hypoxia | 172/7958 | 307/18723 | 1.06e-06 | 1.59e-05 | 172 |
| GO:003629312 | Liver | HCC | response to decreased oxygen levels | 179/7958 | 322/18723 | 1.29e-06 | 1.87e-05 | 179 |
| GO:007048212 | Liver | HCC | response to oxygen levels | 191/7958 | 347/18723 | 1.42e-06 | 2.03e-05 | 191 |
| GO:00069971 | Liver | HCC | nucleus organization | 82/7958 | 133/18723 | 6.32e-06 | 7.72e-05 | 82 |
| GO:003410122 | Liver | HCC | erythrocyte homeostasis | 79/7958 | 129/18723 | 1.32e-05 | 1.47e-04 | 79 |
| Page: 1 2 3 4 5 6 7 8 9 10 11 12 13 14 15 16 17 18 19 20 21 22 23 24 25 26 |
| Pathway ID | Tissue | Disease Stage | Description | Gene Ratio | Bg Ratio | pvalue | p.adjust | qvalue | Count |
| hsa0516626 | Endometrium | AEH | Human T-cell leukemia virus 1 infection | 50/1197 | 222/8465 | 4.30e-04 | 3.11e-03 | 2.27e-03 | 50 |
| hsa0421816 | Endometrium | AEH | Cellular senescence | 37/1197 | 156/8465 | 8.49e-04 | 5.52e-03 | 4.04e-03 | 37 |
| hsa05166111 | Endometrium | AEH | Human T-cell leukemia virus 1 infection | 50/1197 | 222/8465 | 4.30e-04 | 3.11e-03 | 2.27e-03 | 50 |
| hsa0421817 | Endometrium | AEH | Cellular senescence | 37/1197 | 156/8465 | 8.49e-04 | 5.52e-03 | 4.04e-03 | 37 |
| hsa0421825 | Endometrium | EEC | Cellular senescence | 40/1237 | 156/8465 | 1.89e-04 | 1.68e-03 | 1.25e-03 | 40 |
| hsa0516627 | Endometrium | EEC | Human T-cell leukemia virus 1 infection | 52/1237 | 222/8465 | 2.73e-04 | 2.36e-03 | 1.76e-03 | 52 |
| hsa0421835 | Endometrium | EEC | Cellular senescence | 40/1237 | 156/8465 | 1.89e-04 | 1.68e-03 | 1.25e-03 | 40 |
| hsa0516636 | Endometrium | EEC | Human T-cell leukemia virus 1 infection | 52/1237 | 222/8465 | 2.73e-04 | 2.36e-03 | 1.76e-03 | 52 |
| hsa0516622 | Liver | HCC | Human T-cell leukemia virus 1 infection | 139/4020 | 222/8465 | 3.17e-06 | 2.79e-05 | 1.55e-05 | 139 |
| hsa0421822 | Liver | HCC | Cellular senescence | 102/4020 | 156/8465 | 4.18e-06 | 3.59e-05 | 2.00e-05 | 102 |
| hsa0521121 | Liver | HCC | Renal cell carcinoma | 51/4020 | 69/8465 | 6.76e-06 | 5.53e-05 | 3.07e-05 | 51 |
| hsa0516632 | Liver | HCC | Human T-cell leukemia virus 1 infection | 139/4020 | 222/8465 | 3.17e-06 | 2.79e-05 | 1.55e-05 | 139 |
| hsa0421832 | Liver | HCC | Cellular senescence | 102/4020 | 156/8465 | 4.18e-06 | 3.59e-05 | 2.00e-05 | 102 |
| hsa0521131 | Liver | HCC | Renal cell carcinoma | 51/4020 | 69/8465 | 6.76e-06 | 5.53e-05 | 3.07e-05 | 51 |
| hsa0516630 | Oral cavity | OSCC | Human T-cell leukemia virus 1 infection | 150/3704 | 222/8465 | 3.68e-13 | 7.26e-12 | 3.70e-12 | 150 |
| hsa0421820 | Oral cavity | OSCC | Cellular senescence | 112/3704 | 156/8465 | 8.04e-13 | 1.42e-11 | 7.21e-12 | 112 |
| hsa0521116 | Oral cavity | OSCC | Renal cell carcinoma | 51/3704 | 69/8465 | 3.30e-07 | 2.05e-06 | 1.04e-06 | 51 |
| hsa05166113 | Oral cavity | OSCC | Human T-cell leukemia virus 1 infection | 150/3704 | 222/8465 | 3.68e-13 | 7.26e-12 | 3.70e-12 | 150 |
| hsa04218110 | Oral cavity | OSCC | Cellular senescence | 112/3704 | 156/8465 | 8.04e-13 | 1.42e-11 | 7.21e-12 | 112 |
| hsa0521117 | Oral cavity | OSCC | Renal cell carcinoma | 51/3704 | 69/8465 | 3.30e-07 | 2.05e-06 | 1.04e-06 | 51 |
| Page: 1 2 3 |
Top |
Cell-cell communication analysis |
| Identification of potential cell-cell interactions between two cell types and their ligand-receptor pairs for different disease states |
| Ligand | Receptor | LRpair | Pathway | Tissue | Disease Stage |
| Page: 1 |
Top |
Single-cell gene regulatory network inference analysis |
| Find out the significant the regulons (TFs) and the target genes of each regulon across cell types for different disease states |
| TF | Cell Type | Tissue | Disease Stage | Target Gene | RSS | Regulon Activity |
| ETS1 | STM | Breast | DCIS | ARID5B,SERPINE1,PLIN2, etc. | 2.25e-01 |  |
| ETS1 | KER | Cervix | N_HPV | LAMB3,TRPV3,PLOD2, etc. | 2.30e-01 |  |
| ETS1 | TUF | Colorectum | AD | CXCL1,MMP7,DNTTIP1, etc. | 1.19e-02 |  |
| ETS1 | SSC | Colorectum | AD | CXCL1,MMP7,DNTTIP1, etc. | 1.38e-03 | |
| ETS1 | CT | Colorectum | MSI-H | CXCL1,MMP7,DNTTIP1, etc. | 2.79e-02 |  |
| ETS1 | ABS | Colorectum | MSS | CXCL1,MMP7,DNTTIP1, etc. | 9.00e-02 |  |
| ETS1 | IMENT | Colorectum | MSS | CXCL1,MMP7,DNTTIP1, etc. | 6.66e-02 | |
| ETS1 | SURF | Endometrium | EEC | AKAP12,MIR4435-2HG,CYTOR, etc. | 3.68e-01 |  |
| ETS1 | AT2L | Lung | AIS | CD2,IL7R,PTPRC, etc. | 6.48e-01 |  |
| ETS1 | CD8TEXP | Pancreas | ADJ | BCL11B,IL7R,RESF1, etc. | 1.93e-01 |  |
| ∗The dot plots of a searched regulon are shown for all cell subpopulations in each disease state of each tissue based on the regulon specific score inferred using pySCENIC and by calculating the average expression. |
| Page: 1 2 |
Top |
Somatic mutation of malignant transformation related genes |
| Annotation of somatic variants for genes involved in malignant transformation |
| Hugo Symbol | Variant Class | Variant Classification | dbSNP RS | HGVSc | HGVSp | HGVSp Short | SWISSPROT | BIOTYPE | SIFT | PolyPhen | Tumor Sample Barcode | Tissue | Histology | Sex | Age | Stage | Therapy Types | Drugs | Outcome |
| ETS1 | SNV | Missense_Mutation | c.781G>C | p.Asp261His | p.D261H | P14921 | protein_coding | deleterious(0.01) | benign(0.146) | TCGA-A2-A0YC-01 | Breast | breast invasive carcinoma | Female | <65 | I/II | Hormone Therapy | arimidex | PD | |
| ETS1 | SNV | Missense_Mutation | c.313C>A | p.Gln105Lys | p.Q105K | P14921 | protein_coding | tolerated(0.32) | benign(0.041) | TCGA-A8-A076-01 | Breast | breast invasive carcinoma | Female | >=65 | I/II | Hormone Therapy | anastrozole | SD | |
| ETS1 | SNV | Missense_Mutation | c.208N>T | p.Val70Phe | p.V70F | P14921 | protein_coding | tolerated(0.52) | benign(0.015) | TCGA-AC-A23C-01 | Breast | breast invasive carcinoma | Female | <65 | I/II | Chemotherapy | chemo | CR | |
| ETS1 | SNV | Missense_Mutation | rs765597503 | c.761N>C | p.Leu254Pro | p.L254P | P14921 | protein_coding | deleterious(0.03) | probably_damaging(0.916) | TCGA-AN-A0FX-01 | Breast | breast invasive carcinoma | Female | <65 | I/II | Unknown | Unknown | SD |
| ETS1 | SNV | Missense_Mutation | c.26N>A | p.Gly9Glu | p.G9E | P14921 | protein_coding | deleterious_low_confidence(0.04) | benign(0) | TCGA-E2-A15E-01 | Breast | breast invasive carcinoma | Female | <65 | I/II | Chemotherapy | doxorubicin | SD | |
| ETS1 | SNV | Missense_Mutation | novel | c.718C>A | p.Leu240Ile | p.L240I | P14921 | protein_coding | tolerated(0.33) | benign(0.018) | TCGA-EW-A1OX-01 | Breast | breast invasive carcinoma | Female | <65 | I/II | Chemotherapy | taxotere | SD |
| ETS1 | deletion | Frame_Shift_Del | novel | c.1409delC | p.Pro470LeufsTer120 | p.P470Lfs*120 | P14921 | protein_coding | TCGA-EW-A2FV-01 | Breast | breast invasive carcinoma | Female | <65 | III/IV | Chemotherapy | docetaxel | SD | ||
| ETS1 | SNV | Missense_Mutation | c.533N>C | p.Lys178Thr | p.K178T | P14921 | protein_coding | deleterious(0) | probably_damaging(0.999) | TCGA-CA-6717-01 | Colorectum | colon adenocarcinoma | Male | <65 | I/II | Chemotherapy | oxaliplatin | CR | |
| ETS1 | SNV | Missense_Mutation | c.779N>T | p.Thr260Ile | p.T260I | P14921 | protein_coding | tolerated(0.3) | benign(0) | TCGA-CM-6679-01 | Colorectum | colon adenocarcinoma | Male | <65 | I/II | Unknown | Unknown | SD | |
| ETS1 | SNV | Missense_Mutation | rs137970618 | c.823N>A | p.Val275Ile | p.V275I | P14921 | protein_coding | tolerated(0.36) | benign(0.102) | TCGA-G4-6307-01 | Colorectum | colon adenocarcinoma | Female | <65 | III/IV | Chemotherapy | fluorouracil | SD |
| Page: 1 2 3 4 5 6 |
Top |
Related drugs of malignant transformation related genes |
| Identification of chemicals and drugs interact with genes involved in malignant transfromation |
| (DGIdb 4.0) |
| Entrez ID | Symbol | Category | Interaction Types | Drug Claim Name | Drug Name | PMIDs |
| Page: 1 |

Copyright 2023-Present -The University of Texas Health Science Center at Houston |