| Tissue | Expression Dynamics | Abbreviation |
| Breast |  | IDC: Invasive ductal carcinoma |
| DCIS: Ductal carcinoma in situ |
| Precancer(BRCA1-mut): Precancerous lesion from BRCA1 mutation carriers |
| Cervix | 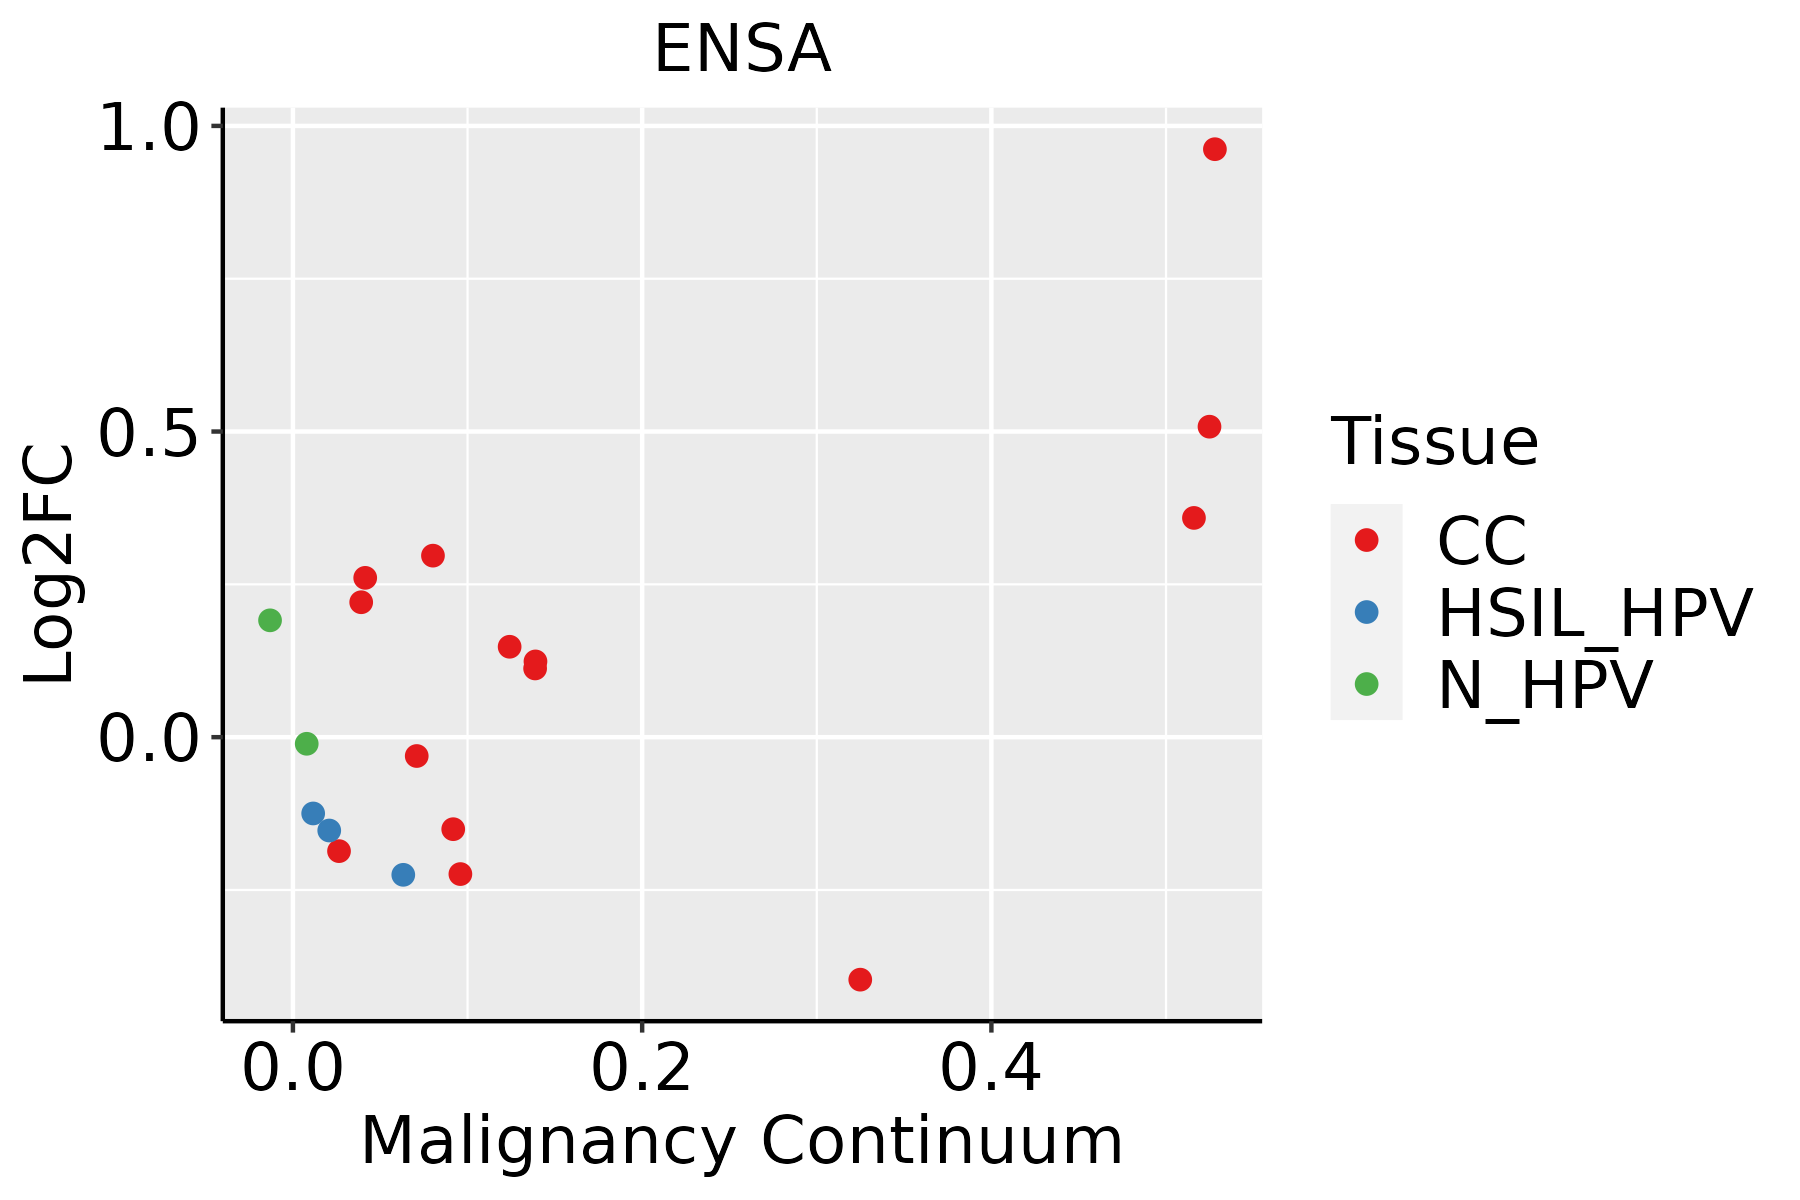 | CC: Cervix cancer |
| HSIL_HPV: HPV-infected high-grade squamous intraepithelial lesions |
| N_HPV: HPV-infected normal cervix |
| Colorectum (GSE201348) |  | FAP: Familial adenomatous polyposis |
| CRC: Colorectal cancer |
| Colorectum (HTA11) |  | AD: Adenomas |
| SER: Sessile serrated lesions |
| MSI-H: Microsatellite-high colorectal cancer |
| MSS: Microsatellite stable colorectal cancer |
| Endometrium |  | AEH: Atypical endometrial hyperplasia |
| EEC: Endometrioid Cancer |
| Esophagus | 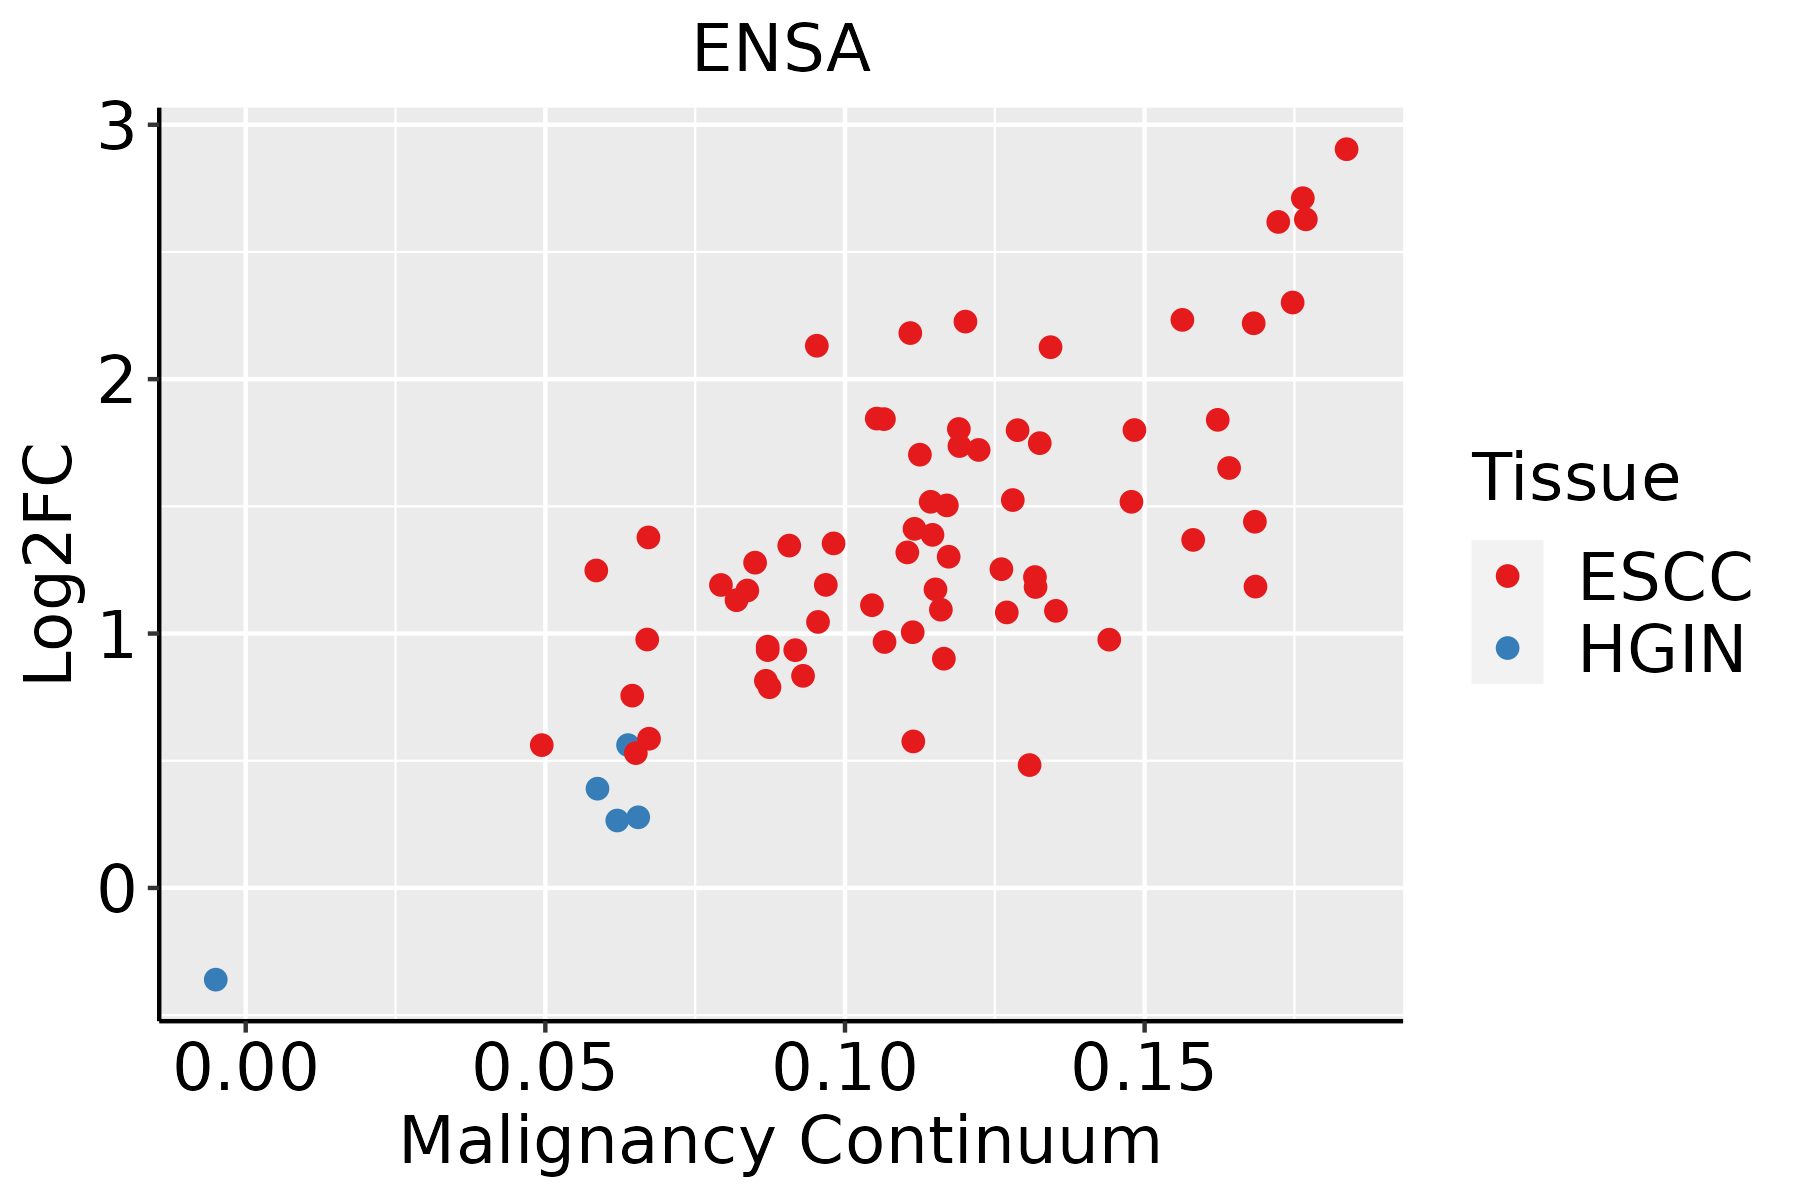 | ESCC: Esophageal squamous cell carcinoma |
| HGIN: High-grade intraepithelial neoplasias |
| LGIN: Low-grade intraepithelial neoplasias |
| Liver |  | HCC: Hepatocellular carcinoma |
| NAFLD: Non-alcoholic fatty liver disease |
| Lung | 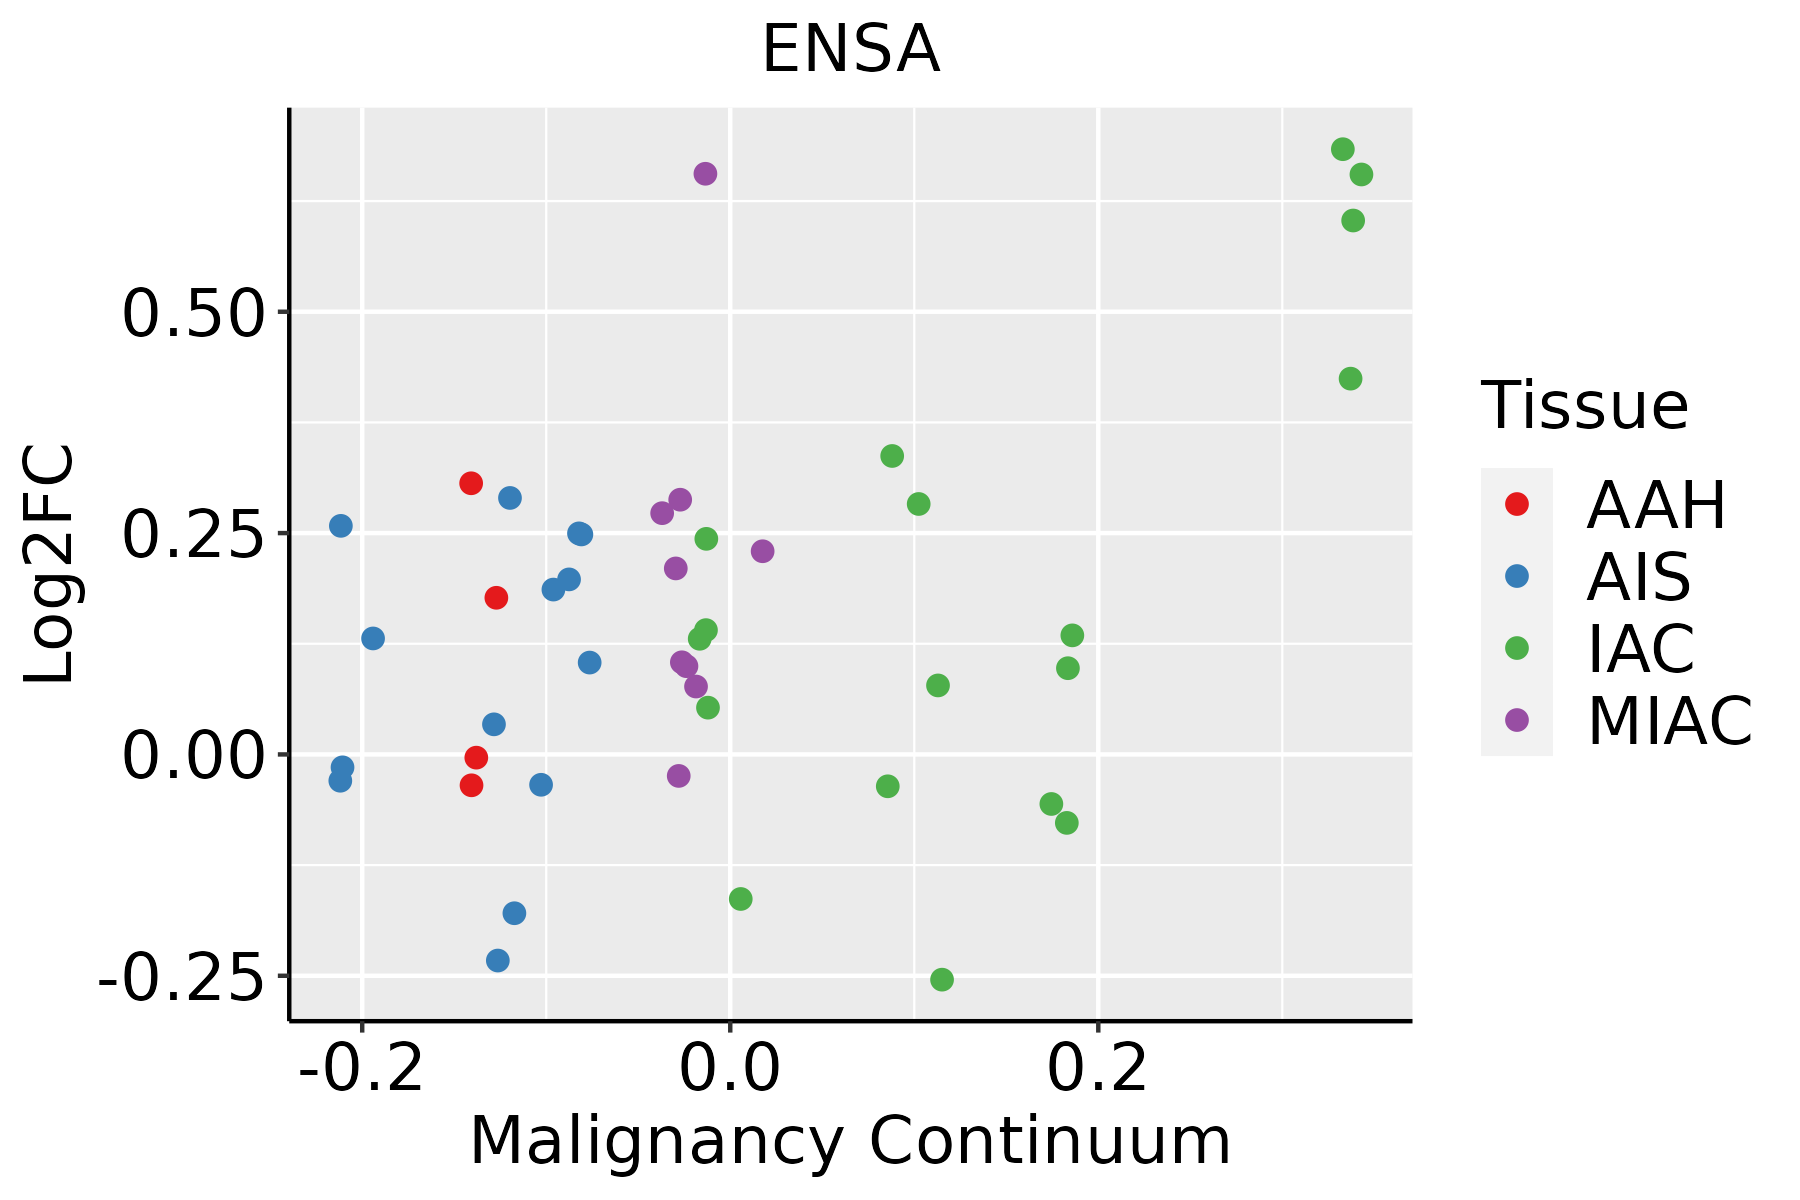 | AAH: Atypical adenomatous hyperplasia |
| AIS: Adenocarcinoma in situ |
| IAC: Invasive lung adenocarcinoma |
| MIA: Minimally invasive adenocarcinoma |
| Oral Cavity | 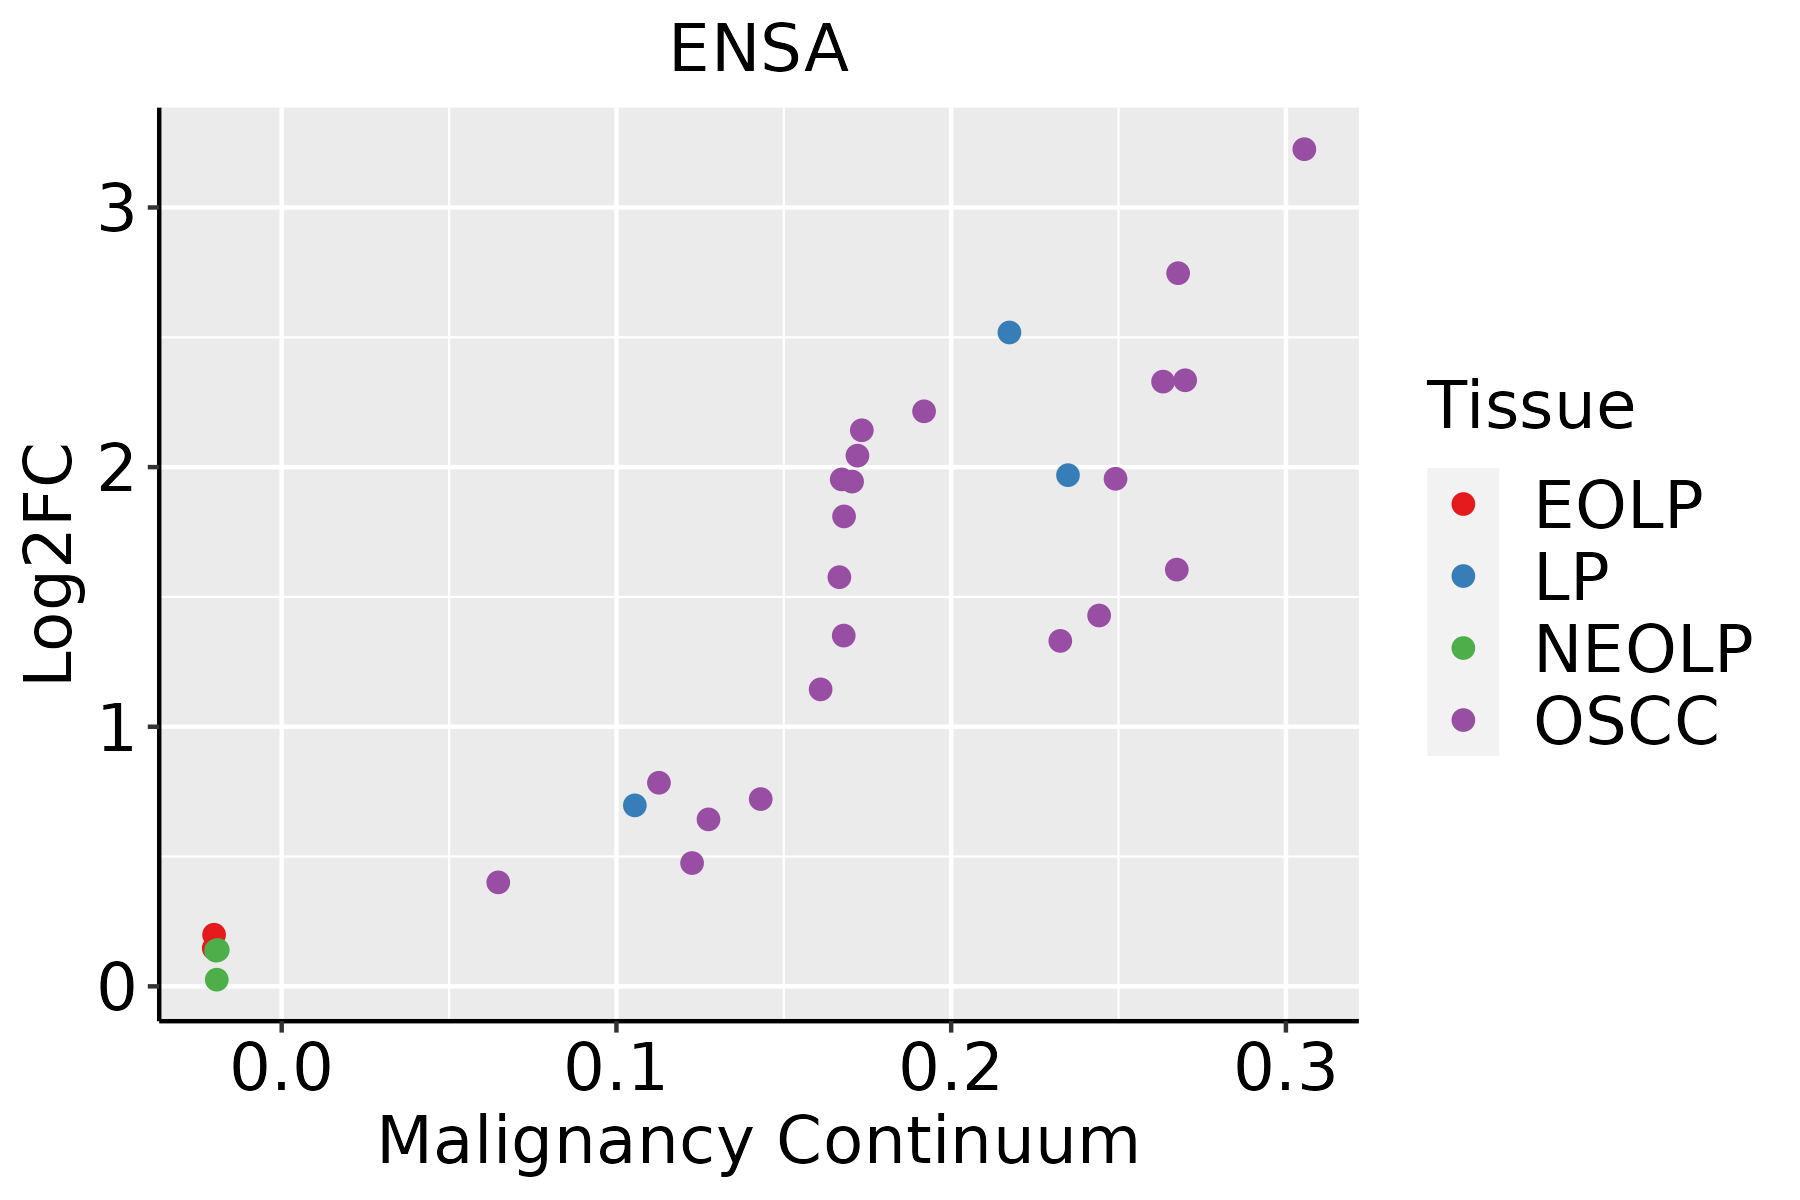 | EOLP: Erosive Oral lichen planus |
| LP: leukoplakia |
| NEOLP: Non-erosive oral lichen planus |
| OSCC: Oral squamous cell carcinoma |
| Skin | 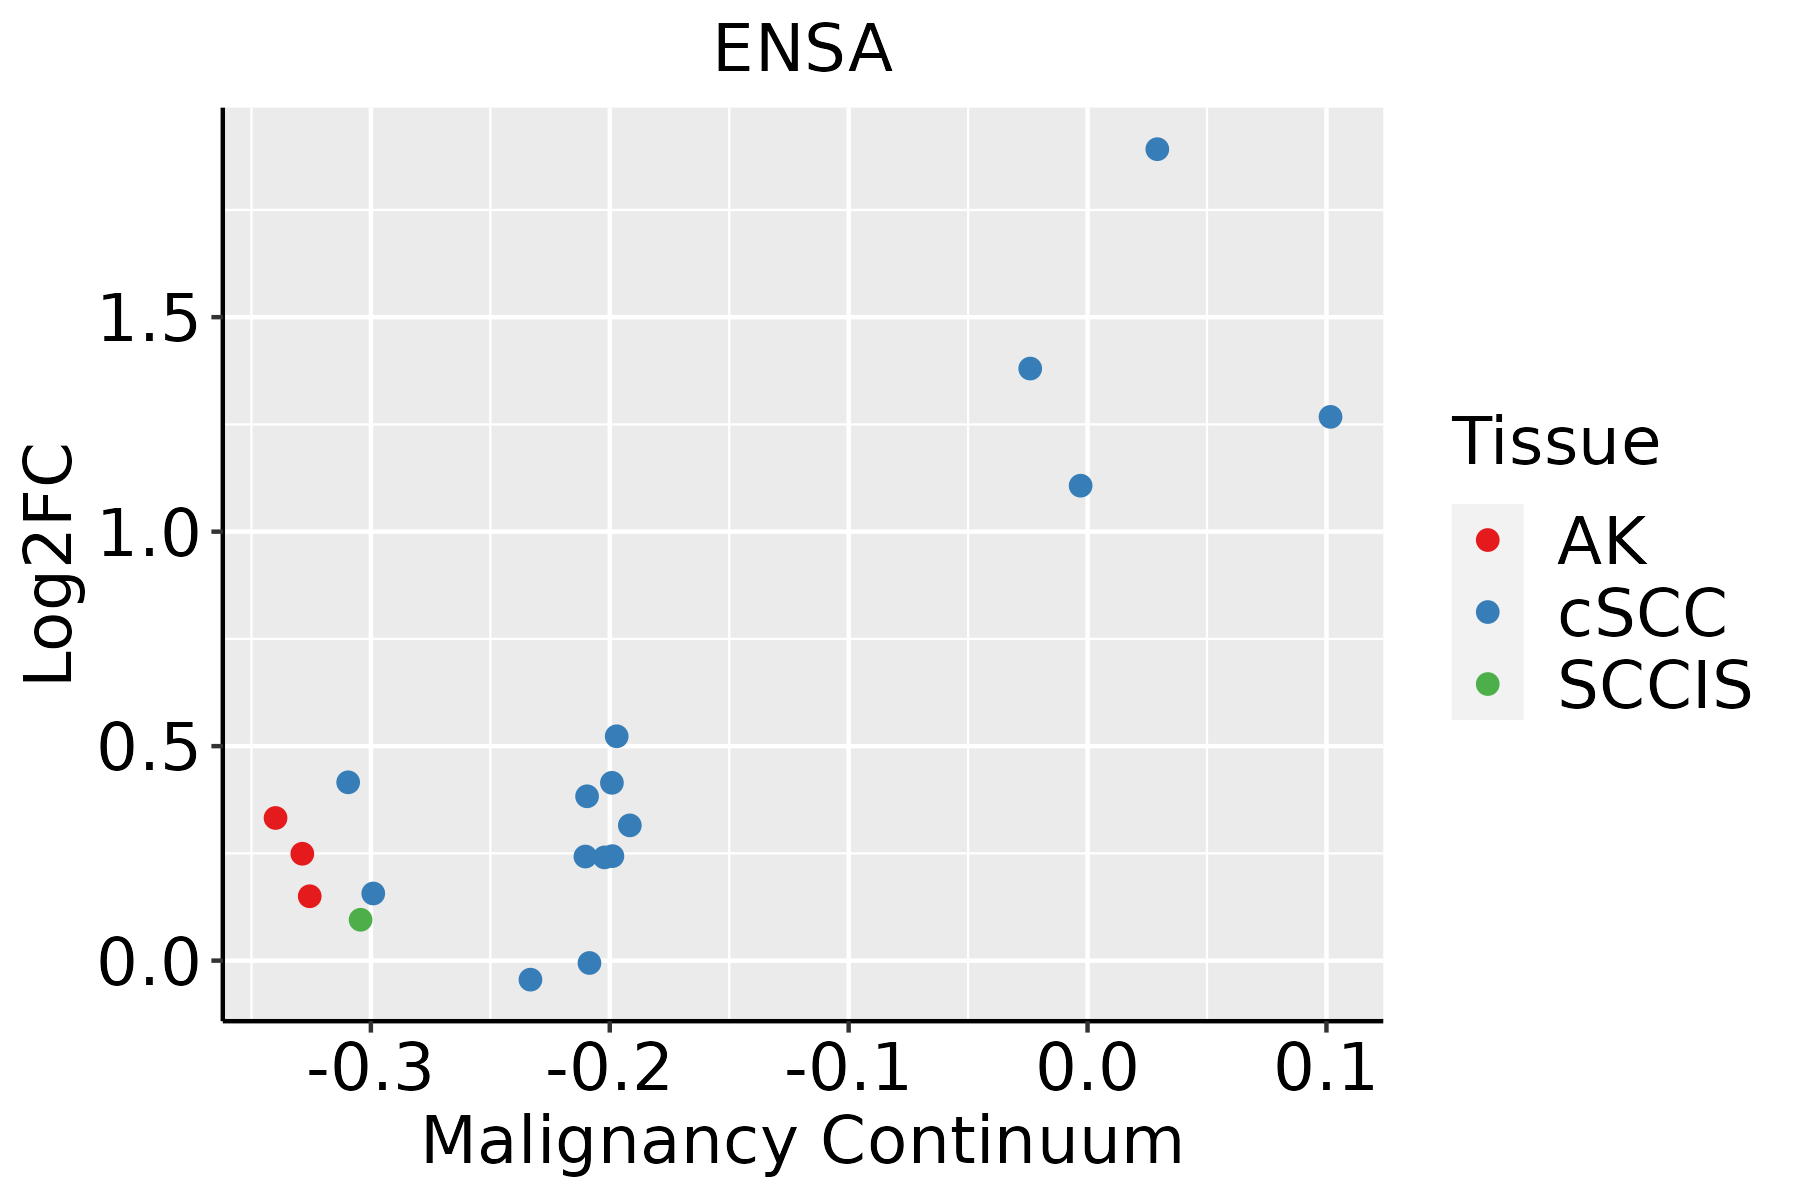 | AK: Actinic keratosis |
| cSCC: Cutaneous squamous cell carcinoma |
| SCCIS:squamous cell carcinoma in situ |
| Thyroid | 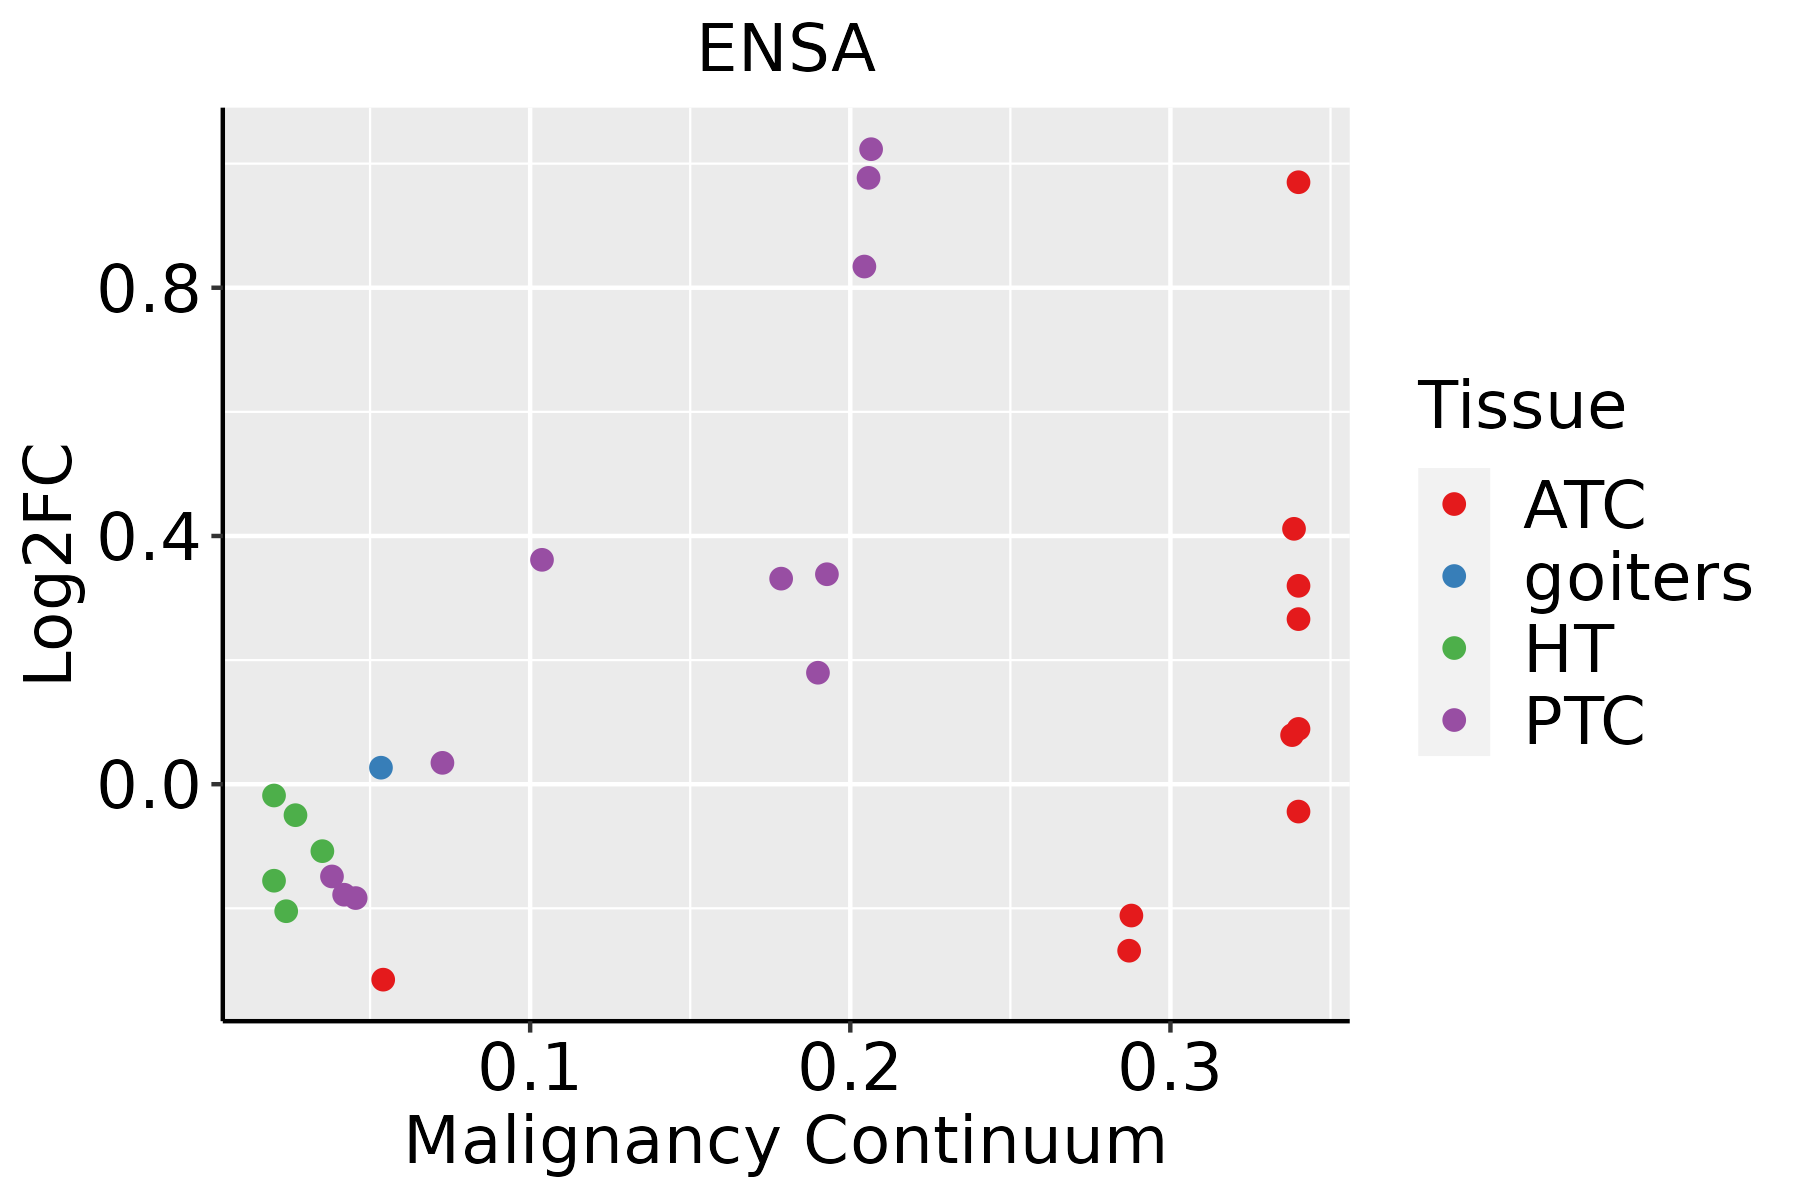 | ATC: Anaplastic thyroid cancer |
| HT: Hashimoto's thyroiditis |
| PTC: Papillary thyroid cancer |
| GO ID | Tissue | Disease Stage | Description | Gene Ratio | Bg Ratio | pvalue | p.adjust | Count |
| GO:00355923 | Colorectum | FAP | establishment of protein localization to extracellular region | 79/2622 | 360/18723 | 2.48e-05 | 5.77e-04 | 79 |
| GO:00342844 | Colorectum | FAP | response to monosaccharide | 54/2622 | 225/18723 | 3.84e-05 | 8.22e-04 | 54 |
| GO:00459364 | Colorectum | FAP | negative regulation of phosphate metabolic process | 92/2622 | 441/18723 | 4.43e-05 | 9.26e-04 | 92 |
| GO:00105634 | Colorectum | FAP | negative regulation of phosphorus metabolic process | 92/2622 | 442/18723 | 4.84e-05 | 9.91e-04 | 92 |
| GO:00716923 | Colorectum | FAP | protein localization to extracellular region | 79/2622 | 368/18723 | 5.50e-05 | 1.10e-03 | 79 |
| GO:00097494 | Colorectum | FAP | response to glucose | 51/2622 | 212/18723 | 5.82e-05 | 1.15e-03 | 51 |
| GO:00507963 | Colorectum | FAP | regulation of insulin secretion | 42/2622 | 165/18723 | 6.52e-05 | 1.25e-03 | 42 |
| GO:00097464 | Colorectum | FAP | response to hexose | 52/2622 | 219/18723 | 7.13e-05 | 1.32e-03 | 52 |
| GO:0023061 | Colorectum | FAP | signal release | 94/2622 | 463/18723 | 1.06e-04 | 1.76e-03 | 94 |
| GO:00316673 | Colorectum | FAP | response to nutrient levels | 95/2622 | 474/18723 | 1.59e-04 | 2.43e-03 | 95 |
| GO:00300733 | Colorectum | FAP | insulin secretion | 46/2622 | 195/18723 | 2.12e-04 | 3.03e-03 | 46 |
| GO:00158333 | Colorectum | FAP | peptide transport | 58/2622 | 264/18723 | 2.71e-04 | 3.64e-03 | 58 |
| GO:00902763 | Colorectum | FAP | regulation of peptide hormone secretion | 45/2622 | 196/18723 | 4.66e-04 | 5.41e-03 | 45 |
| GO:00900873 | Colorectum | FAP | regulation of peptide transport | 46/2622 | 202/18723 | 4.91e-04 | 5.66e-03 | 46 |
| GO:00027913 | Colorectum | FAP | regulation of peptide secretion | 45/2622 | 200/18723 | 7.36e-04 | 7.83e-03 | 45 |
| GO:00300722 | Colorectum | FAP | peptide hormone secretion | 51/2622 | 236/18723 | 9.09e-04 | 9.19e-03 | 51 |
| GO:00428862 | Colorectum | FAP | amide transport | 62/2622 | 301/18723 | 1.01e-03 | 9.93e-03 | 62 |
| GO:00353044 | Colorectum | FAP | regulation of protein dephosphorylation | 24/2622 | 90/18723 | 1.12e-03 | 1.08e-02 | 24 |
| GO:00027902 | Colorectum | FAP | peptide secretion | 51/2622 | 242/18723 | 1.62e-03 | 1.43e-02 | 51 |
| GO:0046883 | Colorectum | FAP | regulation of hormone secretion | 50/2622 | 249/18723 | 4.97e-03 | 3.32e-02 | 50 |
| Hugo Symbol | Variant Class | Variant Classification | dbSNP RS | HGVSc | HGVSp | HGVSp Short | SWISSPROT | BIOTYPE | SIFT | PolyPhen | Tumor Sample Barcode | Tissue | Histology | Sex | Age | Stage | Therapy Types | Drugs | Outcome |
| ENSA | SNV | Missense_Mutation | | c.5N>A | p.Ser2Tyr | p.S2Y | O43768 | protein_coding | deleterious_low_confidence(0) | probably_damaging(0.989) | TCGA-A2-A04U-01 | Breast | breast invasive carcinoma | Female | <65 | I/II | Chemotherapy | adriamycin | SD |
| ENSA | SNV | Missense_Mutation | | c.109N>G | p.Leu37Val | p.L37V | O43768 | protein_coding | deleterious(0.05) | probably_damaging(0.962) | TCGA-B6-A0IB-01 | Breast | breast invasive carcinoma | Female | <65 | III/IV | Unknown | Unknown | PD |
| ENSA | insertion | Frame_Shift_Ins | novel | c.181_182insTGGTTAGGGAGGGAGAG | p.Gly61ValfsTer39 | p.G61Vfs*39 | O43768 | protein_coding | | | TCGA-AN-A0FX-01 | Breast | breast invasive carcinoma | Female | <65 | I/II | Unknown | Unknown | SD |
| ENSA | SNV | Missense_Mutation | novel | c.24G>T | p.Glu8Asp | p.E8D | O43768 | protein_coding | tolerated(0.15) | benign(0.009) | TCGA-AG-A002-01 | Colorectum | rectum adenocarcinoma | Male | <65 | I/II | Unknown | Unknown | SD |
| ENSA | insertion | Frame_Shift_Ins | novel | c.347_348insC | p.Gln117ThrfsTer21 | p.Q117Tfs*21 | O43768 | protein_coding | | | TCGA-AA-3492-01 | Colorectum | colon adenocarcinoma | Female | >=65 | I/II | Unknown | Unknown | SD |
| ENSA | SNV | Missense_Mutation | | c.301N>A | p.Ala101Thr | p.A101T | O43768 | protein_coding | tolerated(0.13) | possibly_damaging(0.692) | TCGA-AX-A06D-01 | Endometrium | uterine corpus endometrioid carcinoma | Female | >=65 | III/IV | Chemotherapy | carboplatin | PD |
| ENSA | SNV | Missense_Mutation | | c.301N>A | p.Ala101Thr | p.A101T | O43768 | protein_coding | tolerated(0.13) | possibly_damaging(0.692) | TCGA-AX-A06H-01 | Endometrium | uterine corpus endometrioid carcinoma | Female | <65 | III/IV | Chemotherapy | paclitaxel | SD |
| ENSA | SNV | Missense_Mutation | novel | c.266C>T | p.Ala89Val | p.A89V | O43768 | protein_coding | deleterious(0.03) | benign(0.27) | TCGA-AX-A2HD-01 | Endometrium | uterine corpus endometrioid carcinoma | Female | >=65 | III/IV | Unknown | Unknown | SD |
| ENSA | SNV | Missense_Mutation | rs759538315 | c.154G>A | p.Asp52Asn | p.D52N | O43768 | protein_coding | tolerated(0.14) | benign(0.07) | TCGA-B5-A11E-01 | Endometrium | uterine corpus endometrioid carcinoma | Female | <65 | I/II | Unknown | Unknown | SD |
| ENSA | SNV | Missense_Mutation | novel | c.24N>T | p.Glu8Asp | p.E8D | O43768 | protein_coding | tolerated(0.15) | benign(0.009) | TCGA-BK-A6W3-01 | Endometrium | uterine corpus endometrioid carcinoma | Female | <65 | I/II | Unknown | Unknown | SD |


