
|
|||||
|
 | |
| |
| |
| |
| |
| |
|
Gene: EIF4H |
Gene summary for EIF4H |
| Gene information | Species | Human | Gene symbol | EIF4H | Gene ID | 7458 |
| Gene name | eukaryotic translation initiation factor 4H | |
| Gene Alias | WBSCR1 | |
| Cytomap | 7q11.23 | |
| Gene Type | protein-coding | GO ID | GO:0000003 | UniProtAcc | Q15056 |
Top |
Malignant transformation analysis |
| Identification of the aberrant gene expression in precancerous and cancerous lesions by comparing the gene expression of stem-like cells in diseased tissues with normal stem cells |
| Entrez ID | Symbol | Replicates | Species | Organ | Tissue | Adj P-value | Log2FC | Malignancy |
| 7458 | EIF4H | HTA11_2487_2000001011 | Human | Colorectum | SER | 1.24e-11 | 5.90e-01 | -0.1808 |
| 7458 | EIF4H | HTA11_1938_2000001011 | Human | Colorectum | AD | 2.85e-09 | 5.98e-01 | -0.0811 |
| 7458 | EIF4H | HTA11_78_2000001011 | Human | Colorectum | AD | 5.14e-14 | 6.67e-01 | -0.1088 |
| 7458 | EIF4H | HTA11_347_2000001011 | Human | Colorectum | AD | 4.24e-22 | 6.62e-01 | -0.1954 |
| 7458 | EIF4H | HTA11_411_2000001011 | Human | Colorectum | SER | 7.11e-07 | 7.72e-01 | -0.2602 |
| 7458 | EIF4H | HTA11_3361_2000001011 | Human | Colorectum | AD | 1.11e-03 | 4.17e-01 | -0.1207 |
| 7458 | EIF4H | HTA11_83_2000001011 | Human | Colorectum | SER | 6.15e-07 | 4.35e-01 | -0.1526 |
| 7458 | EIF4H | HTA11_696_2000001011 | Human | Colorectum | AD | 4.53e-15 | 5.85e-01 | -0.1464 |
| 7458 | EIF4H | HTA11_1391_2000001011 | Human | Colorectum | AD | 8.15e-13 | 7.34e-01 | -0.059 |
| 7458 | EIF4H | HTA11_5212_2000001011 | Human | Colorectum | AD | 2.18e-07 | 6.70e-01 | -0.2061 |
| 7458 | EIF4H | HTA11_866_3004761011 | Human | Colorectum | AD | 6.32e-11 | 5.24e-01 | 0.096 |
| 7458 | EIF4H | HTA11_4255_2000001011 | Human | Colorectum | SER | 1.91e-06 | 5.97e-01 | 0.0446 |
| 7458 | EIF4H | HTA11_8622_2000001021 | Human | Colorectum | SER | 9.29e-03 | 5.51e-01 | 0.0528 |
| 7458 | EIF4H | HTA11_10623_2000001011 | Human | Colorectum | AD | 3.56e-05 | 6.79e-01 | -0.0177 |
| 7458 | EIF4H | HTA11_6801_2000001011 | Human | Colorectum | SER | 1.27e-12 | 1.06e+00 | 0.0171 |
| 7458 | EIF4H | HTA11_7696_3000711011 | Human | Colorectum | AD | 7.11e-08 | 5.09e-01 | 0.0674 |
| 7458 | EIF4H | HTA11_99999970781_79442 | Human | Colorectum | MSS | 3.22e-32 | 9.78e-01 | 0.294 |
| 7458 | EIF4H | HTA11_99999965062_69753 | Human | Colorectum | MSI-H | 7.15e-05 | 1.30e+00 | 0.3487 |
| 7458 | EIF4H | HTA11_99999965104_69814 | Human | Colorectum | MSS | 6.76e-22 | 1.05e+00 | 0.281 |
| 7458 | EIF4H | HTA11_99999971662_82457 | Human | Colorectum | MSS | 3.42e-15 | 7.18e-01 | 0.3859 |
| Page: 1 2 3 4 5 6 7 8 9 |
| Tissue | Expression Dynamics | Abbreviation |
| Colorectum (GSE201348) |  | FAP: Familial adenomatous polyposis |
| CRC: Colorectal cancer | ||
| Colorectum (HTA11) |  | AD: Adenomas |
| SER: Sessile serrated lesions | ||
| MSI-H: Microsatellite-high colorectal cancer | ||
| MSS: Microsatellite stable colorectal cancer | ||
| Esophagus | 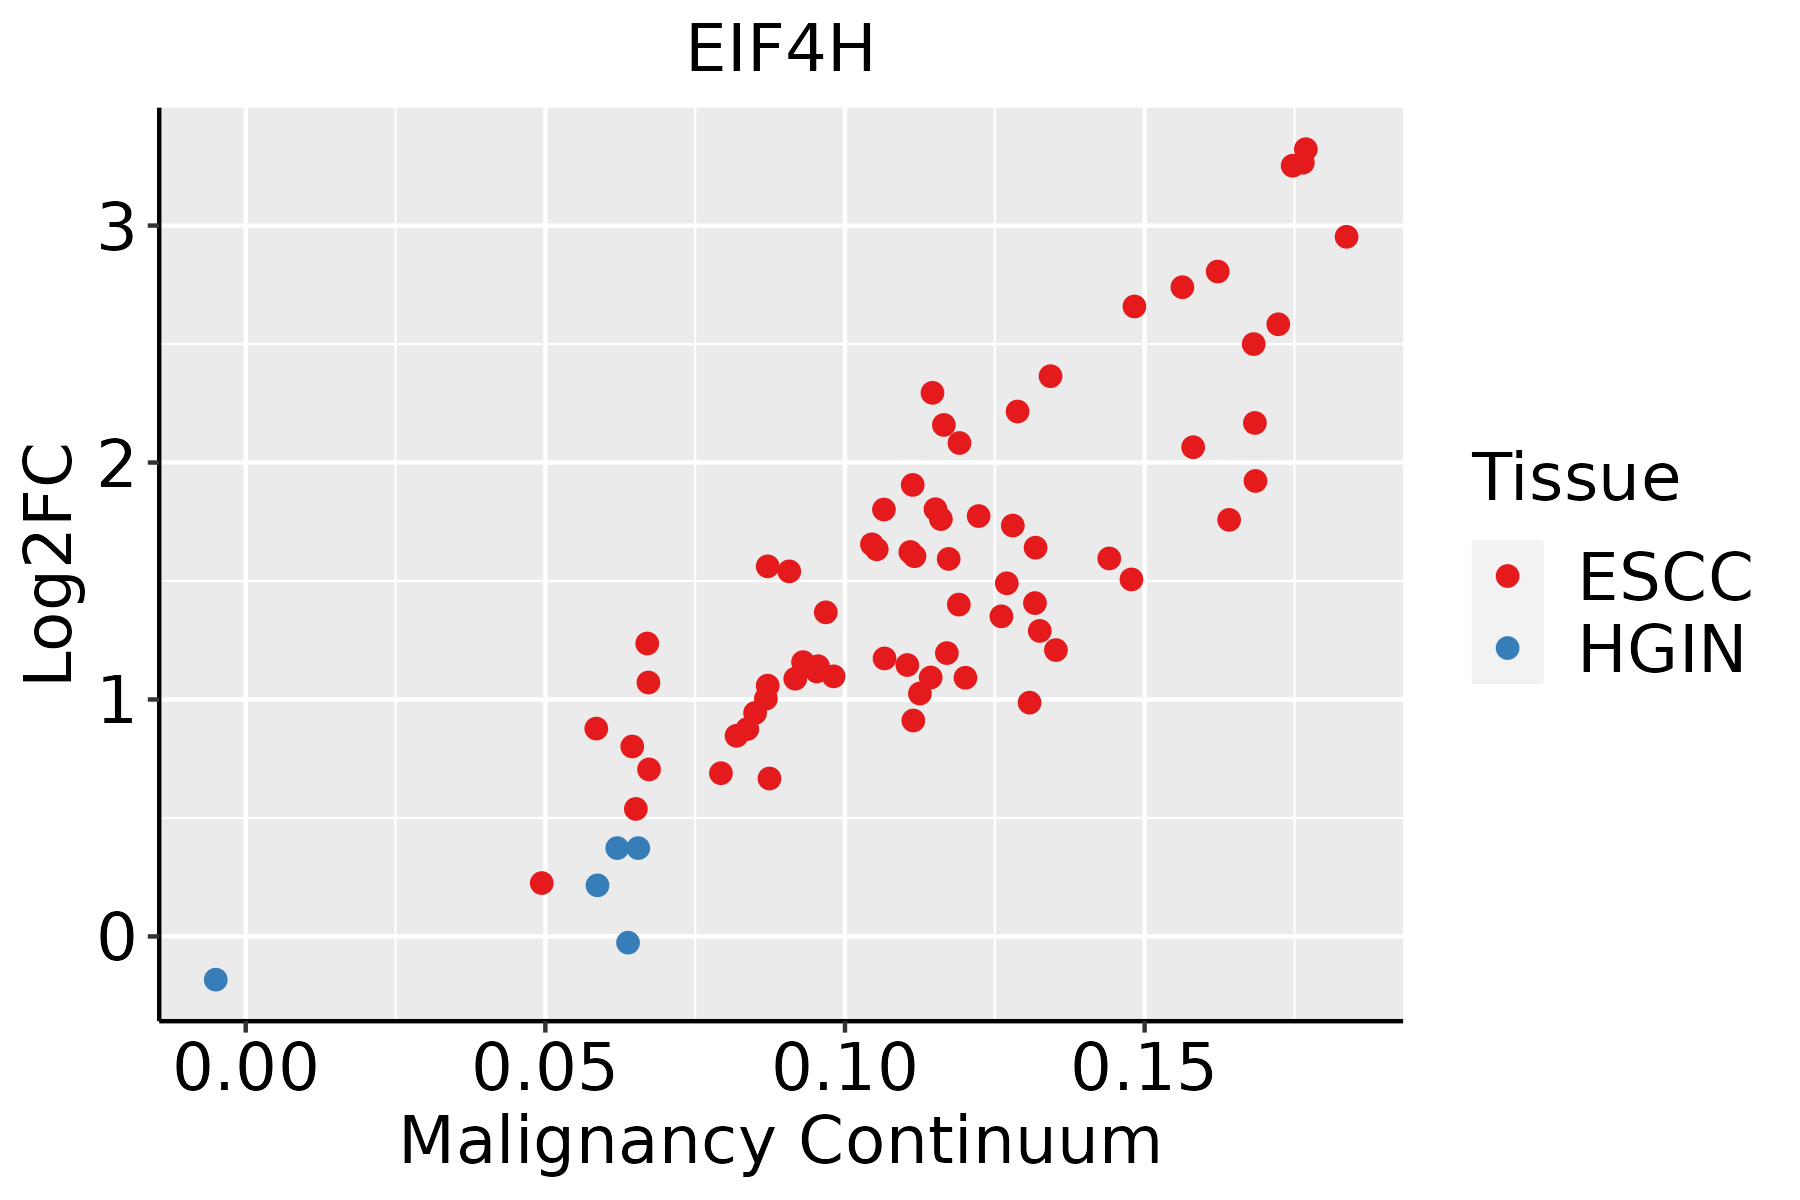 | ESCC: Esophageal squamous cell carcinoma |
| HGIN: High-grade intraepithelial neoplasias | ||
| LGIN: Low-grade intraepithelial neoplasias | ||
| Liver |  | HCC: Hepatocellular carcinoma |
| NAFLD: Non-alcoholic fatty liver disease | ||
| Oral Cavity | 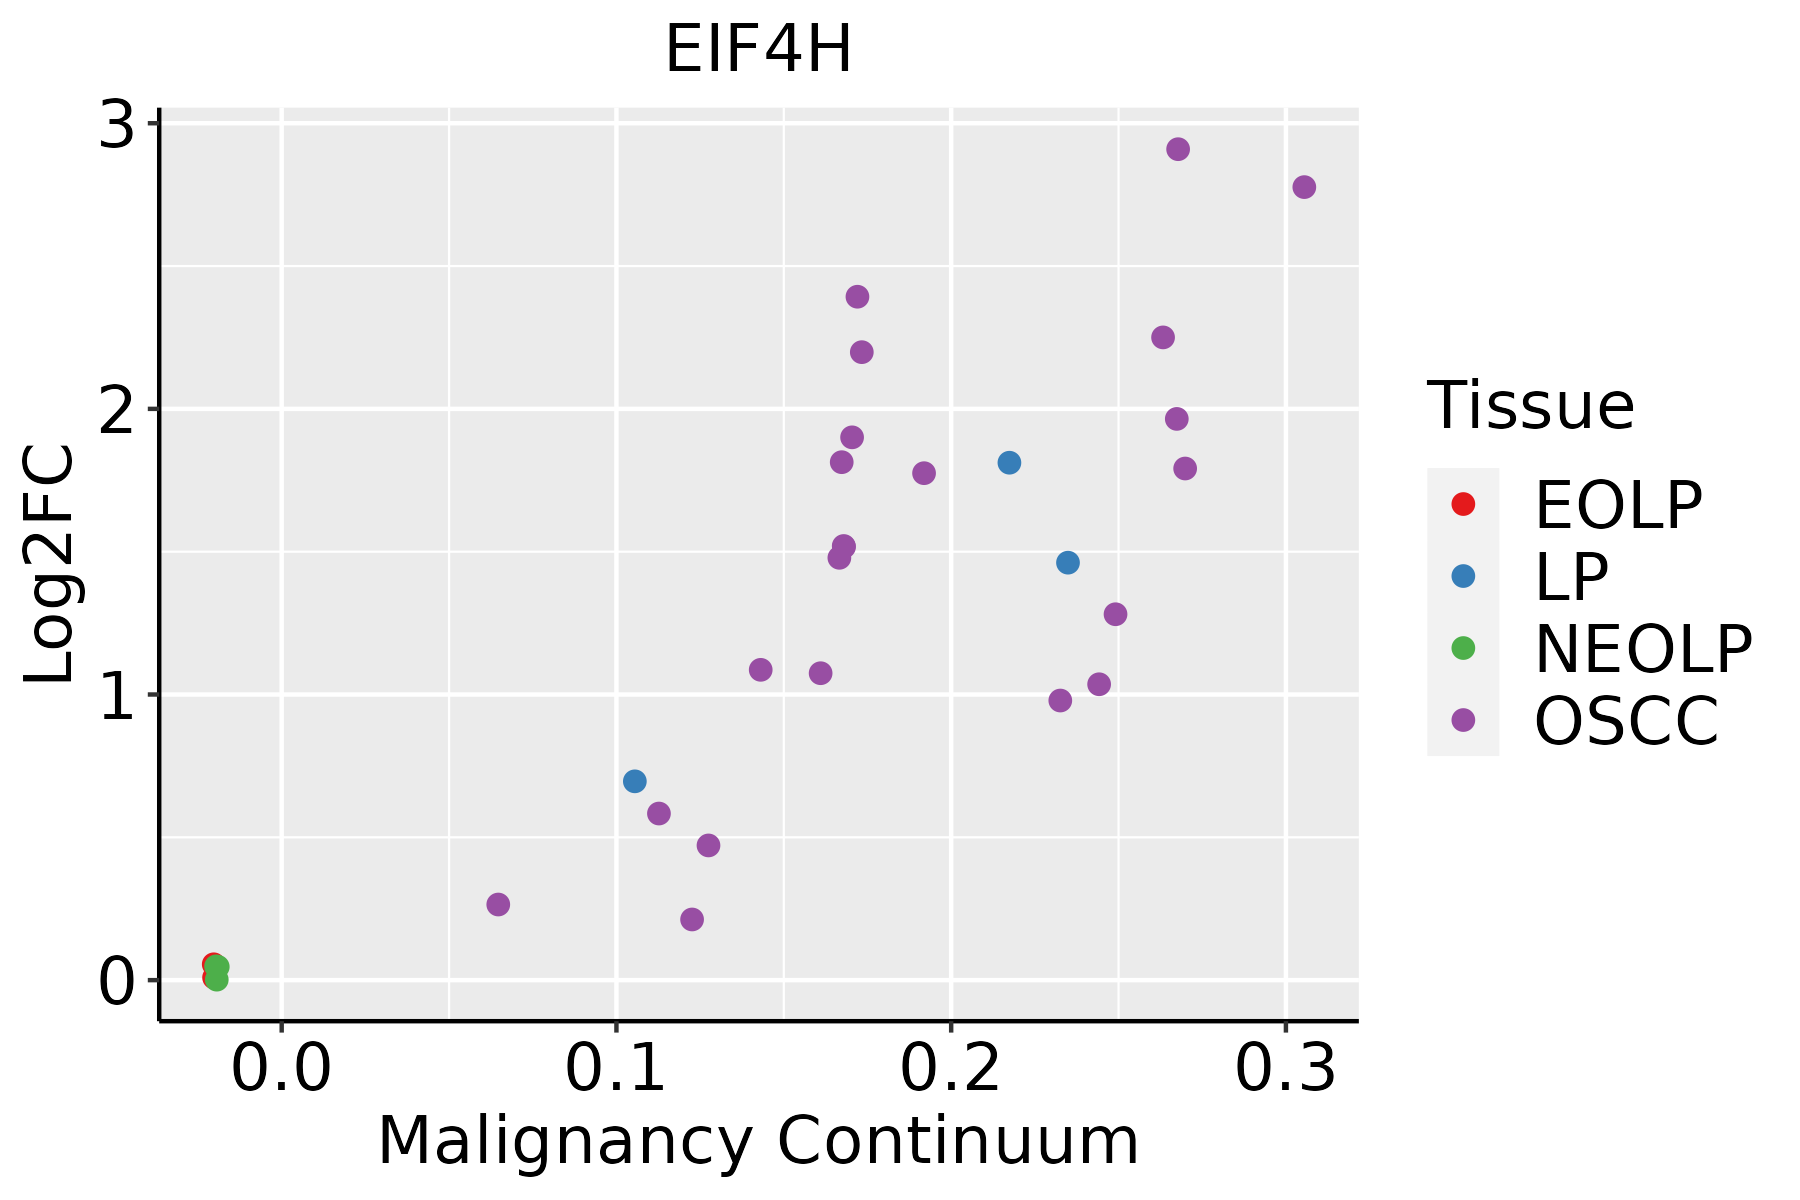 | EOLP: Erosive Oral lichen planus |
| LP: leukoplakia | ||
| NEOLP: Non-erosive oral lichen planus | ||
| OSCC: Oral squamous cell carcinoma | ||
| Prostate | 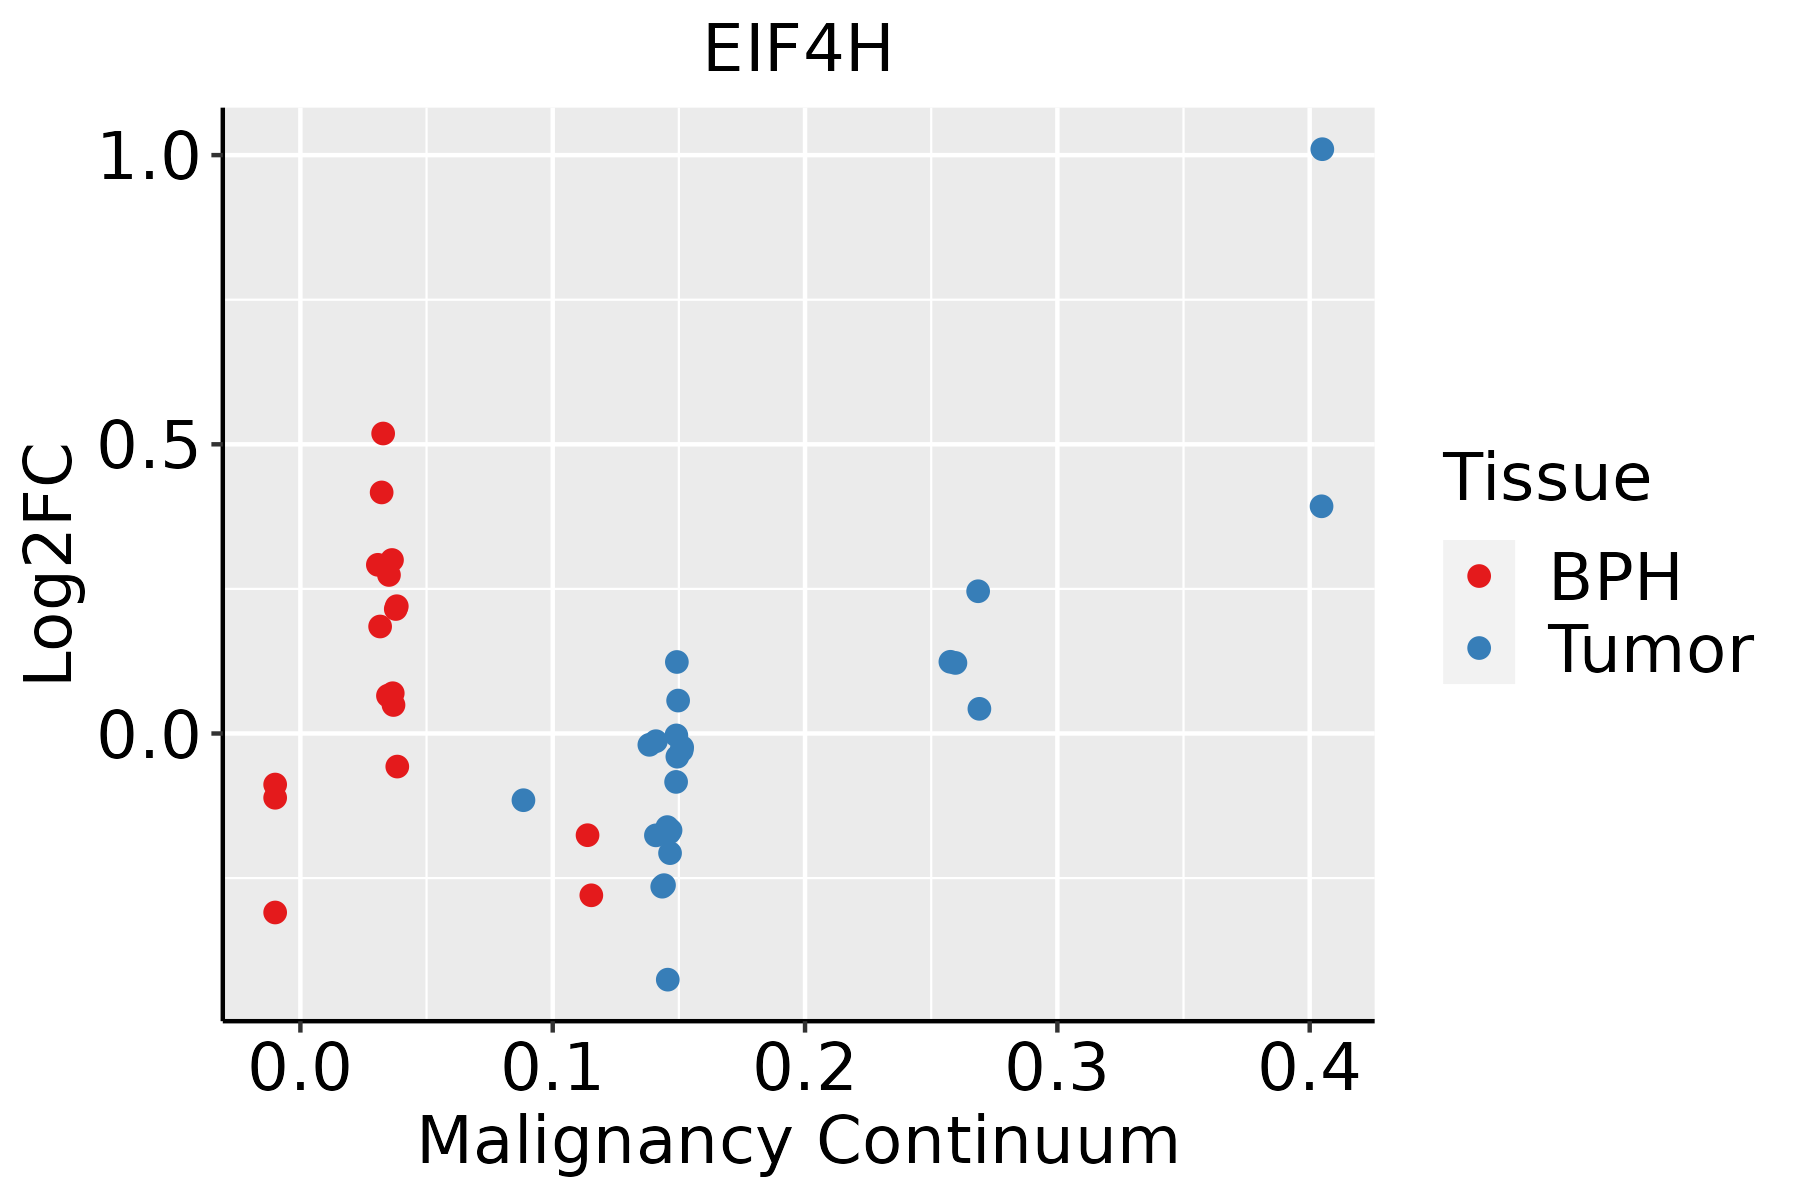 | BPH: Benign Prostatic Hyperplasia |
| Skin | 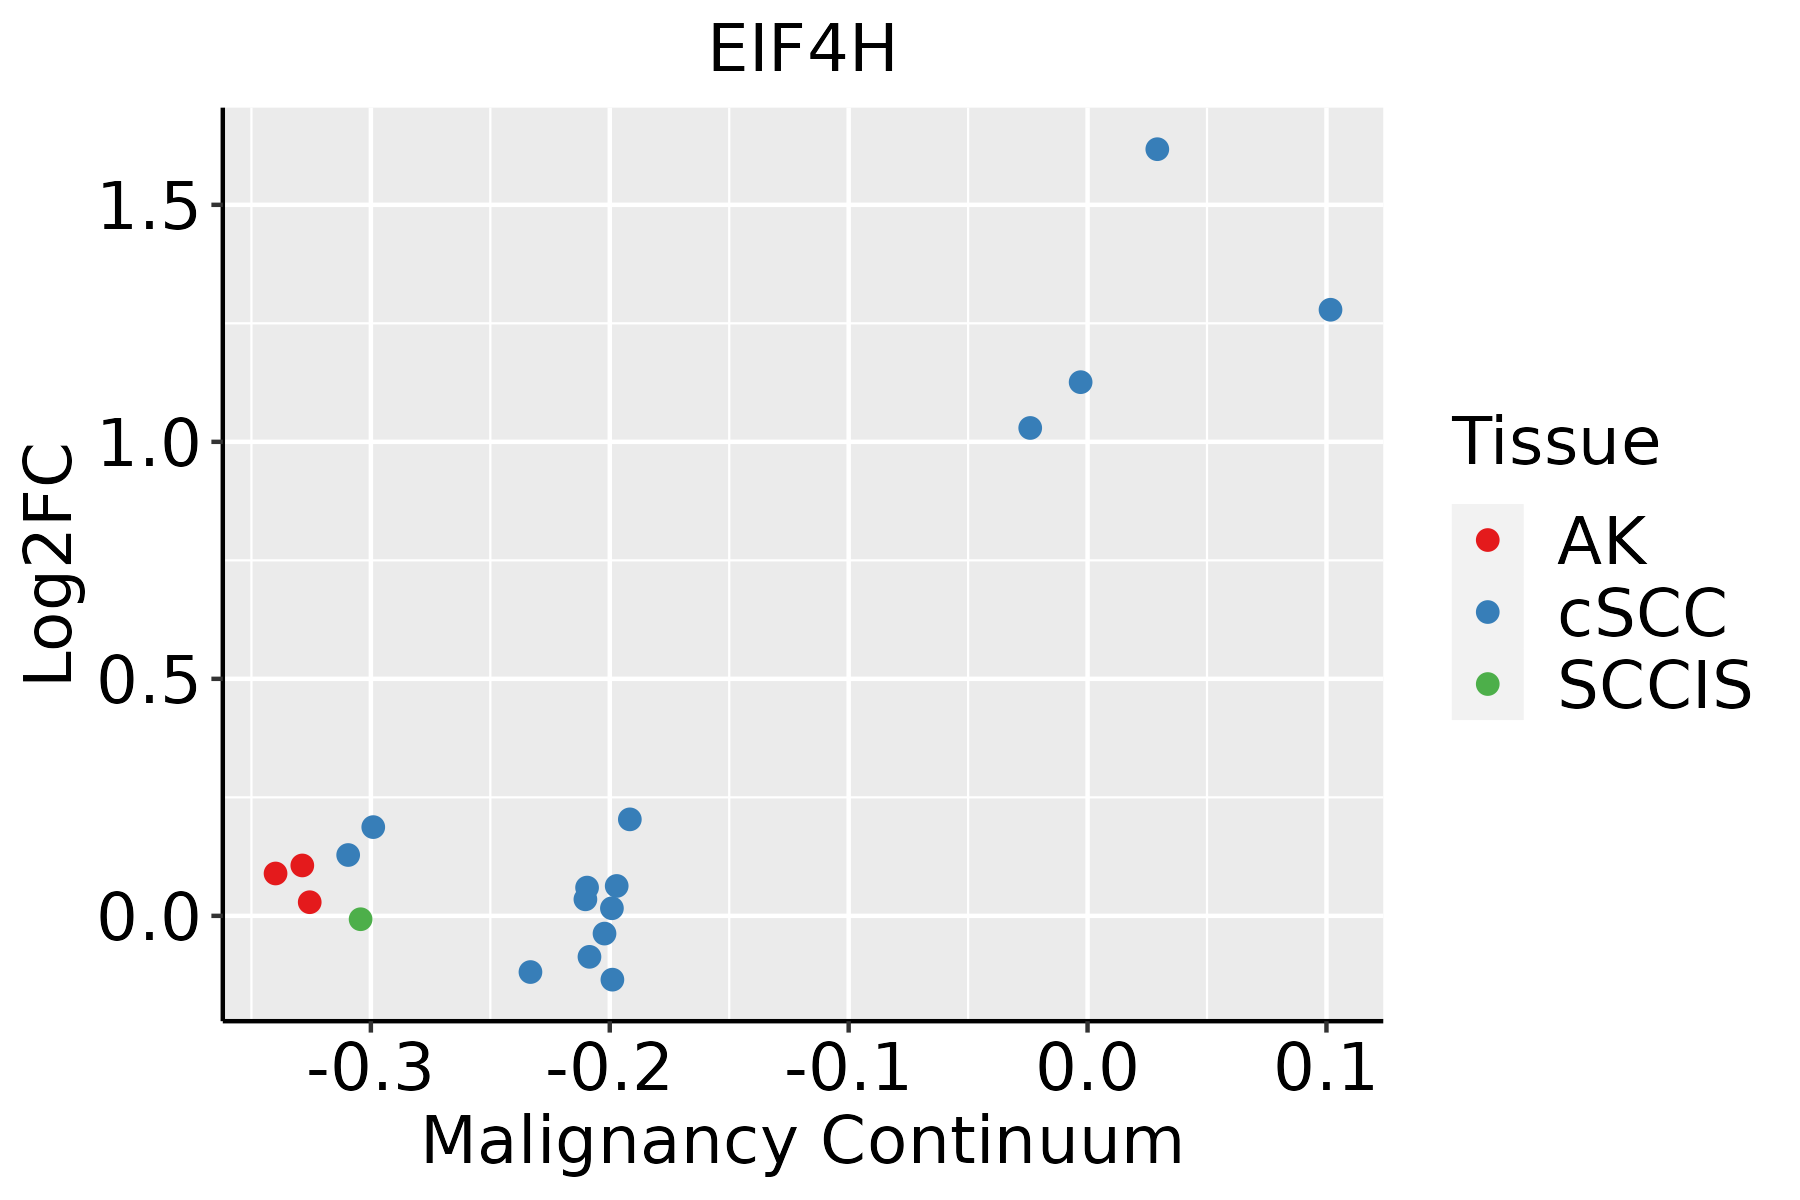 | AK: Actinic keratosis |
| cSCC: Cutaneous squamous cell carcinoma | ||
| SCCIS:squamous cell carcinoma in situ | ||
| Thyroid | 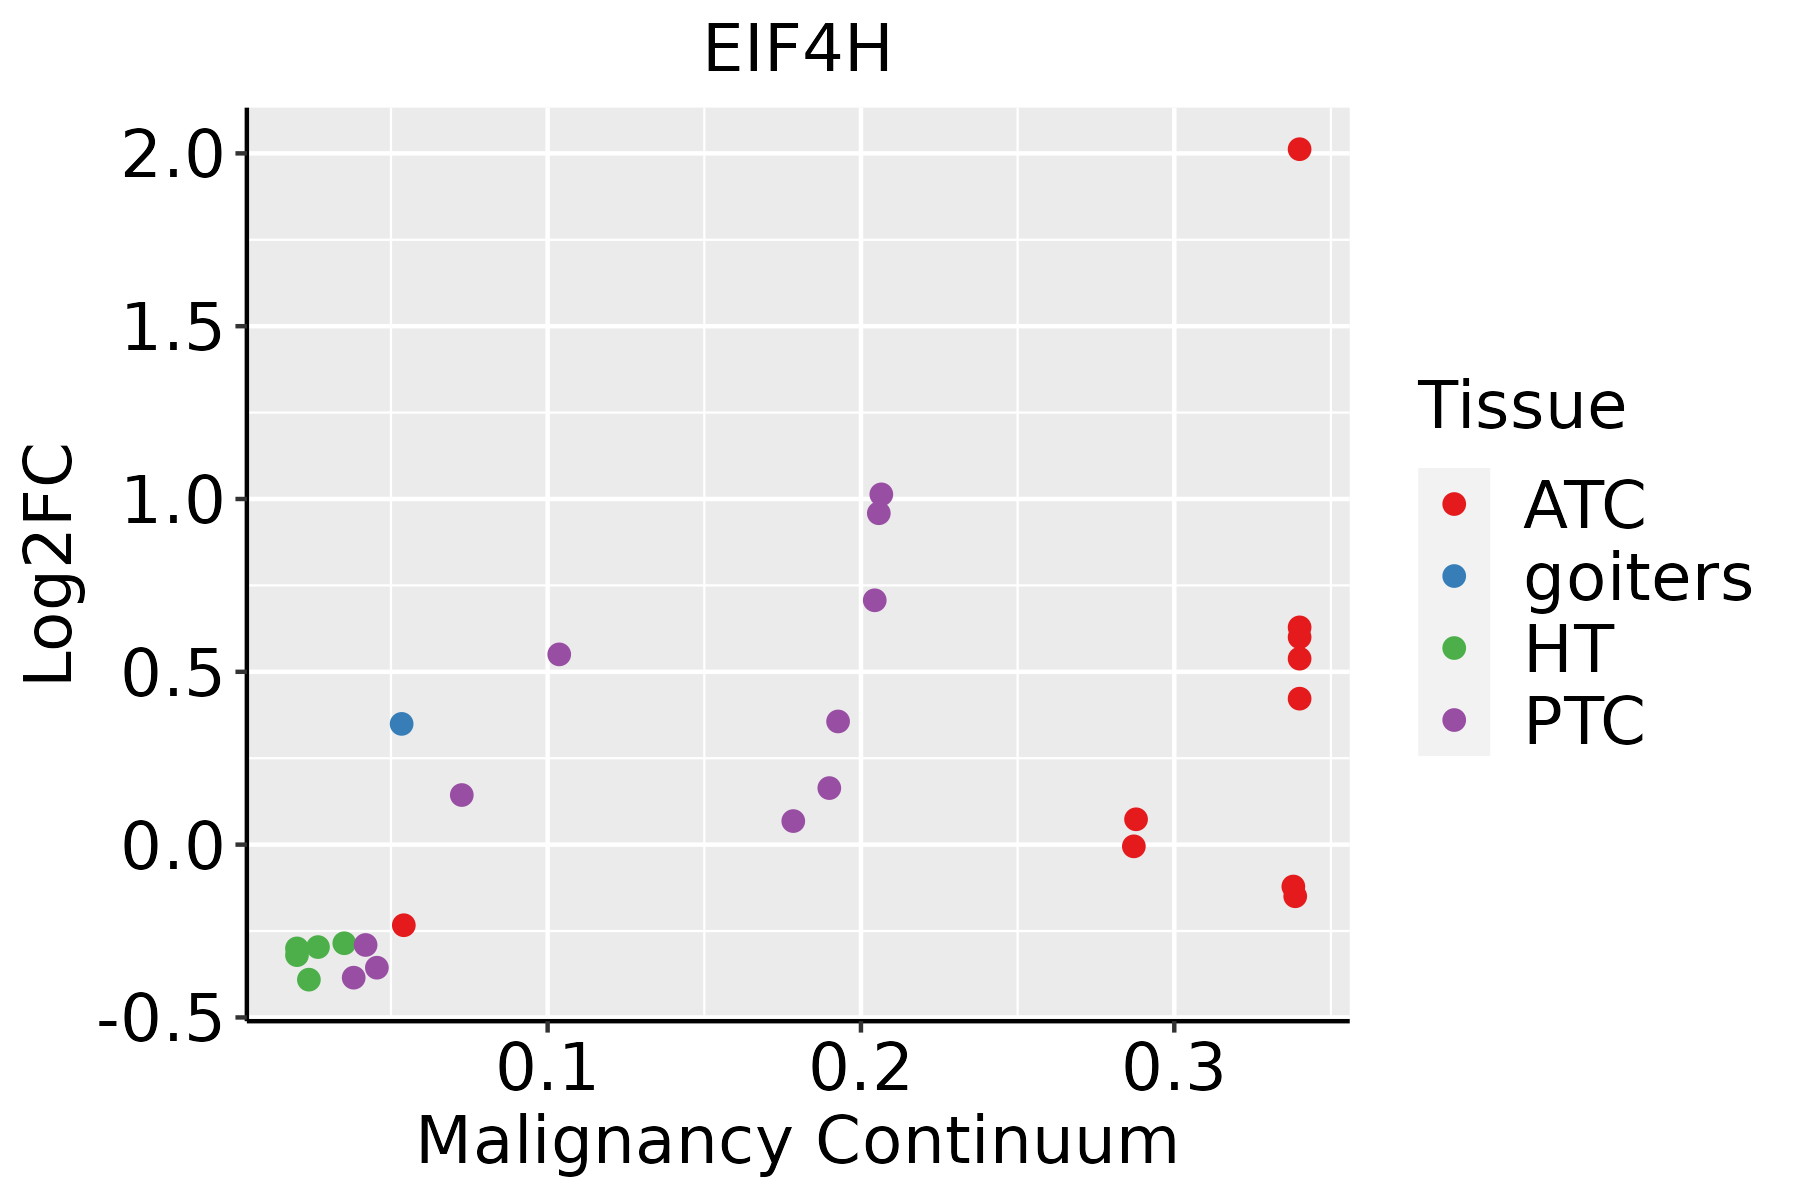 | ATC: Anaplastic thyroid cancer |
| HT: Hashimoto's thyroiditis | ||
| PTC: Papillary thyroid cancer |
| ∗log2FC in expression of this searched gene in stem-like cells from each diseased tissue sample relative to stem-like cells in normal samples in each tissue plotted against the malignancy continuum. Samples are colored based on if they are from different disease stage. |
Top |
Malignant transformation related pathway analysis |
| Find out the enriched GO biological processes and KEGG pathways involved in transition from healthy to precancer to cancer |
| Tissue | Disease Stage | Enriched GO biological Processes |
| Colorectum | AD |  |
| Colorectum | SER |  |
| Colorectum | MSS |  |
| Colorectum | MSI-H |  |
| Colorectum | FAP |  |
| ∗Top 15 enriched GO BP terms are showed in the bar plot of each disease state in each tissue. Each row represents a significant GO biological process which is colored according to the -log10(p.adjust). |
| Page: 1 2 3 4 5 6 7 8 9 |
| GO ID | Tissue | Disease Stage | Description | Gene Ratio | Bg Ratio | pvalue | p.adjust | Count |
| GO:000641316 | Prostate | BPH | translational initiation | 59/3107 | 118/18723 | 4.78e-17 | 1.14e-14 | 59 |
| GO:007182618 | Prostate | BPH | ribonucleoprotein complex subunit organization | 87/3107 | 227/18723 | 2.63e-15 | 4.07e-13 | 87 |
| GO:002261818 | Prostate | BPH | ribonucleoprotein complex assembly | 85/3107 | 220/18723 | 3.16e-15 | 4.55e-13 | 85 |
| GO:000218316 | Prostate | BPH | cytoplasmic translational initiation | 25/3107 | 34/18723 | 3.24e-13 | 3.10e-11 | 25 |
| GO:00064468 | Prostate | BPH | regulation of translational initiation | 39/3107 | 79/18723 | 1.57e-11 | 1.13e-09 | 39 |
| GO:00017317 | Prostate | BPH | formation of translation preinitiation complex | 7/3107 | 11/18723 | 6.10e-04 | 4.16e-03 | 7 |
| GO:000218119 | Prostate | Tumor | cytoplasmic translation | 115/3246 | 148/18723 | 1.36e-58 | 8.43e-55 | 115 |
| GO:000641317 | Prostate | Tumor | translational initiation | 66/3246 | 118/18723 | 2.57e-21 | 2.66e-18 | 66 |
| GO:000641719 | Prostate | Tumor | regulation of translation | 161/3246 | 468/18723 | 1.55e-19 | 8.74e-17 | 161 |
| GO:002261319 | Prostate | Tumor | ribonucleoprotein complex biogenesis | 159/3246 | 463/18723 | 3.17e-19 | 1.52e-16 | 159 |
| GO:007182619 | Prostate | Tumor | ribonucleoprotein complex subunit organization | 91/3246 | 227/18723 | 3.62e-16 | 7.50e-14 | 91 |
| GO:002261819 | Prostate | Tumor | ribonucleoprotein complex assembly | 89/3246 | 220/18723 | 3.94e-16 | 7.89e-14 | 89 |
| GO:000644615 | Prostate | Tumor | regulation of translational initiation | 44/3246 | 79/18723 | 1.37e-14 | 1.89e-12 | 44 |
| GO:000218317 | Prostate | Tumor | cytoplasmic translational initiation | 25/3246 | 34/18723 | 8.99e-13 | 8.73e-11 | 25 |
| GO:000173113 | Prostate | Tumor | formation of translation preinitiation complex | 7/3246 | 11/18723 | 8.04e-04 | 5.44e-03 | 7 |
| GO:002261329 | Skin | cSCC | ribonucleoprotein complex biogenesis | 302/4864 | 463/18723 | 5.13e-72 | 3.22e-68 | 302 |
| GO:000218129 | Skin | cSCC | cytoplasmic translation | 127/4864 | 148/18723 | 4.83e-53 | 7.57e-50 | 127 |
| GO:007182629 | Skin | cSCC | ribonucleoprotein complex subunit organization | 140/4864 | 227/18723 | 5.54e-30 | 3.16e-27 | 140 |
| GO:002261829 | Skin | cSCC | ribonucleoprotein complex assembly | 136/4864 | 220/18723 | 2.60e-29 | 1.25e-26 | 136 |
| GO:000641729 | Skin | cSCC | regulation of translation | 226/4864 | 468/18723 | 8.78e-26 | 2.62e-23 | 226 |
| Page: 1 2 3 4 5 6 7 8 |
| Pathway ID | Tissue | Disease Stage | Description | Gene Ratio | Bg Ratio | pvalue | p.adjust | qvalue | Count |
| Page: 1 |
Top |
Cell-cell communication analysis |
| Identification of potential cell-cell interactions between two cell types and their ligand-receptor pairs for different disease states |
| Ligand | Receptor | LRpair | Pathway | Tissue | Disease Stage |
| Page: 1 |
Top |
Single-cell gene regulatory network inference analysis |
| Find out the significant the regulons (TFs) and the target genes of each regulon across cell types for different disease states |
| TF | Cell Type | Tissue | Disease Stage | Target Gene | RSS | Regulon Activity |
| ∗The dot plots of a searched regulon are shown for all cell subpopulations in each disease state of each tissue based on the regulon specific score inferred using pySCENIC and by calculating the average expression. |
| Page: 1 |
Top |
Somatic mutation of malignant transformation related genes |
| Annotation of somatic variants for genes involved in malignant transformation |
| Hugo Symbol | Variant Class | Variant Classification | dbSNP RS | HGVSc | HGVSp | HGVSp Short | SWISSPROT | BIOTYPE | SIFT | PolyPhen | Tumor Sample Barcode | Tissue | Histology | Sex | Age | Stage | Therapy Types | Drugs | Outcome |
| EIF4H | SNV | Missense_Mutation | c.307N>T | p.Gly103Cys | p.G103C | Q15056 | protein_coding | deleterious(0) | probably_damaging(0.998) | TCGA-AN-A0AK-01 | Breast | breast invasive carcinoma | Female | >=65 | I/II | Unknown | Unknown | SD | |
| EIF4H | deletion | In_Frame_Del | novel | c.3_5delNNN | p.Ala2del | p.A2del | Q15056 | protein_coding | TCGA-AC-A23C-01 | Breast | breast invasive carcinoma | Female | <65 | I/II | Chemotherapy | chemo | CR | ||
| EIF4H | SNV | Missense_Mutation | novel | c.211C>T | p.Arg71Trp | p.R71W | Q15056 | protein_coding | tolerated(0.06) | probably_damaging(1) | TCGA-EA-A3HS-01 | Cervix | cervical & endocervical cancer | Female | <65 | I/II | Unknown | Unknown | SD |
| EIF4H | SNV | Missense_Mutation | novel | c.25G>C | p.Asp9His | p.D9H | Q15056 | protein_coding | deleterious_low_confidence(0.01) | possibly_damaging(0.839) | TCGA-AA-3950-01 | Colorectum | colon adenocarcinoma | Female | >=65 | I/II | Unknown | Unknown | SD |
| EIF4H | SNV | Missense_Mutation | c.232N>G | p.Thr78Ala | p.T78A | Q15056 | protein_coding | deleterious(0) | possibly_damaging(0.711) | TCGA-CA-5254-01 | Colorectum | colon adenocarcinoma | Female | <65 | I/II | Chemotherapy | oxaliplatin | CR | |
| EIF4H | SNV | Missense_Mutation | novel | c.212N>A | p.Arg71Gln | p.R71Q | Q15056 | protein_coding | deleterious(0) | probably_damaging(0.996) | TCGA-CM-4750-01 | Colorectum | colon adenocarcinoma | Female | <65 | III/IV | Chemotherapy | fluorouracil | SD |
| EIF4H | SNV | Missense_Mutation | c.164A>G | p.Gln55Arg | p.Q55R | Q15056 | protein_coding | deleterious(0.05) | possibly_damaging(0.656) | TCGA-G4-6588-01 | Colorectum | colon adenocarcinoma | Female | <65 | I/II | Unknown | Unknown | SD | |
| EIF4H | SNV | Missense_Mutation | novel | c.647G>A | p.Arg216Gln | p.R216Q | Q15056 | protein_coding | deleterious(0) | benign(0.441) | TCGA-F5-6814-01 | Colorectum | rectum adenocarcinoma | Male | <65 | I/II | Unknown | Unknown | SD |
| EIF4H | SNV | Missense_Mutation | novel | c.467C>A | p.Ser156Tyr | p.S156Y | Q15056 | protein_coding | deleterious(0.02) | possibly_damaging(0.601) | TCGA-A5-A0G2-01 | Endometrium | uterine corpus endometrioid carcinoma | Female | <65 | III/IV | Unknown | Unknown | SD |
| EIF4H | SNV | Missense_Mutation | novel | c.92N>A | p.Arg31His | p.R31H | Q15056 | protein_coding | deleterious(0) | probably_damaging(0.98) | TCGA-AP-A1DK-01 | Endometrium | uterine corpus endometrioid carcinoma | Female | <65 | I/II | Unknown | Unknown | SD |
| Page: 1 2 3 |
Top |
Related drugs of malignant transformation related genes |
| Identification of chemicals and drugs interact with genes involved in malignant transfromation |
| (DGIdb 4.0) |
| Entrez ID | Symbol | Category | Interaction Types | Drug Claim Name | Drug Name | PMIDs |
| 7458 | EIF4H | DRUGGABLE GENOME | GNF-PF-4618 | CHEMBL585964 |
| Page: 1 |

Copyright 2023-Present -The University of Texas Health Science Center at Houston |