
|
|||||
|
 | |
| |
| |
| |
| |
| |
|
Gene: EIF2B4 |
Gene summary for EIF2B4 |
| Gene information | Species | Human | Gene symbol | EIF2B4 | Gene ID | 8890 |
| Gene name | eukaryotic translation initiation factor 2B subunit delta | |
| Gene Alias | EIF-2B | |
| Cytomap | 2p23.3 | |
| Gene Type | protein-coding | GO ID | GO:0000003 | UniProtAcc | Q9UI10 |
Top |
Malignant transformation analysis |
| Identification of the aberrant gene expression in precancerous and cancerous lesions by comparing the gene expression of stem-like cells in diseased tissues with normal stem cells |
| Entrez ID | Symbol | Replicates | Species | Organ | Tissue | Adj P-value | Log2FC | Malignancy |
| 8890 | EIF2B4 | LZE2T | Human | Esophagus | ESCC | 8.09e-03 | 3.05e-01 | 0.082 |
| 8890 | EIF2B4 | LZE4T | Human | Esophagus | ESCC | 6.57e-04 | 2.44e-01 | 0.0811 |
| 8890 | EIF2B4 | LZE7T | Human | Esophagus | ESCC | 2.50e-02 | 1.57e-01 | 0.0667 |
| 8890 | EIF2B4 | LZE8T | Human | Esophagus | ESCC | 1.67e-03 | 5.71e-02 | 0.067 |
| 8890 | EIF2B4 | LZE22T | Human | Esophagus | ESCC | 4.06e-02 | 1.98e-01 | 0.068 |
| 8890 | EIF2B4 | LZE24T | Human | Esophagus | ESCC | 4.98e-08 | 2.32e-01 | 0.0596 |
| 8890 | EIF2B4 | P1T-E | Human | Esophagus | ESCC | 2.22e-04 | 2.38e-01 | 0.0875 |
| 8890 | EIF2B4 | P2T-E | Human | Esophagus | ESCC | 1.71e-32 | 5.21e-01 | 0.1177 |
| 8890 | EIF2B4 | P4T-E | Human | Esophagus | ESCC | 9.26e-21 | 4.24e-01 | 0.1323 |
| 8890 | EIF2B4 | P5T-E | Human | Esophagus | ESCC | 2.06e-15 | 1.90e-01 | 0.1327 |
| 8890 | EIF2B4 | P8T-E | Human | Esophagus | ESCC | 2.80e-15 | 1.67e-01 | 0.0889 |
| 8890 | EIF2B4 | P9T-E | Human | Esophagus | ESCC | 4.99e-08 | 1.43e-01 | 0.1131 |
| 8890 | EIF2B4 | P10T-E | Human | Esophagus | ESCC | 1.90e-25 | 2.63e-01 | 0.116 |
| 8890 | EIF2B4 | P11T-E | Human | Esophagus | ESCC | 1.45e-11 | 4.63e-01 | 0.1426 |
| 8890 | EIF2B4 | P12T-E | Human | Esophagus | ESCC | 3.78e-28 | 5.14e-01 | 0.1122 |
| 8890 | EIF2B4 | P15T-E | Human | Esophagus | ESCC | 8.49e-16 | 3.29e-01 | 0.1149 |
| 8890 | EIF2B4 | P16T-E | Human | Esophagus | ESCC | 2.45e-18 | 2.96e-01 | 0.1153 |
| 8890 | EIF2B4 | P17T-E | Human | Esophagus | ESCC | 2.59e-02 | 1.90e-01 | 0.1278 |
| 8890 | EIF2B4 | P19T-E | Human | Esophagus | ESCC | 1.84e-04 | 6.35e-01 | 0.1662 |
| 8890 | EIF2B4 | P20T-E | Human | Esophagus | ESCC | 2.13e-16 | 3.02e-01 | 0.1124 |
| Page: 1 2 3 4 5 6 |
| Tissue | Expression Dynamics | Abbreviation |
| Esophagus |  | ESCC: Esophageal squamous cell carcinoma |
| HGIN: High-grade intraepithelial neoplasias | ||
| LGIN: Low-grade intraepithelial neoplasias | ||
| Liver | 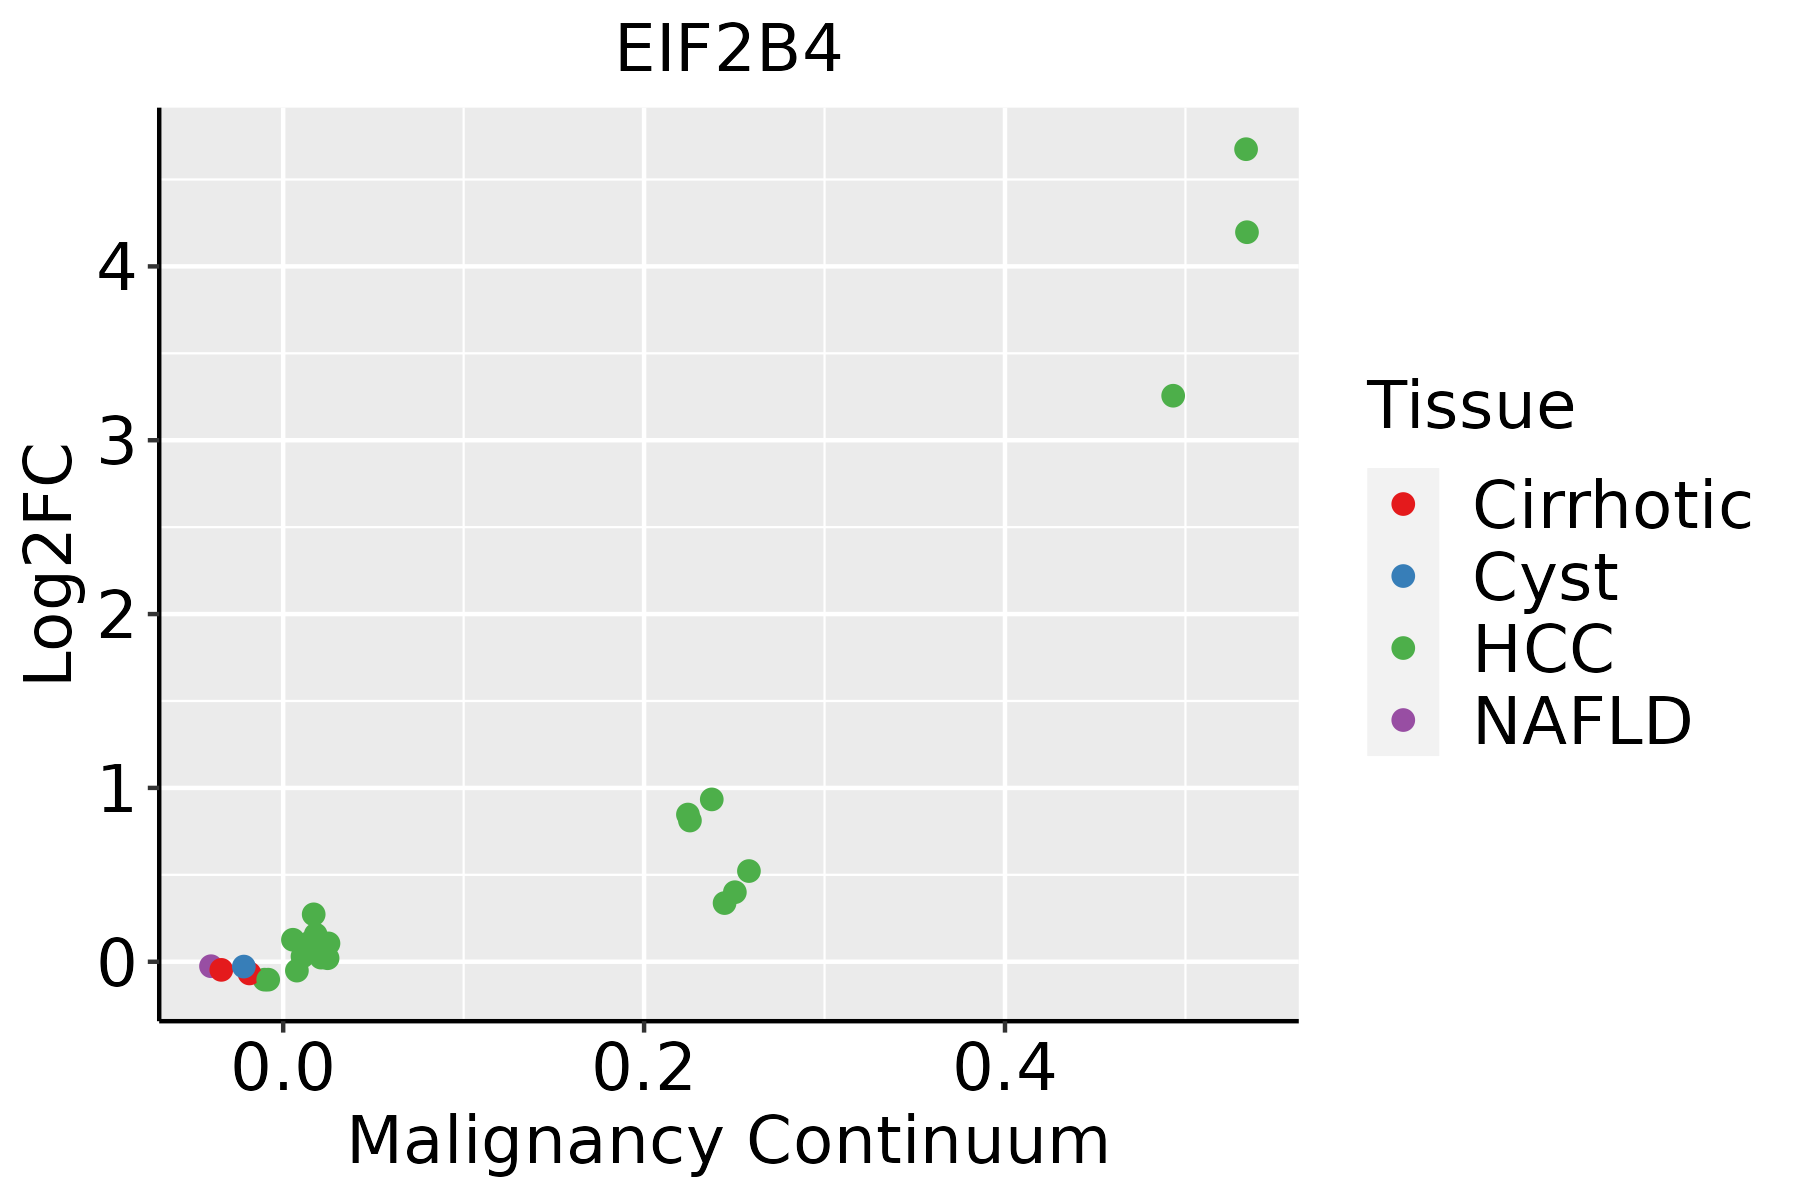 | HCC: Hepatocellular carcinoma |
| NAFLD: Non-alcoholic fatty liver disease | ||
| Oral Cavity | 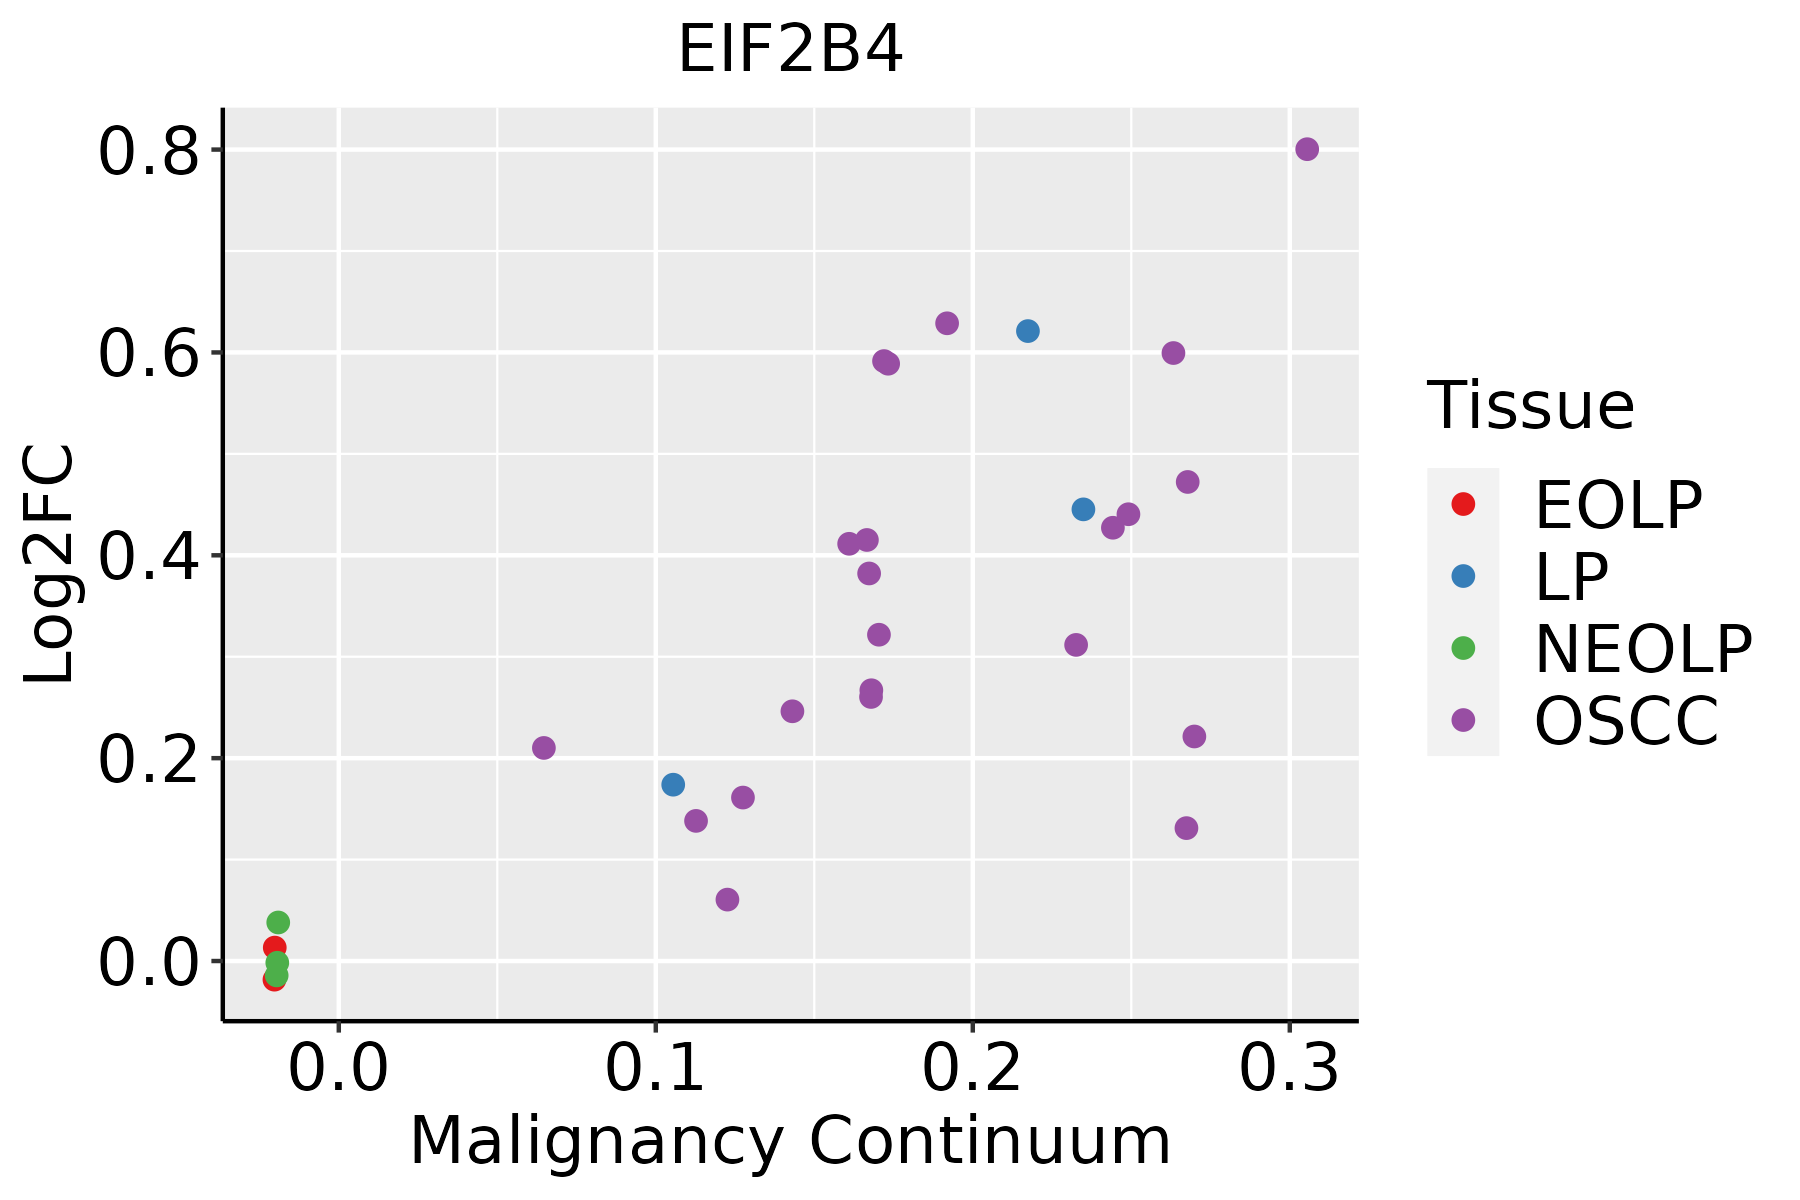 | EOLP: Erosive Oral lichen planus |
| LP: leukoplakia | ||
| NEOLP: Non-erosive oral lichen planus | ||
| OSCC: Oral squamous cell carcinoma | ||
| Prostate | 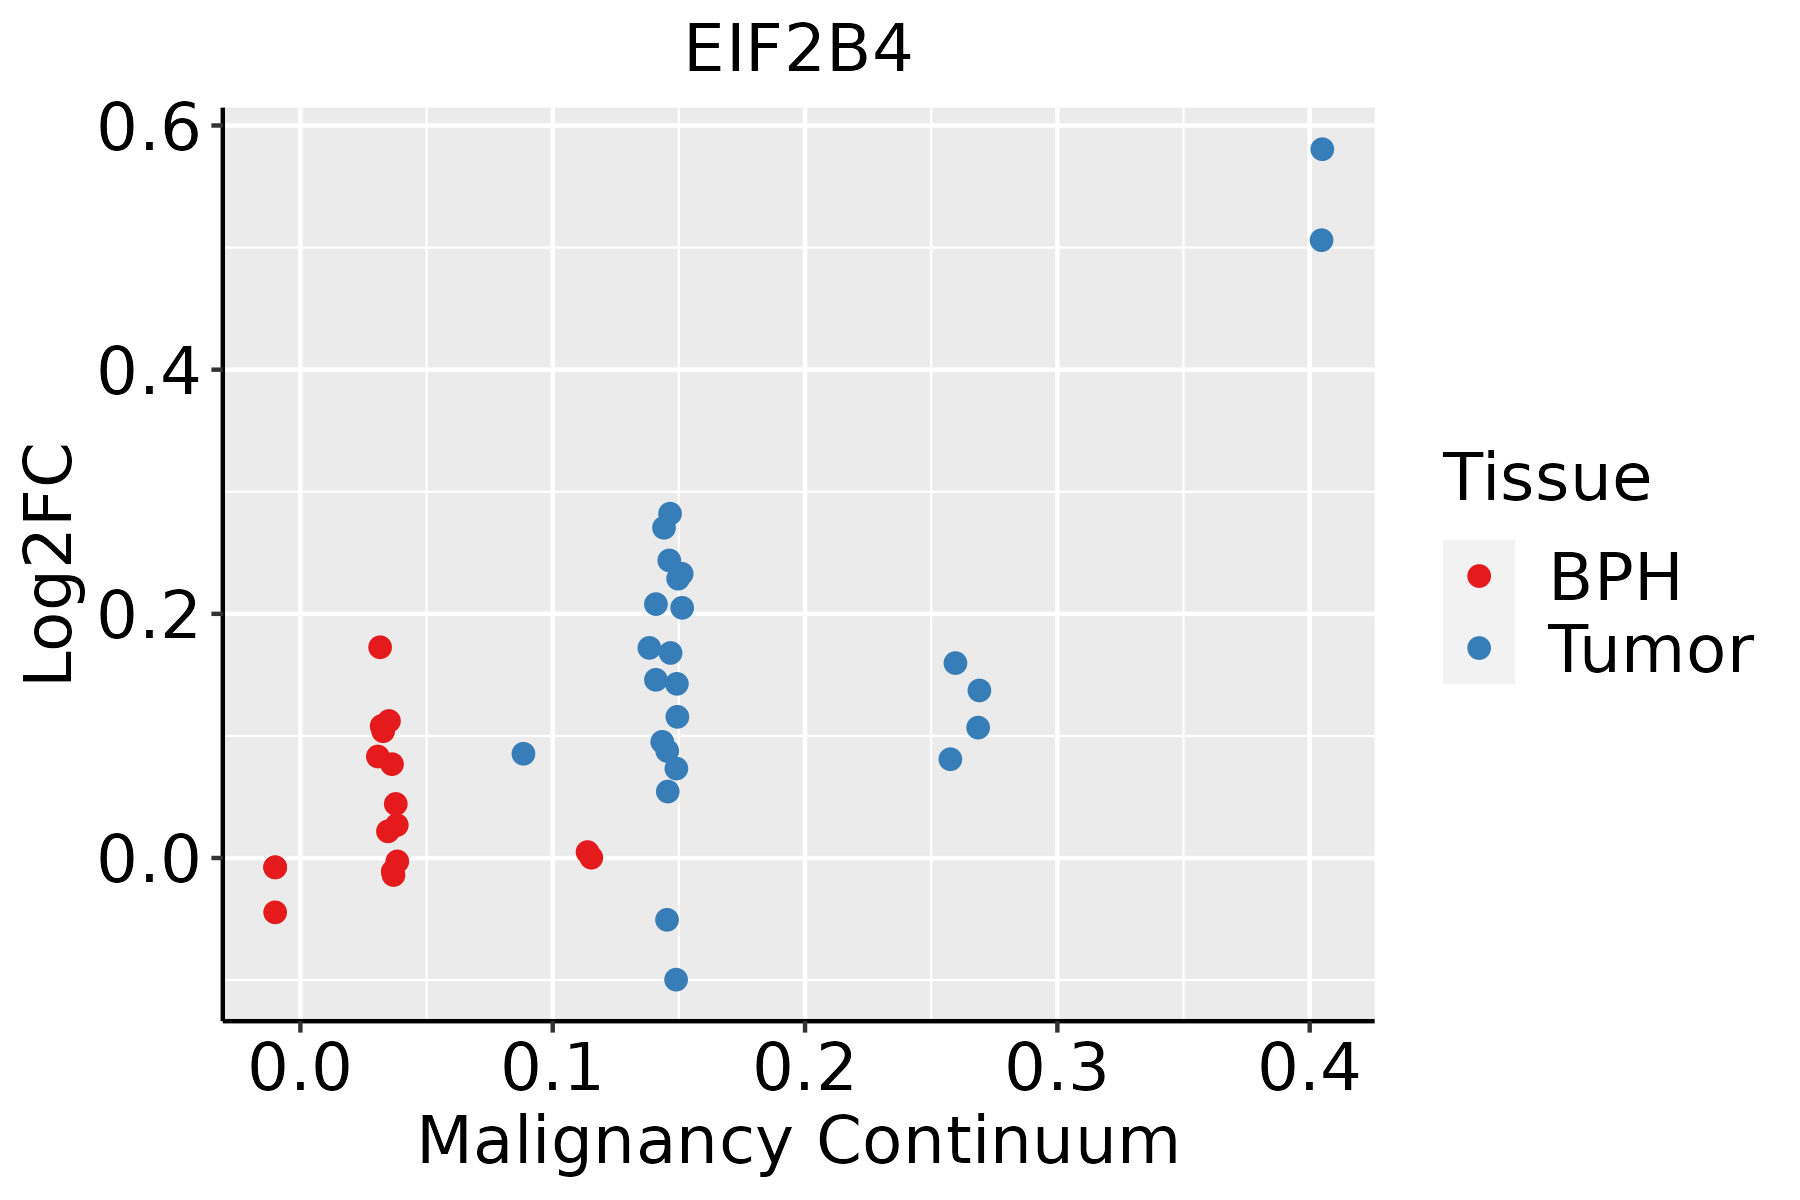 | BPH: Benign Prostatic Hyperplasia |
| Skin | 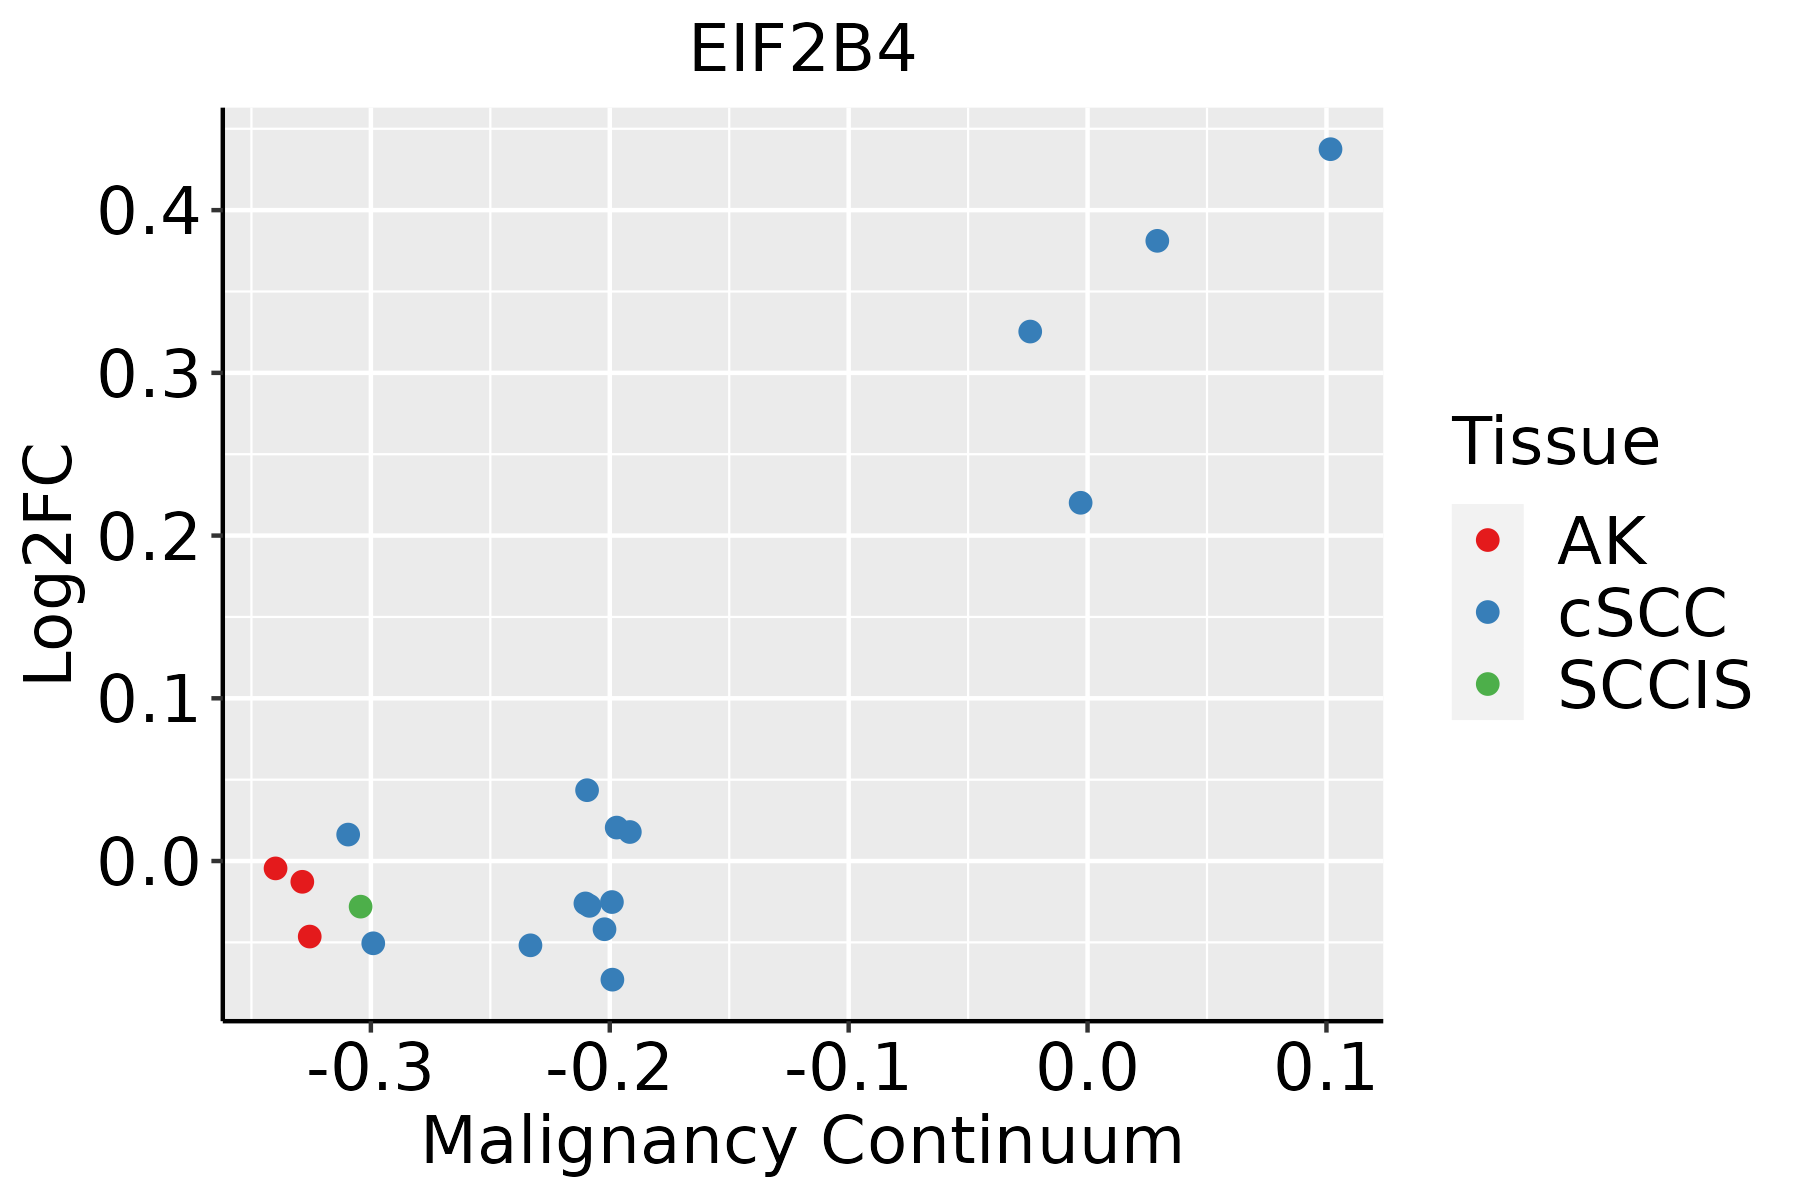 | AK: Actinic keratosis |
| cSCC: Cutaneous squamous cell carcinoma | ||
| SCCIS:squamous cell carcinoma in situ | ||
| Thyroid |  | ATC: Anaplastic thyroid cancer |
| HT: Hashimoto's thyroiditis | ||
| PTC: Papillary thyroid cancer |
| ∗log2FC in expression of this searched gene in stem-like cells from each diseased tissue sample relative to stem-like cells in normal samples in each tissue plotted against the malignancy continuum. Samples are colored based on if they are from different disease stage. |
Top |
Malignant transformation related pathway analysis |
| Find out the enriched GO biological processes and KEGG pathways involved in transition from healthy to precancer to cancer |
| Tissue | Disease Stage | Enriched GO biological Processes |
| Colorectum | AD |  |
| Colorectum | SER |  |
| Colorectum | MSS |  |
| Colorectum | MSI-H |  |
| Colorectum | FAP |  |
| ∗Top 15 enriched GO BP terms are showed in the bar plot of each disease state in each tissue. Each row represents a significant GO biological process which is colored according to the -log10(p.adjust). |
| Page: 1 2 3 4 5 6 7 8 9 |
| GO ID | Tissue | Disease Stage | Description | Gene Ratio | Bg Ratio | pvalue | p.adjust | Count |
| GO:0006417113 | Thyroid | PTC | regulation of translation | 236/5968 | 468/18723 | 2.70e-17 | 2.52e-15 | 236 |
| GO:0043434113 | Thyroid | PTC | response to peptide hormone | 188/5968 | 414/18723 | 4.13e-09 | 1.09e-07 | 188 |
| GO:0009408112 | Thyroid | PTC | response to heat | 58/5968 | 110/18723 | 4.48e-06 | 5.52e-05 | 58 |
| GO:0009743113 | Thyroid | PTC | response to carbohydrate | 111/5968 | 253/18723 | 3.77e-05 | 3.48e-04 | 111 |
| GO:0034284112 | Thyroid | PTC | response to monosaccharide | 99/5968 | 225/18723 | 8.42e-05 | 7.03e-04 | 99 |
| GO:0061458112 | Thyroid | PTC | reproductive system development | 173/5968 | 427/18723 | 8.70e-05 | 7.23e-04 | 173 |
| GO:0009266111 | Thyroid | PTC | response to temperature stimulus | 81/5968 | 178/18723 | 9.20e-05 | 7.63e-04 | 81 |
| GO:0048608111 | Thyroid | PTC | reproductive structure development | 170/5968 | 424/18723 | 1.86e-04 | 1.41e-03 | 170 |
| GO:0009746112 | Thyroid | PTC | response to hexose | 94/5968 | 219/18723 | 3.62e-04 | 2.45e-03 | 94 |
| GO:0009749111 | Thyroid | PTC | response to glucose | 91/5968 | 212/18723 | 4.44e-04 | 2.95e-03 | 91 |
| GO:004206315 | Thyroid | PTC | gliogenesis | 121/5968 | 301/18723 | 1.30e-03 | 7.41e-03 | 121 |
| GO:005085210 | Thyroid | PTC | T cell receptor signaling pathway | 52/5968 | 123/18723 | 9.58e-03 | 3.93e-02 | 52 |
| GO:000641334 | Thyroid | ATC | translational initiation | 83/6293 | 118/18723 | 3.44e-16 | 2.88e-14 | 83 |
| GO:000641735 | Thyroid | ATC | regulation of translation | 236/6293 | 468/18723 | 2.39e-14 | 1.34e-12 | 236 |
| GO:004343428 | Thyroid | ATC | response to peptide hormone | 192/6293 | 414/18723 | 3.63e-08 | 6.70e-07 | 192 |
| GO:006145827 | Thyroid | ATC | reproductive system development | 193/6293 | 427/18723 | 3.32e-07 | 4.92e-06 | 193 |
| GO:004860825 | Thyroid | ATC | reproductive structure development | 190/6293 | 424/18723 | 8.40e-07 | 1.11e-05 | 190 |
| GO:000940832 | Thyroid | ATC | response to heat | 60/6293 | 110/18723 | 4.89e-06 | 5.32e-05 | 60 |
| GO:000974333 | Thyroid | ATC | response to carbohydrate | 114/6293 | 253/18723 | 9.26e-05 | 6.81e-04 | 114 |
| GO:000926632 | Thyroid | ATC | response to temperature stimulus | 83/6293 | 178/18723 | 2.03e-04 | 1.35e-03 | 83 |
| Page: 1 2 3 4 5 6 7 |
| Pathway ID | Tissue | Disease Stage | Description | Gene Ratio | Bg Ratio | pvalue | p.adjust | qvalue | Count |
| Page: 1 |
Top |
Cell-cell communication analysis |
| Identification of potential cell-cell interactions between two cell types and their ligand-receptor pairs for different disease states |
| Ligand | Receptor | LRpair | Pathway | Tissue | Disease Stage |
| Page: 1 |
Top |
Single-cell gene regulatory network inference analysis |
| Find out the significant the regulons (TFs) and the target genes of each regulon across cell types for different disease states |
| TF | Cell Type | Tissue | Disease Stage | Target Gene | RSS | Regulon Activity |
| ∗The dot plots of a searched regulon are shown for all cell subpopulations in each disease state of each tissue based on the regulon specific score inferred using pySCENIC and by calculating the average expression. |
| Page: 1 |
Top |
Somatic mutation of malignant transformation related genes |
| Annotation of somatic variants for genes involved in malignant transformation |
| Hugo Symbol | Variant Class | Variant Classification | dbSNP RS | HGVSc | HGVSp | HGVSp Short | SWISSPROT | BIOTYPE | SIFT | PolyPhen | Tumor Sample Barcode | Tissue | Histology | Sex | Age | Stage | Therapy Types | Drugs | Outcome |
| EIF2B4 | SNV | Missense_Mutation | novel | c.996G>C | p.Lys332Asn | p.K332N | protein_coding | deleterious(0.03) | benign(0.261) | TCGA-AN-A0FS-01 | Breast | breast invasive carcinoma | Female | <65 | I/II | Unknown | Unknown | SD | |
| EIF2B4 | SNV | Missense_Mutation | c.226N>C | p.Gly76Arg | p.G76R | protein_coding | deleterious(0.03) | possibly_damaging(0.652) | TCGA-BH-A2L8-01 | Breast | breast invasive carcinoma | Female | <65 | I/II | Chemotherapy | cytoxan | CR | ||
| EIF2B4 | SNV | Missense_Mutation | c.452N>C | p.Ser151Thr | p.S151T | protein_coding | tolerated(0.62) | benign(0.018) | TCGA-C8-A26Y-01 | Breast | breast invasive carcinoma | Female | >=65 | I/II | Unknown | Unknown | SD | ||
| EIF2B4 | SNV | Missense_Mutation | novel | c.607C>T | p.His203Tyr | p.H203Y | protein_coding | deleterious(0) | probably_damaging(0.999) | TCGA-D8-A27V-01 | Breast | breast invasive carcinoma | Female | <65 | I/II | Hormone Therapy | tamoxiphen | SD | |
| EIF2B4 | SNV | Missense_Mutation | c.192N>C | p.Lys64Asn | p.K64N | protein_coding | deleterious(0) | benign(0.343) | TCGA-BI-A0VS-01 | Cervix | cervical & endocervical cancer | Female | <65 | I/II | Unknown | Unknown | SD | ||
| EIF2B4 | SNV | Missense_Mutation | c.925G>T | p.Gly309Cys | p.G309C | protein_coding | deleterious(0) | possibly_damaging(0.489) | TCGA-AA-3663-01 | Colorectum | colon adenocarcinoma | Male | <65 | I/II | Unknown | Unknown | SD | ||
| EIF2B4 | SNV | Missense_Mutation | c.572N>A | p.Arg191Gln | p.R191Q | protein_coding | tolerated(0.44) | benign(0.406) | TCGA-AA-A01P-01 | Colorectum | colon adenocarcinoma | Female | >=65 | III/IV | Unknown | Unknown | PD | ||
| EIF2B4 | SNV | Missense_Mutation | c.1478N>T | p.Ala493Val | p.A493V | protein_coding | tolerated(0.64) | benign(0.001) | TCGA-CK-4951-01 | Colorectum | colon adenocarcinoma | Female | >=65 | I/II | Unknown | Unknown | PD | ||
| EIF2B4 | SNV | Missense_Mutation | c.694N>T | p.Gly232Cys | p.G232C | protein_coding | deleterious(0) | probably_damaging(0.999) | TCGA-CM-5861-01 | Colorectum | colon adenocarcinoma | Female | <65 | I/II | Unknown | Unknown | PD | ||
| EIF2B4 | SNV | Missense_Mutation | c.1263N>T | p.Lys421Asn | p.K421N | protein_coding | deleterious(0) | probably_damaging(0.995) | TCGA-A5-A0G1-01 | Endometrium | uterine corpus endometrioid carcinoma | Female | >=65 | I/II | Unknown | Unknown | SD |
| Page: 1 2 3 4 |
Top |
Related drugs of malignant transformation related genes |
| Identification of chemicals and drugs interact with genes involved in malignant transfromation |
| (DGIdb 4.0) |
| Entrez ID | Symbol | Category | Interaction Types | Drug Claim Name | Drug Name | PMIDs |
| Page: 1 |

Copyright 2023-Present -The University of Texas Health Science Center at Houston |