
|
|||||
|
 | |
| |
| |
| |
| |
| |
|
Gene: EBF1 |
Gene summary for EBF1 |
| Gene information | Species | Human | Gene symbol | EBF1 | Gene ID | 1879 |
| Gene name | EBF transcription factor 1 | |
| Gene Alias | COE1 | |
| Cytomap | 5q33.3 | |
| Gene Type | protein-coding | GO ID | GO:0006139 | UniProtAcc | B4E2U8 |
Top |
Malignant transformation analysis |
| Identification of the aberrant gene expression in precancerous and cancerous lesions by comparing the gene expression of stem-like cells in diseased tissues with normal stem cells |
| Entrez ID | Symbol | Replicates | Species | Organ | Tissue | Adj P-value | Log2FC | Malignancy |
| 1879 | EBF1 | C04 | Human | Oral cavity | OSCC | 3.73e-02 | -4.12e-01 | 0.2633 |
| 1879 | EBF1 | C21 | Human | Oral cavity | OSCC | 6.42e-04 | -4.01e-01 | 0.2678 |
| 1879 | EBF1 | C43 | Human | Oral cavity | OSCC | 3.71e-12 | -4.12e-01 | 0.1704 |
| 1879 | EBF1 | C46 | Human | Oral cavity | OSCC | 1.62e-10 | -4.12e-01 | 0.1673 |
| 1879 | EBF1 | C57 | Human | Oral cavity | OSCC | 5.36e-05 | -4.03e-01 | 0.1679 |
| 1879 | EBF1 | C08 | Human | Oral cavity | OSCC | 4.32e-10 | -3.99e-01 | 0.1919 |
| 1879 | EBF1 | C09 | Human | Oral cavity | OSCC | 9.41e-06 | -4.04e-01 | 0.1431 |
| 1879 | EBF1 | LN46 | Human | Oral cavity | OSCC | 2.36e-02 | -3.99e-01 | 0.1666 |
| 1879 | EBF1 | EOLP-1 | Human | Oral cavity | EOLP | 1.62e-15 | 6.89e-01 | -0.0202 |
| 1879 | EBF1 | EOLP-2 | Human | Oral cavity | EOLP | 1.49e-02 | 4.30e-01 | -0.0203 |
| 1879 | EBF1 | NEOLP-1 | Human | Oral cavity | NEOLP | 1.65e-11 | 6.74e-01 | -0.0194 |
| 1879 | EBF1 | NEOLP-2 | Human | Oral cavity | NEOLP | 2.75e-18 | 7.46e-01 | -0.0196 |
| 1879 | EBF1 | NEOLP-3 | Human | Oral cavity | NEOLP | 5.72e-17 | 7.36e-01 | -0.0191 |
| 1879 | EBF1 | SYSMH1 | Human | Oral cavity | OSCC | 3.09e-14 | -4.11e-01 | 0.1127 |
| 1879 | EBF1 | SYSMH2 | Human | Oral cavity | OSCC | 1.51e-11 | -4.06e-01 | 0.2326 |
| 1879 | EBF1 | SYSMH3 | Human | Oral cavity | OSCC | 3.10e-12 | -4.07e-01 | 0.2442 |
| 1879 | EBF1 | SYSMH4 | Human | Oral cavity | OSCC | 6.89e-14 | -4.12e-01 | 0.1226 |
| 1879 | EBF1 | SYSMH5 | Human | Oral cavity | OSCC | 1.05e-10 | -4.09e-01 | 0.0647 |
| 1879 | EBF1 | SYSMH6 | Human | Oral cavity | OSCC | 2.82e-10 | -4.06e-01 | 0.1275 |
| 1879 | EBF1 | ATC12 | Human | Thyroid | ATC | 3.28e-16 | 3.42e-01 | 0.34 |
| Page: 1 2 |
| Tissue | Expression Dynamics | Abbreviation |
| Oral Cavity |  | EOLP: Erosive Oral lichen planus |
| LP: leukoplakia | ||
| NEOLP: Non-erosive oral lichen planus | ||
| OSCC: Oral squamous cell carcinoma | ||
| Thyroid | 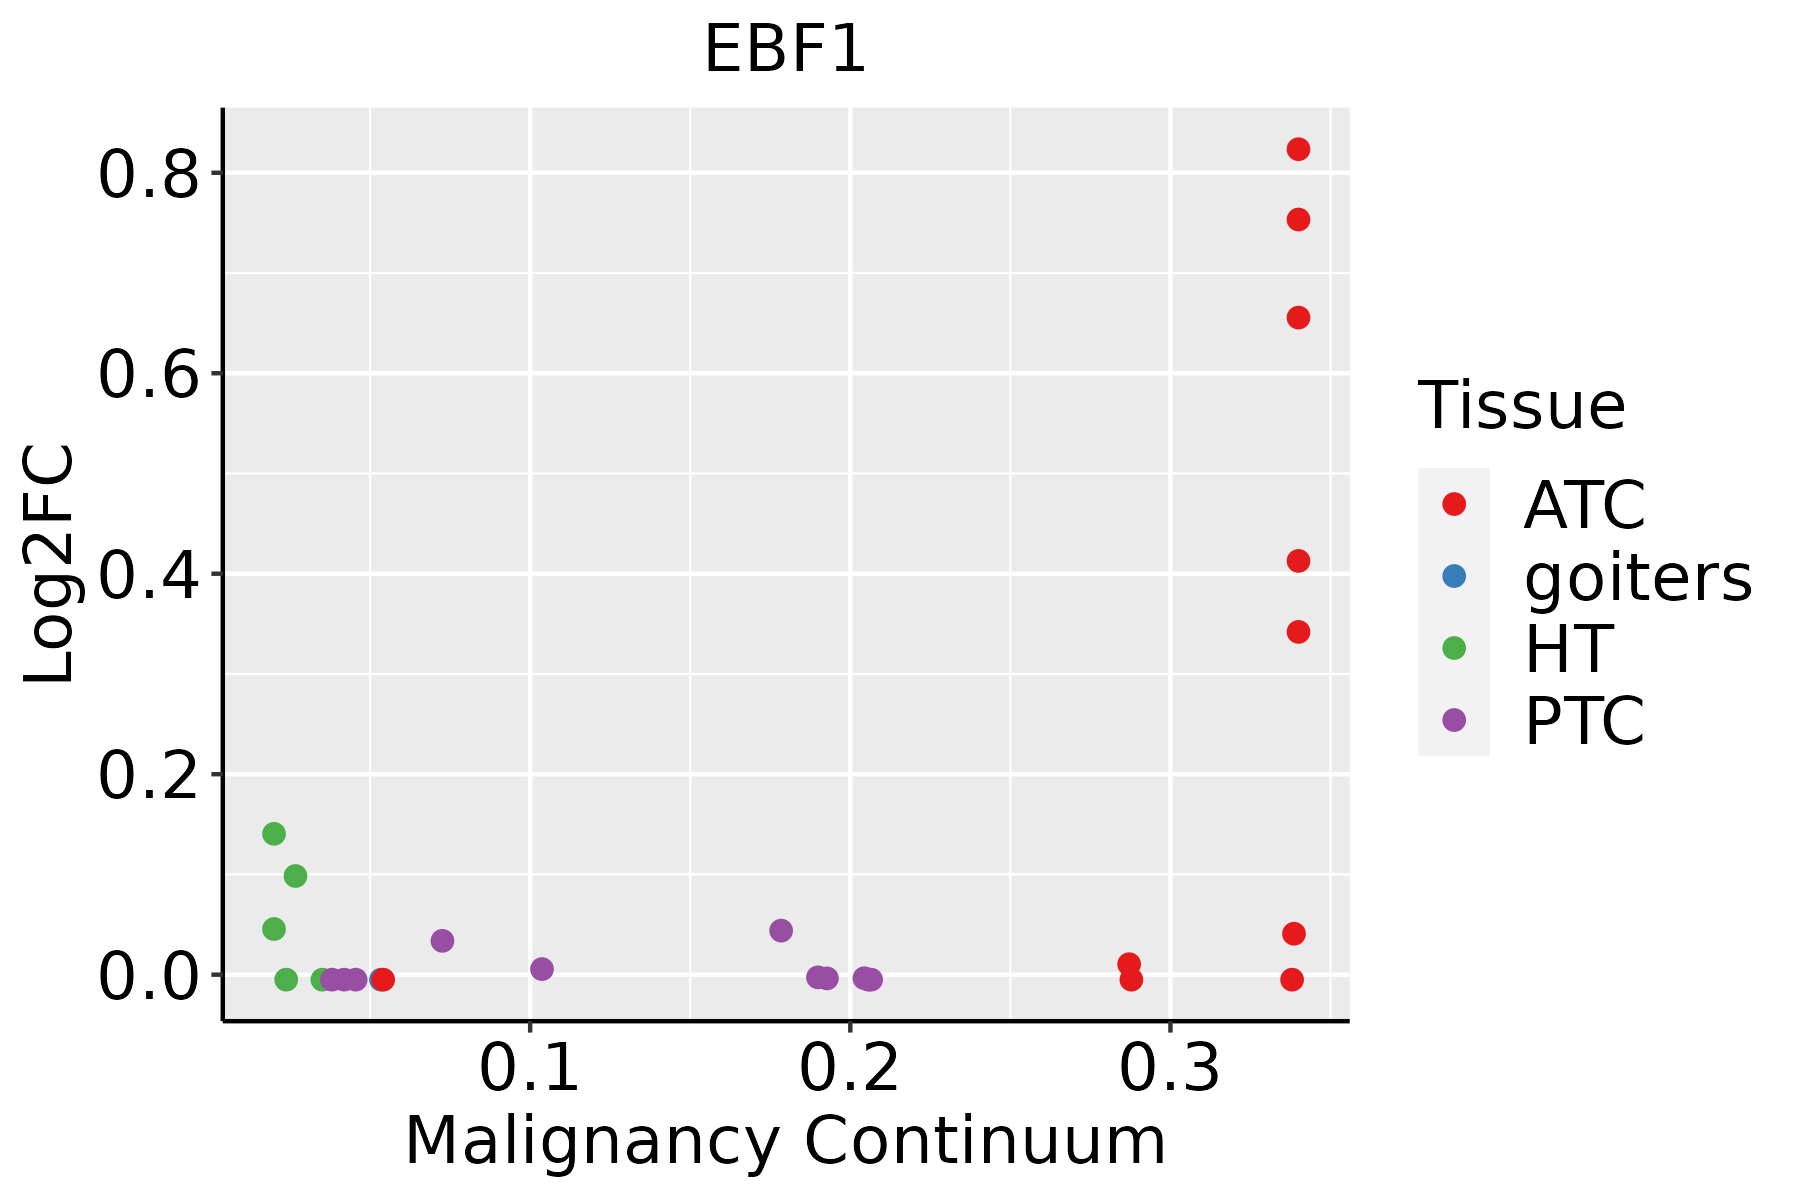 | ATC: Anaplastic thyroid cancer |
| HT: Hashimoto's thyroiditis | ||
| PTC: Papillary thyroid cancer |
| ∗log2FC in expression of this searched gene in stem-like cells from each diseased tissue sample relative to stem-like cells in normal samples in each tissue plotted against the malignancy continuum. Samples are colored based on if they are from different disease stage. |
Top |
Malignant transformation related pathway analysis |
| Find out the enriched GO biological processes and KEGG pathways involved in transition from healthy to precancer to cancer |
| Tissue | Disease Stage | Enriched GO biological Processes |
| Colorectum | AD |  |
| Colorectum | SER |  |
| Colorectum | MSS |  |
| Colorectum | MSI-H |  |
| Colorectum | FAP |  |
| ∗Top 15 enriched GO BP terms are showed in the bar plot of each disease state in each tissue. Each row represents a significant GO biological process which is colored according to the -log10(p.adjust). |
| Page: 1 2 3 4 5 6 7 8 9 |
| GO ID | Tissue | Disease Stage | Description | Gene Ratio | Bg Ratio | pvalue | p.adjust | Count |
| GO:002241113 | Breast | DCIS | cellular component disassembly | 48/1390 | 443/18723 | 5.35e-03 | 3.92e-02 | 48 |
| GO:006201213 | Breast | DCIS | regulation of small molecule metabolic process | 38/1390 | 334/18723 | 5.69e-03 | 4.10e-02 | 38 |
| GO:000926713 | Breast | DCIS | cellular response to starvation | 21/1390 | 156/18723 | 5.74e-03 | 4.13e-02 | 21 |
| GO:007169222 | Breast | DCIS | protein localization to extracellular region | 41/1390 | 368/18723 | 6.01e-03 | 4.29e-02 | 41 |
| GO:000930622 | Breast | DCIS | protein secretion | 40/1390 | 359/18723 | 6.59e-03 | 4.61e-02 | 40 |
| GO:003559222 | Breast | DCIS | establishment of protein localization to extracellular region | 40/1390 | 360/18723 | 6.90e-03 | 4.77e-02 | 40 |
| GO:00725949 | Cervix | CC | establishment of protein localization to organelle | 99/2311 | 422/18723 | 1.23e-10 | 2.11e-08 | 99 |
| GO:007149610 | Cervix | CC | cellular response to external stimulus | 78/2311 | 320/18723 | 1.82e-09 | 1.98e-07 | 78 |
| GO:00512359 | Cervix | CC | maintenance of location | 78/2311 | 327/18723 | 5.18e-09 | 4.92e-07 | 78 |
| GO:00075689 | Cervix | CC | aging | 75/2311 | 339/18723 | 2.75e-07 | 1.13e-05 | 75 |
| GO:00316689 | Cervix | CC | cellular response to extracellular stimulus | 59/2311 | 246/18723 | 3.03e-07 | 1.24e-05 | 59 |
| GO:00068399 | Cervix | CC | mitochondrial transport | 60/2311 | 254/18723 | 4.21e-07 | 1.67e-05 | 60 |
| GO:004854510 | Cervix | CC | response to steroid hormone | 74/2311 | 339/18723 | 5.71e-07 | 2.09e-05 | 74 |
| GO:00305229 | Cervix | CC | intracellular receptor signaling pathway | 60/2311 | 265/18723 | 1.89e-06 | 5.97e-05 | 60 |
| GO:000660510 | Cervix | CC | protein targeting | 68/2311 | 314/18723 | 2.17e-06 | 6.55e-05 | 68 |
| GO:00485118 | Cervix | CC | rhythmic process | 65/2311 | 298/18723 | 2.79e-06 | 8.04e-05 | 65 |
| GO:00323868 | Cervix | CC | regulation of intracellular transport | 71/2311 | 337/18723 | 3.70e-06 | 9.74e-05 | 71 |
| GO:00454445 | Cervix | CC | fat cell differentiation | 53/2311 | 229/18723 | 3.72e-06 | 9.75e-05 | 53 |
| GO:003166710 | Cervix | CC | response to nutrient levels | 92/2311 | 474/18723 | 5.80e-06 | 1.42e-04 | 92 |
| GO:00331579 | Cervix | CC | regulation of intracellular protein transport | 52/2311 | 229/18723 | 8.16e-06 | 1.88e-04 | 52 |
| Page: 1 2 3 4 5 6 7 8 9 10 11 12 13 14 15 16 17 18 19 20 21 22 23 24 25 26 27 28 29 30 31 32 33 34 35 36 37 38 39 40 41 42 |
| Pathway ID | Tissue | Disease Stage | Description | Gene Ratio | Bg Ratio | pvalue | p.adjust | qvalue | Count |
| Page: 1 |
Top |
Cell-cell communication analysis |
| Identification of potential cell-cell interactions between two cell types and their ligand-receptor pairs for different disease states |
| Ligand | Receptor | LRpair | Pathway | Tissue | Disease Stage |
| Page: 1 |
Top |
Single-cell gene regulatory network inference analysis |
| Find out the significant the regulons (TFs) and the target genes of each regulon across cell types for different disease states |
| TF | Cell Type | Tissue | Disease Stage | Target Gene | RSS | Regulon Activity |
| EBF1 | CFIB | Colorectum | ADJ | FBN1,DLC1,BCKDHB, etc. | 4.28e-01 |  |
| EBF1 | CFIB | Colorectum | Healthy | FBN1,DLC1,BCKDHB, etc. | 1.84e-01 |  |
| EBF1 | MALTB | Endometrium | ADJ | BANK1,PLEKHG1,TNFRSF13C, etc. | 6.48e-02 |  |
| EBF1 | MALTB | Endometrium | AEH | BANK1,PLEKHG1,TNFRSF13C, etc. | 1.87e-01 |  |
| EBF1 | MALTB | Endometrium | EEC | BANK1,PLEKHG1,TNFRSF13C, etc. | 1.49e-01 |  |
| EBF1 | MALTB | Endometrium | Healthy | BANK1,PLEKHG1,TNFRSF13C, etc. | 1.12e-01 |  |
| EBF1 | PERI | Esophagus | ESCC | CD248,FBN1,OLFML2A, etc. | 2.59e-01 |  |
| EBF1 | BN | Lung | AAH | BANK1,MS4A1,OSBPL10, etc. | 1.28e-01 |  |
| EBF1 | BN | Lung | MIAC | BANK1,MEF2C,AFF3, etc. | 2.51e-01 |  |
| EBF1 | MALTB | Lung | MIAC | BANK1,MEF2C,AFF3, etc. | 1.43e-01 | |
| ∗The dot plots of a searched regulon are shown for all cell subpopulations in each disease state of each tissue based on the regulon specific score inferred using pySCENIC and by calculating the average expression. |
| Page: 1 2 3 4 5 |
Top |
Somatic mutation of malignant transformation related genes |
| Annotation of somatic variants for genes involved in malignant transformation |
| Hugo Symbol | Variant Class | Variant Classification | dbSNP RS | HGVSc | HGVSp | HGVSp Short | SWISSPROT | BIOTYPE | SIFT | PolyPhen | Tumor Sample Barcode | Tissue | Histology | Sex | Age | Stage | Therapy Types | Drugs | Outcome |
| EBF1 | SNV | Missense_Mutation | c.1529N>G | p.Ala510Gly | p.A510G | Q9UH73 | protein_coding | tolerated_low_confidence(0.11) | benign(0.066) | TCGA-A2-A0YT-01 | Breast | breast invasive carcinoma | Female | <65 | III/IV | Hormone Therapy | arimidex | SD | |
| EBF1 | SNV | Missense_Mutation | c.1211N>T | p.Ala404Val | p.A404V | Q9UH73 | protein_coding | deleterious_low_confidence(0) | probably_damaging(0.948) | TCGA-A2-A3Y0-01 | Breast | breast invasive carcinoma | Female | <65 | I/II | Chemotherapy | adriamycin | CR | |
| EBF1 | SNV | Missense_Mutation | novel | c.1706N>A | p.Pro569His | p.P569H | Q9UH73 | protein_coding | deleterious_low_confidence(0.02) | probably_damaging(0.95) | TCGA-AN-A046-01 | Breast | breast invasive carcinoma | Female | >=65 | I/II | Unknown | Unknown | SD |
| EBF1 | SNV | Missense_Mutation | rs556574598 | c.1397N>T | p.Ser466Leu | p.S466L | Q9UH73 | protein_coding | deleterious_low_confidence(0.03) | possibly_damaging(0.52) | TCGA-BH-A28O-01 | Breast | breast invasive carcinoma | Female | <65 | III/IV | Chemotherapy | cytoxan | CR |
| EBF1 | SNV | Missense_Mutation | rs556574598 | c.1397N>T | p.Ser466Leu | p.S466L | Q9UH73 | protein_coding | deleterious_low_confidence(0.03) | possibly_damaging(0.52) | TCGA-EW-A1J5-01 | Breast | breast invasive carcinoma | Female | <65 | I/II | Chemotherapy | adriamycin | SD |
| EBF1 | insertion | Frame_Shift_Ins | novel | c.801_802insTGTT | p.Ser268CysfsTer2 | p.S268Cfs*2 | Q9UH73 | protein_coding | TCGA-AO-A0JJ-01 | Breast | breast invasive carcinoma | Female | <65 | I/II | Chemotherapy | cyclophospamide | SD | ||
| EBF1 | insertion | Frame_Shift_Ins | novel | c.800_801insTAGCAGTTGGGTACCTGGATGTAGGACTTTAAATTGGG | p.Pro269SerfsTer25 | p.P269Sfs*25 | Q9UH73 | protein_coding | TCGA-AO-A0JJ-01 | Breast | breast invasive carcinoma | Female | <65 | I/II | Chemotherapy | cyclophospamide | SD | ||
| EBF1 | SNV | Missense_Mutation | rs181351521 | c.1501G>A | p.Gly501Ser | p.G501S | Q9UH73 | protein_coding | tolerated_low_confidence(0.16) | benign(0.009) | TCGA-3L-AA1B-01 | Colorectum | colon adenocarcinoma | Female | <65 | I/II | Unknown | Unknown | SD |
| EBF1 | SNV | Missense_Mutation | c.802N>T | p.Ser268Cys | p.S268C | Q9UH73 | protein_coding | tolerated(0.17) | benign(0.228) | TCGA-A6-3809-01 | Colorectum | colon adenocarcinoma | Female | >=65 | I/II | Unknown | Unknown | SD | |
| EBF1 | SNV | Missense_Mutation | c.1055N>A | p.Ile352Asn | p.I352N | Q9UH73 | protein_coding | deleterious(0) | probably_damaging(0.978) | TCGA-A6-6780-01 | Colorectum | colon adenocarcinoma | Male | >=65 | I/II | Unknown | Unknown | SD |
| Page: 1 2 3 4 5 6 7 8 9 10 11 |
Top |
Related drugs of malignant transformation related genes |
| Identification of chemicals and drugs interact with genes involved in malignant transfromation |
| (DGIdb 4.0) |
| Entrez ID | Symbol | Category | Interaction Types | Drug Claim Name | Drug Name | PMIDs |
| Page: 1 |

Copyright 2023-Present -The University of Texas Health Science Center at Houston |