| Tissue | Expression Dynamics | Abbreviation |
| GC | 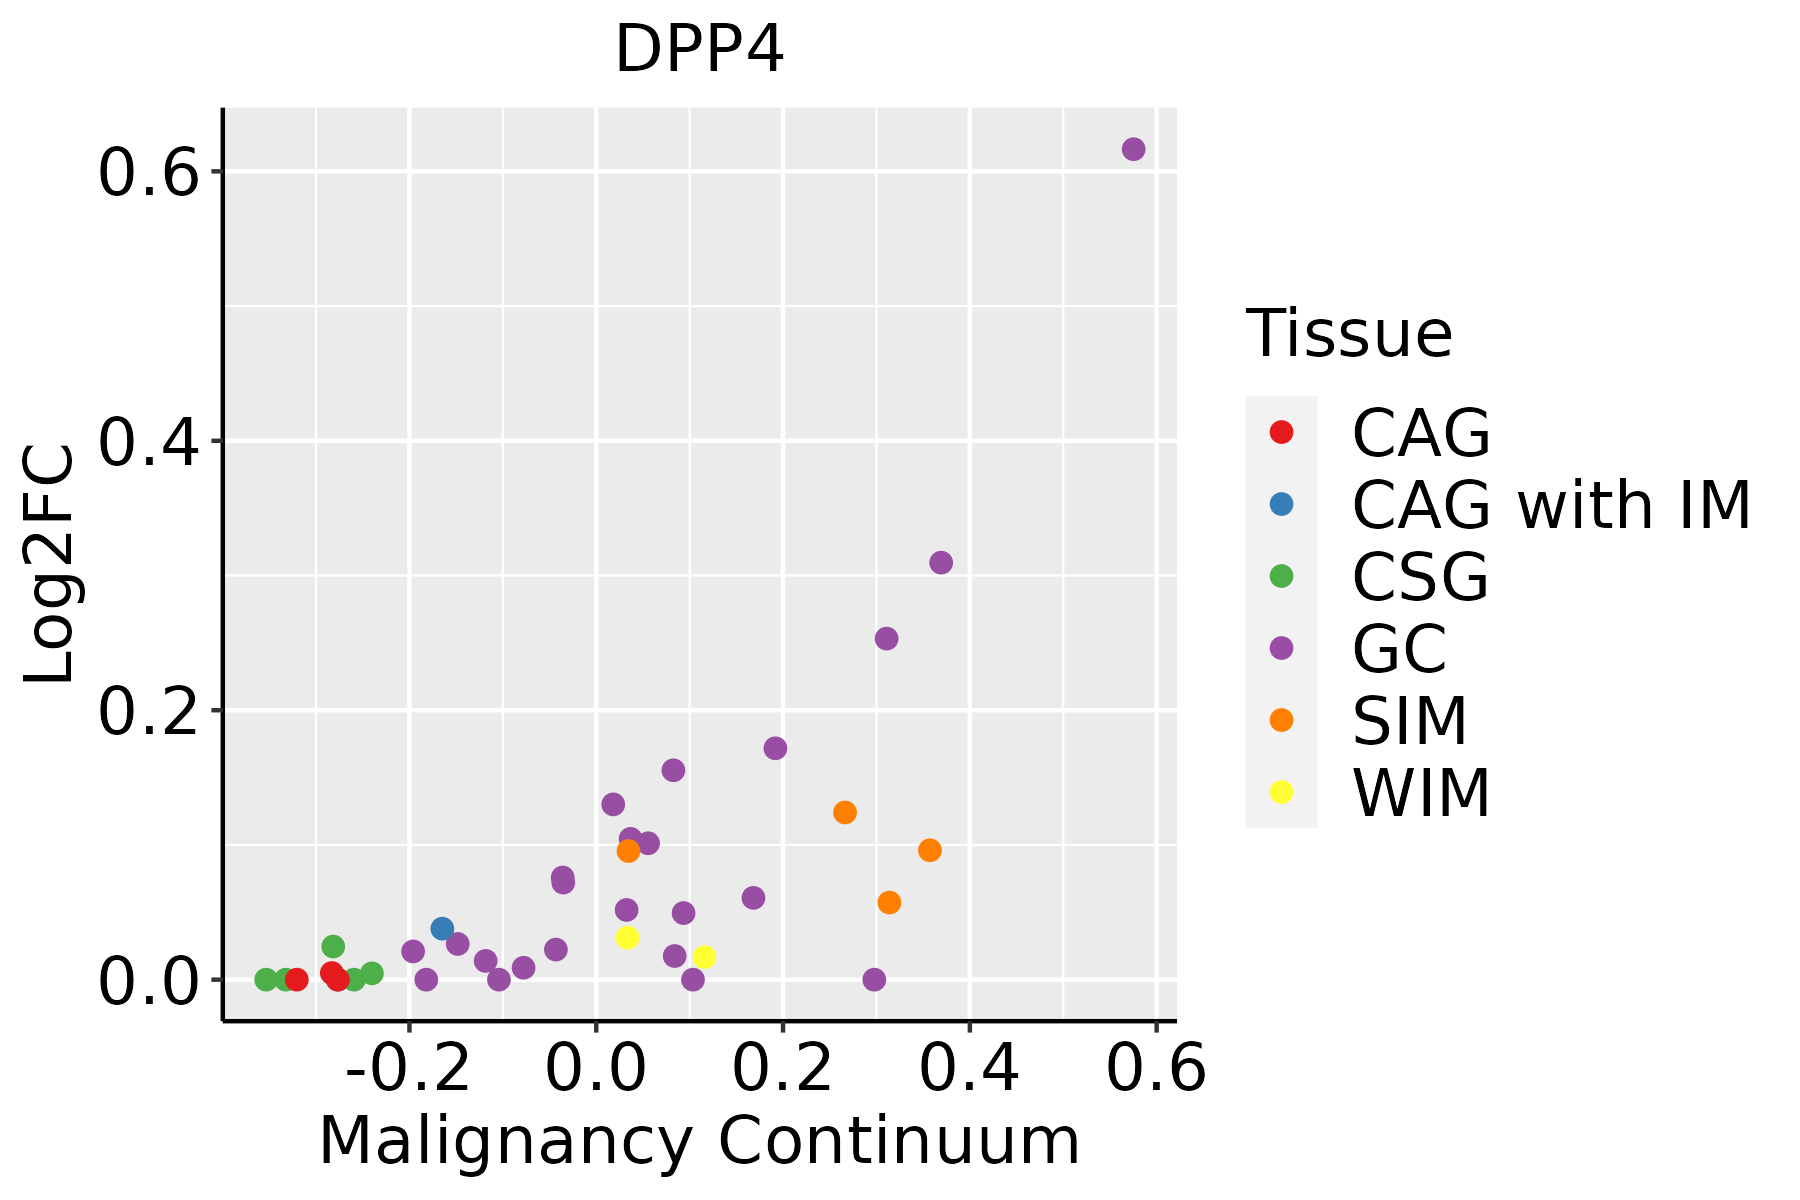 | CAG: Chronic atrophic gastritis |
| CAG with IM: Chronic atrophic gastritis with intestinal metaplasia |
| CSG: Chronic superficial gastritis |
| GC: Gastric cancer |
| SIM: Severe intestinal metaplasia |
| WIM: Wild intestinal metaplasia |
| Liver |  | HCC: Hepatocellular carcinoma |
| NAFLD: Non-alcoholic fatty liver disease |
| Lung | 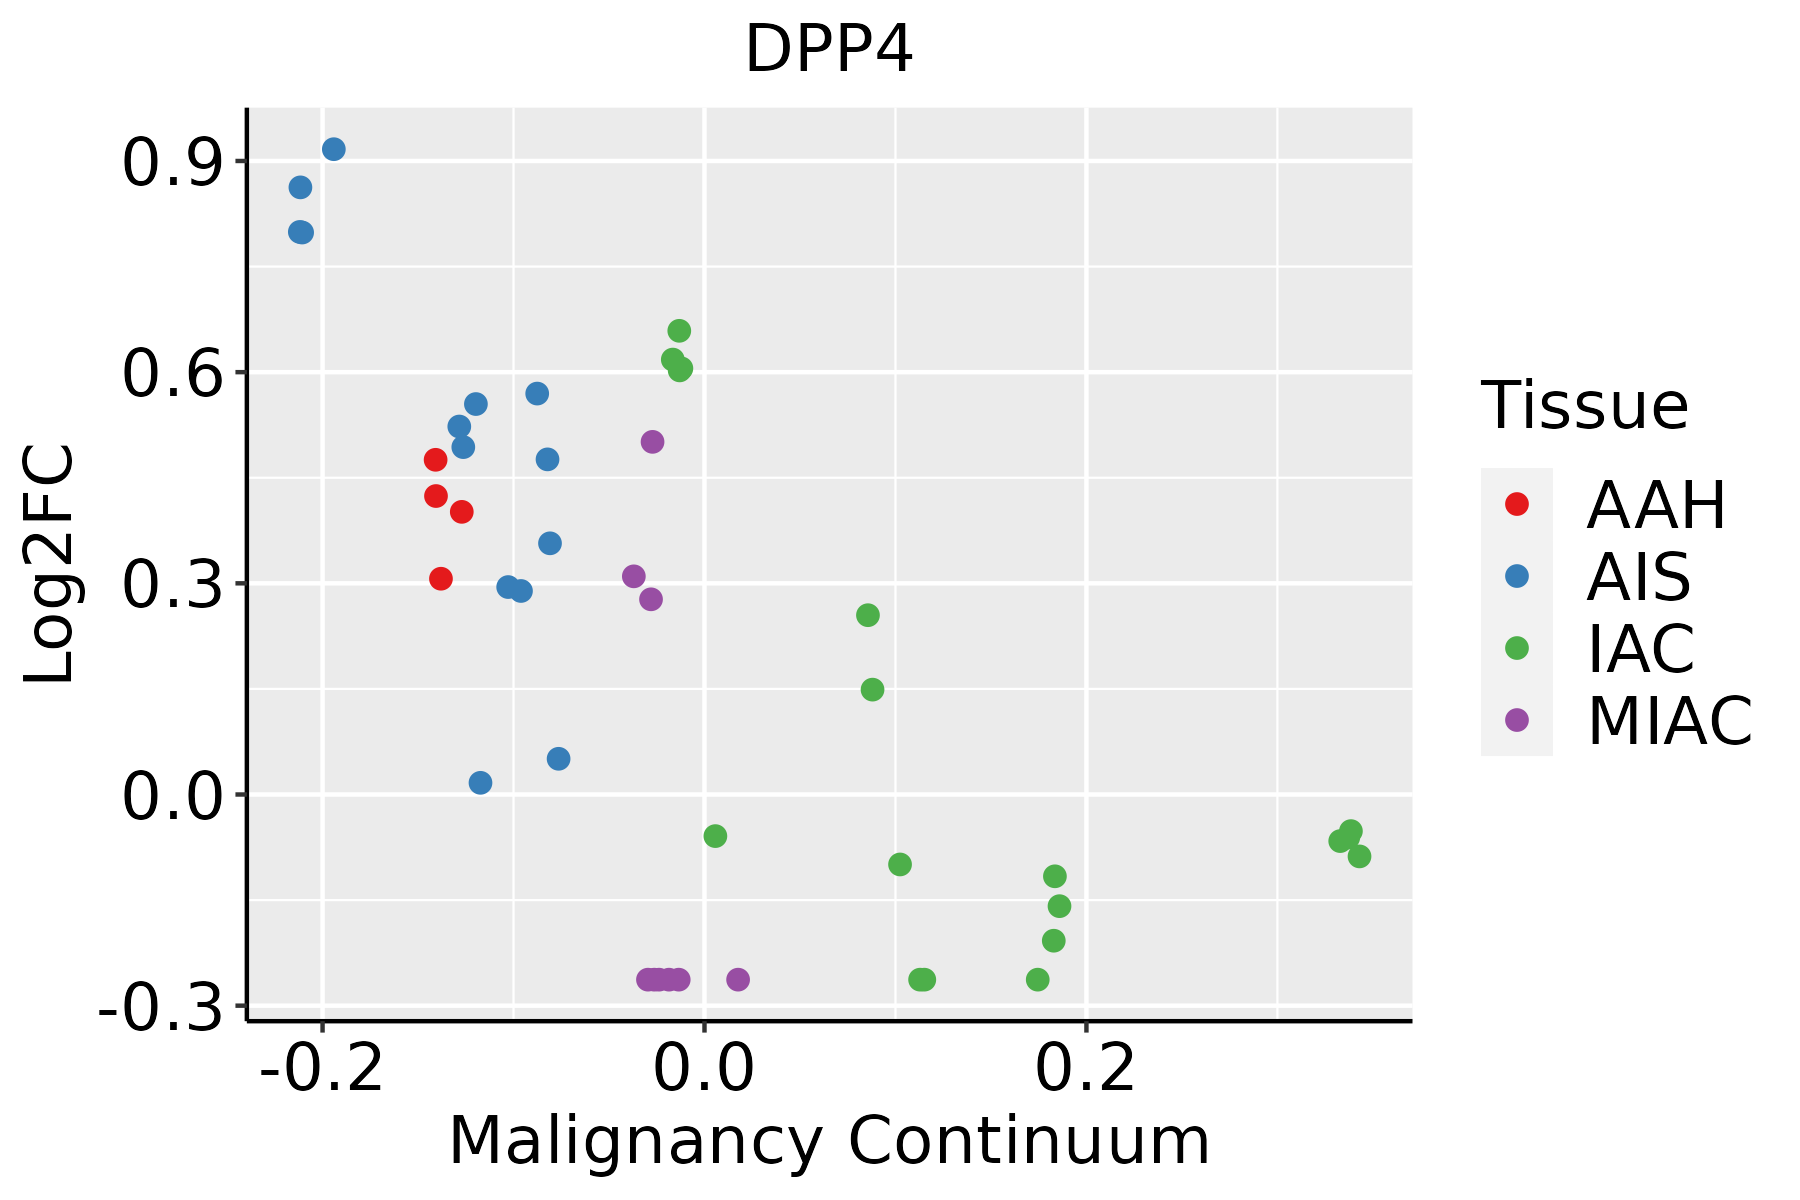 | AAH: Atypical adenomatous hyperplasia |
| AIS: Adenocarcinoma in situ |
| IAC: Invasive lung adenocarcinoma |
| MIA: Minimally invasive adenocarcinoma |
| Thyroid |  | ATC: Anaplastic thyroid cancer |
| HT: Hashimoto's thyroiditis |
| PTC: Papillary thyroid cancer |
| GO ID | Tissue | Disease Stage | Description | Gene Ratio | Bg Ratio | pvalue | p.adjust | Count |
| GO:0060326 | Stomach | GC | cell chemotaxis | 35/1159 | 310/18723 | 4.34e-04 | 6.46e-03 | 35 |
| GO:00362936 | Stomach | GC | response to decreased oxygen levels | 36/1159 | 322/18723 | 4.36e-04 | 6.47e-03 | 36 |
| GO:00428863 | Stomach | GC | amide transport | 34/1159 | 301/18723 | 5.16e-04 | 7.28e-03 | 34 |
| GO:00016666 | Stomach | GC | response to hypoxia | 34/1159 | 307/18723 | 7.34e-04 | 9.54e-03 | 34 |
| GO:00704826 | Stomach | GC | response to oxygen levels | 37/1159 | 347/18723 | 8.94e-04 | 1.10e-02 | 37 |
| GO:0071622 | Stomach | GC | regulation of granulocyte chemotaxis | 10/1159 | 51/18723 | 9.90e-04 | 1.18e-02 | 10 |
| GO:00300735 | Stomach | GC | insulin secretion | 24/1159 | 195/18723 | 1.01e-03 | 1.20e-02 | 24 |
| GO:0002688 | Stomach | GC | regulation of leukocyte chemotaxis | 17/1159 | 122/18723 | 1.38e-03 | 1.52e-02 | 17 |
| GO:0090022 | Stomach | GC | regulation of neutrophil chemotaxis | 7/1159 | 32/18723 | 2.93e-03 | 2.65e-02 | 7 |
| GO:1902622 | Stomach | GC | regulation of neutrophil migration | 8/1159 | 41/18723 | 3.22e-03 | 2.84e-02 | 8 |
| GO:00224116 | Stomach | GC | cellular component disassembly | 42/1159 | 443/18723 | 3.99e-03 | 3.35e-02 | 42 |
| GO:00027903 | Stomach | GC | peptide secretion | 26/1159 | 242/18723 | 4.39e-03 | 3.60e-02 | 26 |
| GO:00016675 | Stomach | GC | ameboidal-type cell migration | 44/1159 | 475/18723 | 4.97e-03 | 3.96e-02 | 44 |
| GO:00300723 | Stomach | GC | peptide hormone secretion | 25/1159 | 236/18723 | 6.15e-03 | 4.64e-02 | 25 |
| GO:00507965 | Stomach | GC | regulation of insulin secretion | 19/1159 | 165/18723 | 6.67e-03 | 4.86e-02 | 19 |
| GO:0016032113 | Thyroid | PTC | viral process | 236/5968 | 415/18723 | 2.48e-26 | 8.24e-24 | 236 |
| GO:0022411113 | Thyroid | PTC | cellular component disassembly | 232/5968 | 443/18723 | 1.36e-19 | 1.75e-17 | 232 |
| GO:0019058113 | Thyroid | PTC | viral life cycle | 167/5968 | 317/18723 | 8.87e-15 | 5.89e-13 | 167 |
| GO:0044403113 | Thyroid | PTC | biological process involved in symbiotic interaction | 151/5968 | 290/18723 | 5.83e-13 | 2.85e-11 | 151 |
| GO:0051701113 | Thyroid | PTC | biological process involved in interaction with host | 109/5968 | 203/18723 | 8.64e-11 | 2.99e-09 | 109 |
| Hugo Symbol | Variant Class | Variant Classification | dbSNP RS | HGVSc | HGVSp | HGVSp Short | SWISSPROT | BIOTYPE | SIFT | PolyPhen | Tumor Sample Barcode | Tissue | Histology | Sex | Age | Stage | Therapy Types | Drugs | Outcome |
| DPP4 | SNV | Missense_Mutation | novel | c.1444N>A | p.Leu482Ile | p.L482I | P27487 | protein_coding | deleterious(0.05) | benign(0.258) | TCGA-AN-A046-01 | Breast | breast invasive carcinoma | Female | >=65 | I/II | Unknown | Unknown | SD |
| DPP4 | SNV | Missense_Mutation | rs755540270 | c.1051N>G | p.Thr351Ala | p.T351A | P27487 | protein_coding | deleterious(0.02) | benign(0.112) | TCGA-AR-A2LK-01 | Breast | breast invasive carcinoma | Female | <65 | III/IV | Hormone Therapy | anastrozole | PD |
| DPP4 | SNV | Missense_Mutation | | c.1394N>T | p.Ala465Val | p.A465V | P27487 | protein_coding | deleterious(0.01) | possibly_damaging(0.675) | TCGA-B6-A0IB-01 | Breast | breast invasive carcinoma | Female | <65 | III/IV | Unknown | Unknown | PD |
| DPP4 | SNV | Missense_Mutation | | c.2222N>A | p.Gly741Glu | p.G741E | P27487 | protein_coding | deleterious(0) | probably_damaging(0.953) | TCGA-B6-A0X1-01 | Breast | breast invasive carcinoma | Female | <65 | I/II | Unknown | Unknown | PD |
| DPP4 | SNV | Missense_Mutation | | c.779N>C | p.Gly260Ala | p.G260A | P27487 | protein_coding | deleterious(0.01) | probably_damaging(0.928) | TCGA-BH-A0DX-01 | Breast | breast invasive carcinoma | Female | <65 | I/II | Chemotherapy | taxotere | CR |
| DPP4 | SNV | Missense_Mutation | novel | c.1493N>T | p.Ser498Leu | p.S498L | P27487 | protein_coding | tolerated(0.13) | benign(0.007) | TCGA-BH-A2L8-01 | Breast | breast invasive carcinoma | Female | <65 | I/II | Chemotherapy | cytoxan | CR |
| DPP4 | SNV | Missense_Mutation | rs752793888 | c.1067N>A | p.Arg356Lys | p.R356K | P27487 | protein_coding | tolerated(0.52) | benign(0.084) | TCGA-C8-A26Y-01 | Breast | breast invasive carcinoma | Female | >=65 | I/II | Unknown | Unknown | SD |
| DPP4 | SNV | Missense_Mutation | | c.67N>A | p.Val23Met | p.V23M | P27487 | protein_coding | tolerated(0.16) | probably_damaging(0.988) | TCGA-D8-A1XM-01 | Breast | breast invasive carcinoma | Female | <65 | I/II | Unknown | Unknown | SD |
| DPP4 | deletion | Frame_Shift_Del | rs779957190 | c.135_138delAACT | p.Thr46IlefsTer3 | p.T46Ifs*3 | P27487 | protein_coding | | | TCGA-A2-A3XW-01 | Breast | breast invasive carcinoma | Female | <65 | I/II | Chemotherapy | adriamyicin | CR |
| DPP4 | SNV | Missense_Mutation | | c.2072N>C | p.Arg691Thr | p.R691T | P27487 | protein_coding | deleterious(0) | probably_damaging(0.95) | TCGA-DG-A2KK-01 | Cervix | cervical & endocervical cancer | Female | <65 | III/IV | Chemotherapy | cisplatin | SD |
| Entrez ID | Symbol | Category | Interaction Types | Drug Claim Name | Drug Name | PMIDs |
| 1803 | DPP4 | PROTEASE, CELL SURFACE, DRUGGABLE GENOME, ENZYME | inhibitor | CHEMBL2105762 | OMARIGLIPTIN | |
| 1803 | DPP4 | PROTEASE, CELL SURFACE, DRUGGABLE GENOME, ENZYME | | VILDAGLIPTIN | VILDAGLIPTIN | |
| 1803 | DPP4 | PROTEASE, CELL SURFACE, DRUGGABLE GENOME, ENZYME | | Beta-phe compound 2 | | |
| 1803 | DPP4 | PROTEASE, CELL SURFACE, DRUGGABLE GENOME, ENZYME | | Imidazo cyclohexylamine derivative 3 | | |
| 1803 | DPP4 | PROTEASE, CELL SURFACE, DRUGGABLE GENOME, ENZYME | | Peptide analog 47 | | |
| 1803 | DPP4 | PROTEASE, CELL SURFACE, DRUGGABLE GENOME, ENZYME | | ENALAPRIL | ENALAPRIL | 16678199 |
| 1803 | DPP4 | PROTEASE, CELL SURFACE, DRUGGABLE GENOME, ENZYME | | Dutogliptin | DUTOGLIPTIN | |
| 1803 | DPP4 | PROTEASE, CELL SURFACE, DRUGGABLE GENOME, ENZYME | inhibitor | CHEMBL3833357 | BEGELOMAB | |
| 1803 | DPP4 | PROTEASE, CELL SURFACE, DRUGGABLE GENOME, ENZYME | inhibitor | 363894186 | TALABOSTAT | |
| 1803 | DPP4 | PROTEASE, CELL SURFACE, DRUGGABLE GENOME, ENZYME | | PMID25482888-Compound-52 | | |


