
|
|||||
|
 | |
| |
| |
| |
| |
| |
|
Gene: DLAT |
Gene summary for DLAT |
| Gene information | Species | Human | Gene symbol | DLAT | Gene ID | 1737 |
| Gene name | dihydrolipoamide S-acetyltransferase | |
| Gene Alias | DLTA | |
| Cytomap | 11q23.1 | |
| Gene Type | protein-coding | GO ID | GO:0005975 | UniProtAcc | P10515 |
Top |
Malignant transformation analysis |
| Identification of the aberrant gene expression in precancerous and cancerous lesions by comparing the gene expression of stem-like cells in diseased tissues with normal stem cells |
| Entrez ID | Symbol | Replicates | Species | Organ | Tissue | Adj P-value | Log2FC | Malignancy |
| 1737 | DLAT | LZE7T | Human | Esophagus | ESCC | 2.56e-02 | 7.37e-02 | 0.0667 |
| 1737 | DLAT | LZE24T | Human | Esophagus | ESCC | 2.25e-04 | 2.51e-01 | 0.0596 |
| 1737 | DLAT | P2T-E | Human | Esophagus | ESCC | 2.12e-14 | 1.12e-01 | 0.1177 |
| 1737 | DLAT | P4T-E | Human | Esophagus | ESCC | 3.37e-17 | 4.34e-01 | 0.1323 |
| 1737 | DLAT | P5T-E | Human | Esophagus | ESCC | 1.25e-14 | 3.90e-01 | 0.1327 |
| 1737 | DLAT | P8T-E | Human | Esophagus | ESCC | 3.31e-03 | 5.07e-02 | 0.0889 |
| 1737 | DLAT | P9T-E | Human | Esophagus | ESCC | 1.88e-13 | 1.50e-01 | 0.1131 |
| 1737 | DLAT | P10T-E | Human | Esophagus | ESCC | 2.13e-06 | 1.12e-01 | 0.116 |
| 1737 | DLAT | P11T-E | Human | Esophagus | ESCC | 8.45e-09 | 3.69e-01 | 0.1426 |
| 1737 | DLAT | P12T-E | Human | Esophagus | ESCC | 2.86e-21 | 3.32e-01 | 0.1122 |
| 1737 | DLAT | P15T-E | Human | Esophagus | ESCC | 1.07e-07 | 1.24e-01 | 0.1149 |
| 1737 | DLAT | P16T-E | Human | Esophagus | ESCC | 9.27e-16 | 2.33e-01 | 0.1153 |
| 1737 | DLAT | P17T-E | Human | Esophagus | ESCC | 4.47e-03 | 1.69e-01 | 0.1278 |
| 1737 | DLAT | P20T-E | Human | Esophagus | ESCC | 2.83e-09 | 9.93e-02 | 0.1124 |
| 1737 | DLAT | P21T-E | Human | Esophagus | ESCC | 1.35e-31 | 6.07e-01 | 0.1617 |
| 1737 | DLAT | P22T-E | Human | Esophagus | ESCC | 1.96e-06 | 3.90e-02 | 0.1236 |
| 1737 | DLAT | P23T-E | Human | Esophagus | ESCC | 2.08e-10 | 3.03e-01 | 0.108 |
| 1737 | DLAT | P24T-E | Human | Esophagus | ESCC | 4.47e-08 | 1.73e-01 | 0.1287 |
| 1737 | DLAT | P26T-E | Human | Esophagus | ESCC | 3.00e-09 | 1.66e-01 | 0.1276 |
| 1737 | DLAT | P28T-E | Human | Esophagus | ESCC | 8.68e-07 | 1.61e-01 | 0.1149 |
| Page: 1 2 3 4 |
| Tissue | Expression Dynamics | Abbreviation |
| Esophagus | 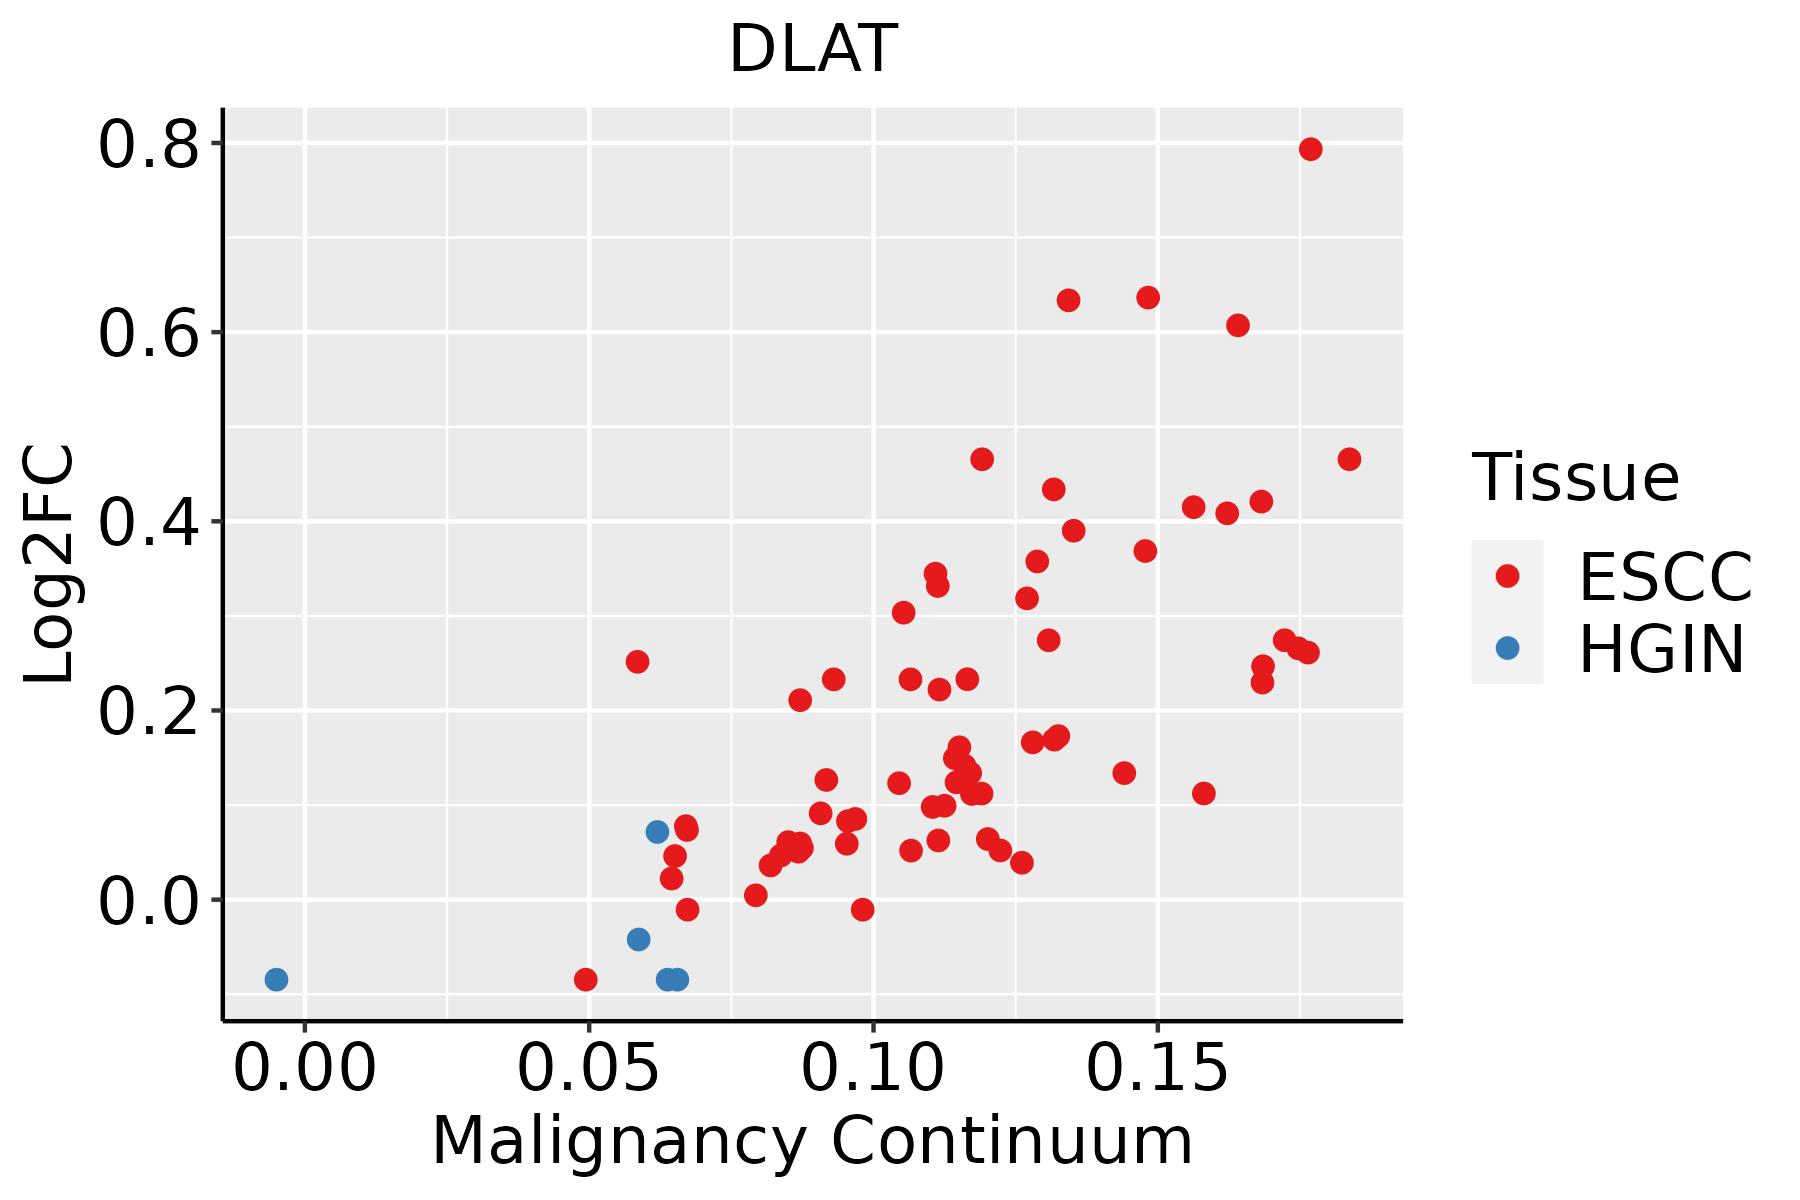 | ESCC: Esophageal squamous cell carcinoma |
| HGIN: High-grade intraepithelial neoplasias | ||
| LGIN: Low-grade intraepithelial neoplasias | ||
| Liver | 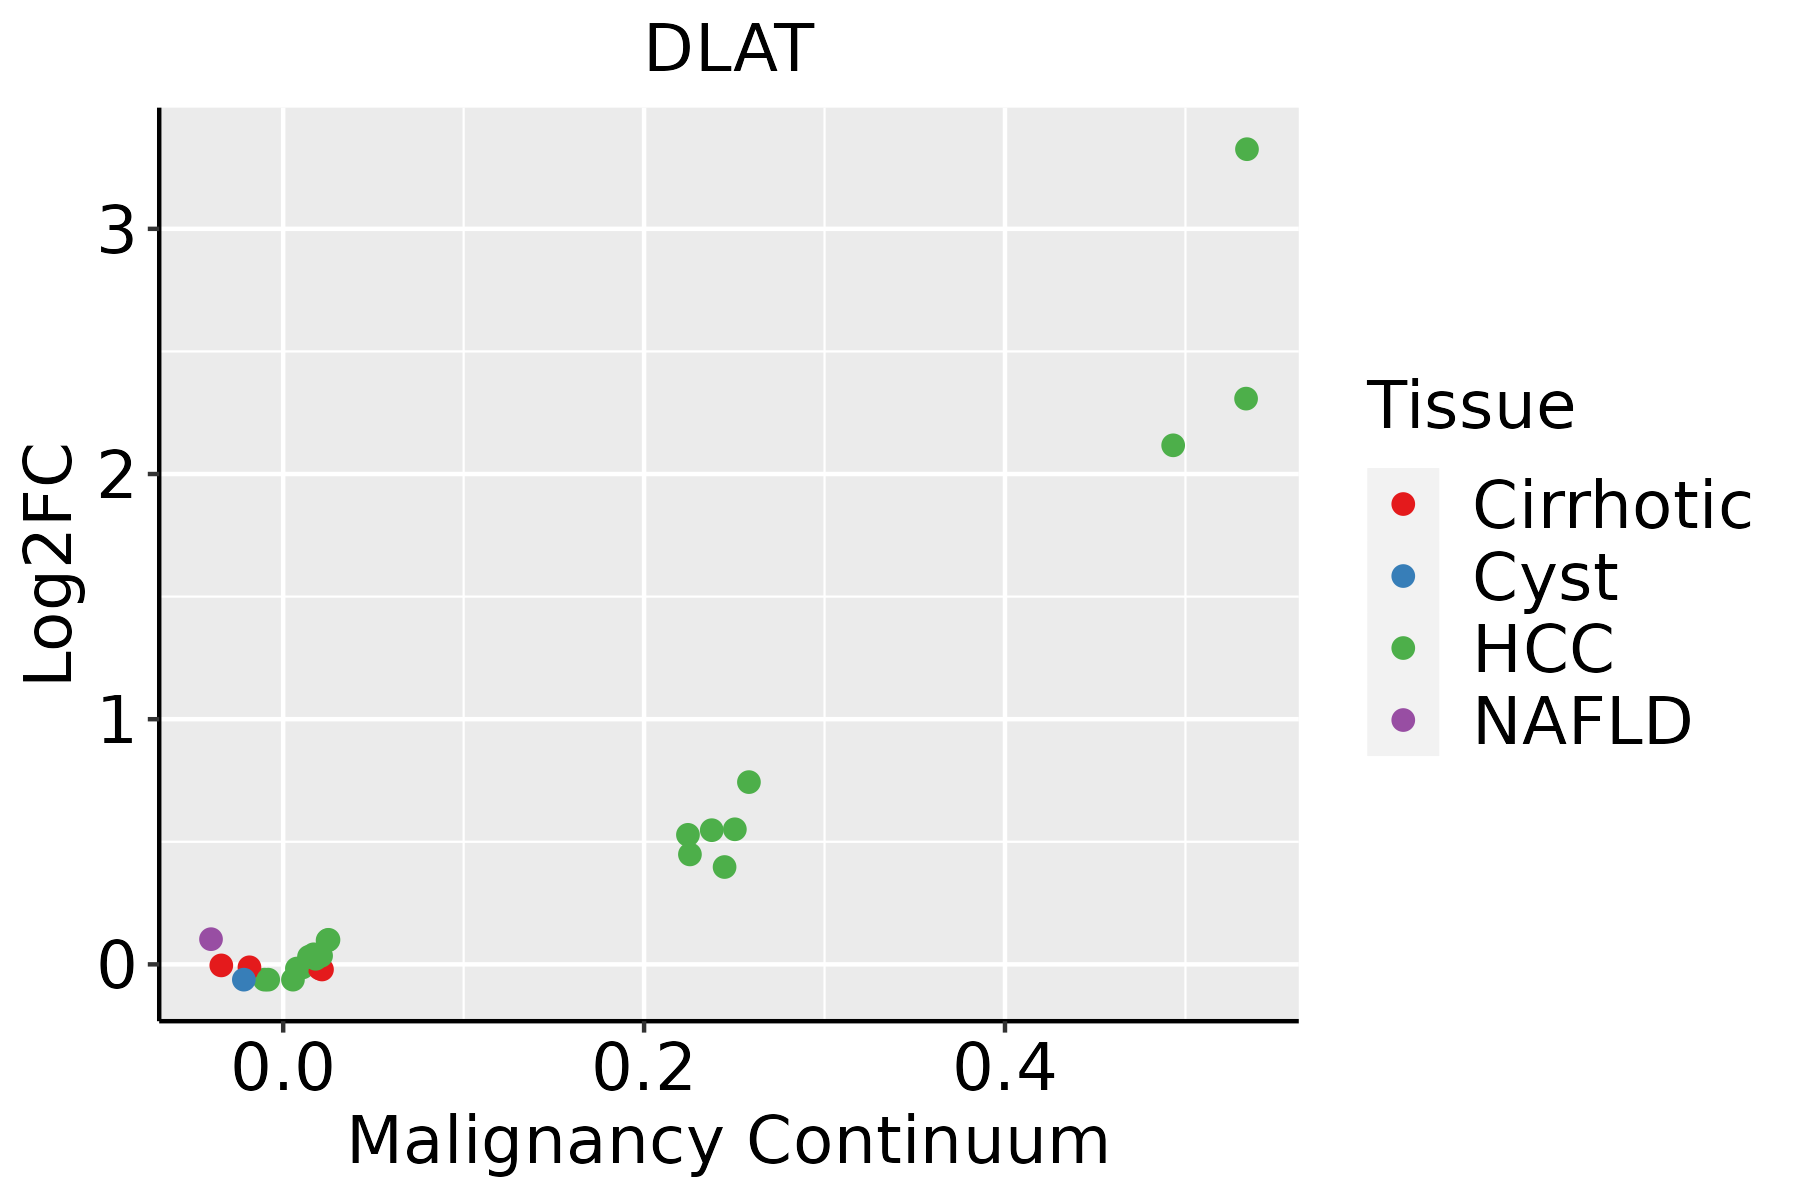 | HCC: Hepatocellular carcinoma |
| NAFLD: Non-alcoholic fatty liver disease | ||
| Oral Cavity |  | EOLP: Erosive Oral lichen planus |
| LP: leukoplakia | ||
| NEOLP: Non-erosive oral lichen planus | ||
| OSCC: Oral squamous cell carcinoma | ||
| Skin | 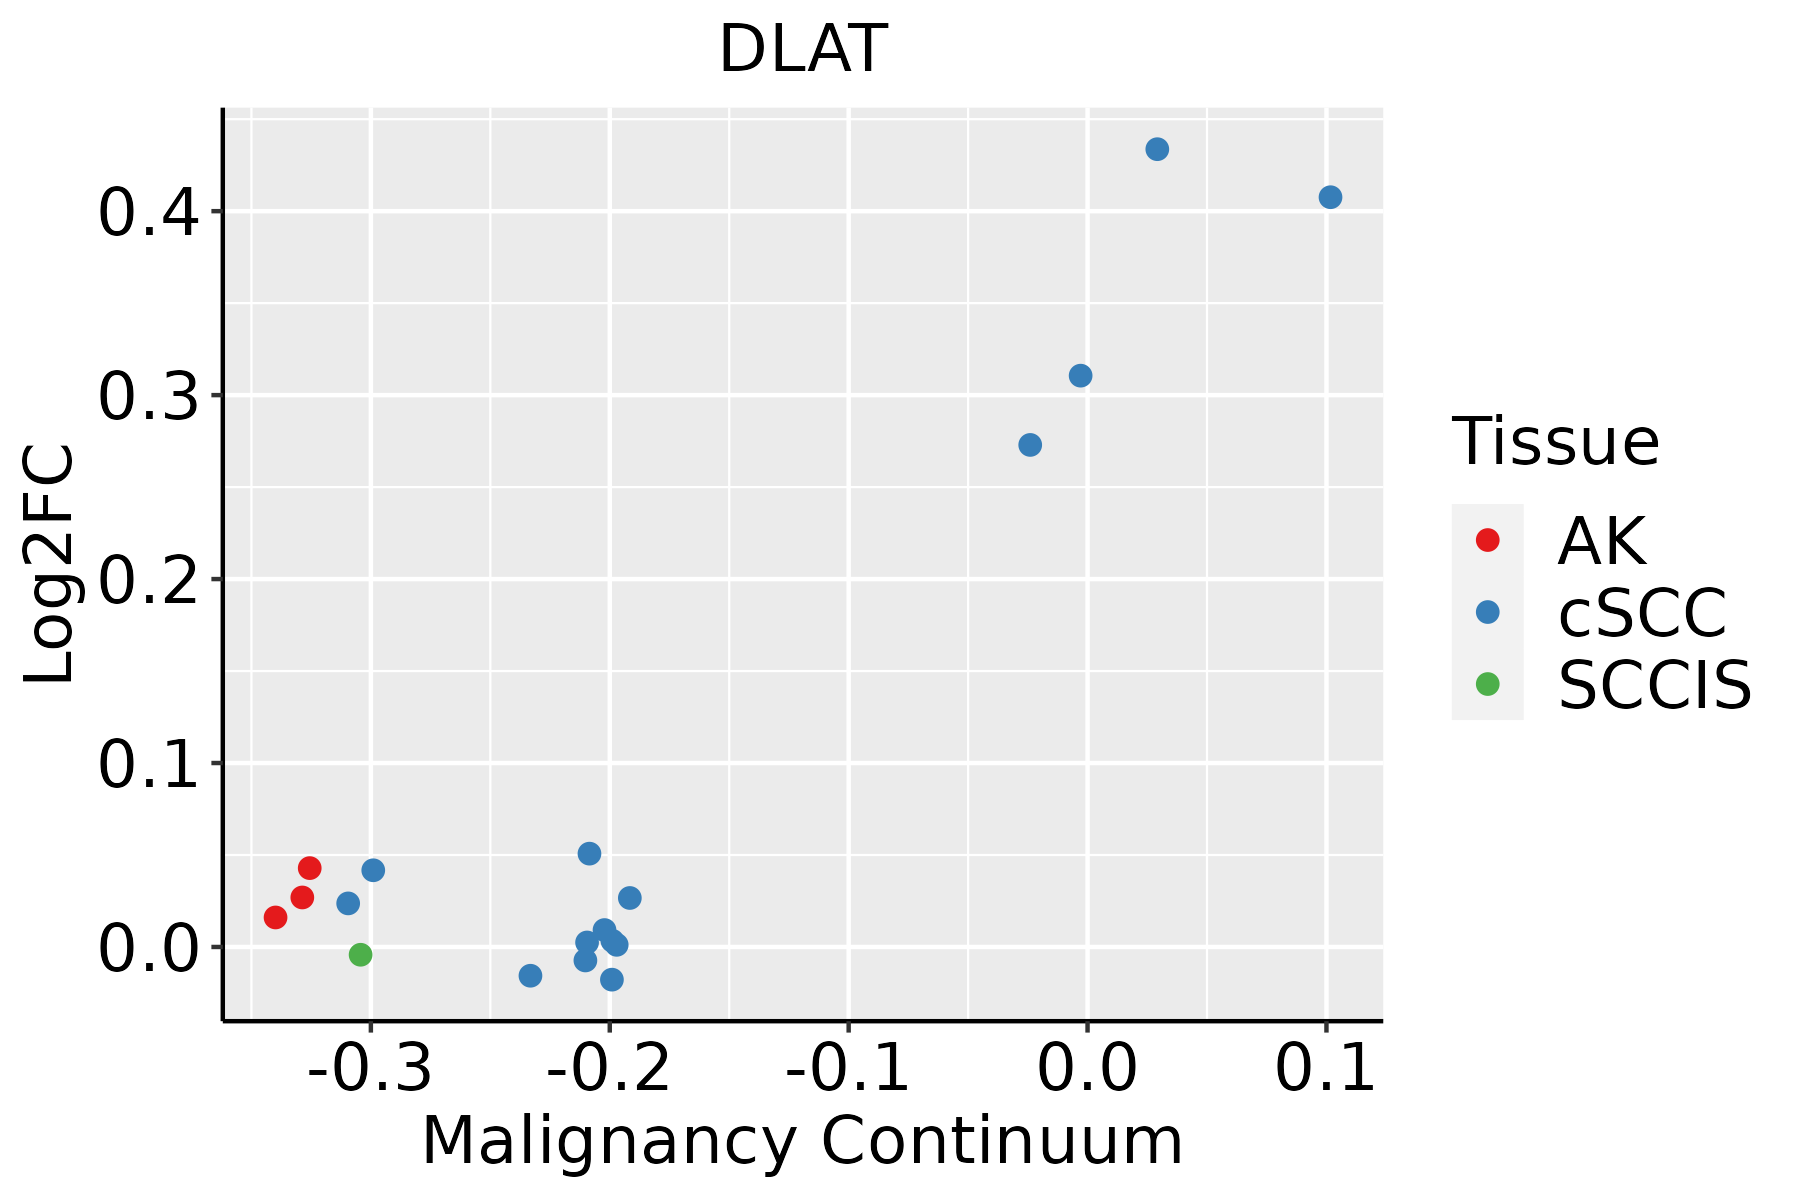 | AK: Actinic keratosis |
| cSCC: Cutaneous squamous cell carcinoma | ||
| SCCIS:squamous cell carcinoma in situ |
| ∗log2FC in expression of this searched gene in stem-like cells from each diseased tissue sample relative to stem-like cells in normal samples in each tissue plotted against the malignancy continuum. Samples are colored based on if they are from different disease stage. |
Top |
Malignant transformation related pathway analysis |
| Find out the enriched GO biological processes and KEGG pathways involved in transition from healthy to precancer to cancer |
| Tissue | Disease Stage | Enriched GO biological Processes |
| Colorectum | AD |  |
| Colorectum | SER |  |
| Colorectum | MSS |  |
| Colorectum | MSI-H |  |
| Colorectum | FAP |  |
| ∗Top 15 enriched GO BP terms are showed in the bar plot of each disease state in each tissue. Each row represents a significant GO biological process which is colored according to the -log10(p.adjust). |
| Page: 1 2 3 4 5 6 7 8 9 |
| GO ID | Tissue | Disease Stage | Description | Gene Ratio | Bg Ratio | pvalue | p.adjust | Count |
| GO:000609017 | Oral cavity | OSCC | pyruvate metabolic process | 57/7305 | 106/18723 | 1.42e-03 | 6.84e-03 | 57 |
| GO:00338654 | Oral cavity | OSCC | nucleoside bisphosphate metabolic process | 66/7305 | 128/18723 | 2.58e-03 | 1.13e-02 | 66 |
| GO:00338754 | Oral cavity | OSCC | ribonucleoside bisphosphate metabolic process | 66/7305 | 128/18723 | 2.58e-03 | 1.13e-02 | 66 |
| GO:00340324 | Oral cavity | OSCC | purine nucleoside bisphosphate metabolic process | 66/7305 | 128/18723 | 2.58e-03 | 1.13e-02 | 66 |
| GO:00060842 | Oral cavity | OSCC | acetyl-CoA metabolic process | 22/7305 | 35/18723 | 3.65e-03 | 1.51e-02 | 22 |
| GO:00060852 | Oral cavity | OSCC | acetyl-CoA biosynthetic process | 13/7305 | 18/18723 | 4.45e-03 | 1.79e-02 | 13 |
| GO:00066373 | Oral cavity | OSCC | acyl-CoA metabolic process | 50/7305 | 96/18723 | 6.24e-03 | 2.35e-02 | 50 |
| GO:00353833 | Oral cavity | OSCC | thioester metabolic process | 50/7305 | 96/18723 | 6.24e-03 | 2.35e-02 | 50 |
| GO:000926017 | Oral cavity | OSCC | ribonucleotide biosynthetic process | 88/7305 | 182/18723 | 6.29e-03 | 2.35e-02 | 88 |
| GO:000906019 | Oral cavity | LP | aerobic respiration | 111/4623 | 189/18723 | 1.68e-23 | 5.85e-21 | 111 |
| GO:004533319 | Oral cavity | LP | cellular respiration | 124/4623 | 230/18723 | 1.35e-21 | 3.38e-19 | 124 |
| GO:000609119 | Oral cavity | LP | generation of precursor metabolites and energy | 214/4623 | 490/18723 | 1.12e-20 | 2.60e-18 | 214 |
| GO:001598019 | Oral cavity | LP | energy derivation by oxidation of organic compounds | 145/4623 | 318/18723 | 2.44e-16 | 3.64e-14 | 145 |
| GO:000609912 | Oral cavity | LP | tricarboxylic acid cycle | 22/4623 | 30/18723 | 2.86e-08 | 1.04e-06 | 22 |
| GO:000675319 | Oral cavity | LP | nucleoside phosphate metabolic process | 161/4623 | 497/18723 | 5.31e-05 | 7.39e-04 | 161 |
| GO:0009117110 | Oral cavity | LP | nucleotide metabolic process | 158/4623 | 489/18723 | 7.17e-05 | 9.49e-04 | 158 |
| GO:0019693110 | Oral cavity | LP | ribose phosphate metabolic process | 128/4623 | 396/18723 | 3.26e-04 | 3.28e-03 | 128 |
| GO:000599613 | Oral cavity | LP | monosaccharide metabolic process | 86/4623 | 257/18723 | 9.13e-04 | 7.79e-03 | 86 |
| GO:0072521110 | Oral cavity | LP | purine-containing compound metabolic process | 130/4623 | 416/18723 | 1.30e-03 | 1.05e-02 | 130 |
| GO:004639018 | Oral cavity | LP | ribose phosphate biosynthetic process | 65/4623 | 190/18723 | 1.97e-03 | 1.47e-02 | 65 |
| Page: 1 2 3 4 5 6 7 8 |
| Pathway ID | Tissue | Disease Stage | Description | Gene Ratio | Bg Ratio | pvalue | p.adjust | qvalue | Count |
| hsa0120023 | Esophagus | ESCC | Carbon metabolism | 79/4205 | 115/8465 | 2.50e-05 | 1.21e-04 | 6.22e-05 | 79 |
| hsa0062023 | Esophagus | ESCC | Pyruvate metabolism | 32/4205 | 47/8465 | 8.11e-03 | 1.94e-02 | 9.94e-03 | 32 |
| hsa0001016 | Esophagus | ESCC | Glycolysis / Gluconeogenesis | 42/4205 | 67/8465 | 2.15e-02 | 4.78e-02 | 2.45e-02 | 42 |
| hsa0120033 | Esophagus | ESCC | Carbon metabolism | 79/4205 | 115/8465 | 2.50e-05 | 1.21e-04 | 6.22e-05 | 79 |
| hsa0062033 | Esophagus | ESCC | Pyruvate metabolism | 32/4205 | 47/8465 | 8.11e-03 | 1.94e-02 | 9.94e-03 | 32 |
| hsa0001017 | Esophagus | ESCC | Glycolysis / Gluconeogenesis | 42/4205 | 67/8465 | 2.15e-02 | 4.78e-02 | 2.45e-02 | 42 |
| hsa0120041 | Liver | HCC | Carbon metabolism | 89/4020 | 115/8465 | 3.92e-11 | 6.56e-10 | 3.65e-10 | 89 |
| hsa0002021 | Liver | HCC | Citrate cycle (TCA cycle) | 28/4020 | 30/8465 | 1.08e-07 | 1.44e-06 | 8.02e-07 | 28 |
| hsa0062021 | Liver | HCC | Pyruvate metabolism | 37/4020 | 47/8465 | 1.10e-05 | 8.03e-05 | 4.46e-05 | 37 |
| hsa0001022 | Liver | HCC | Glycolysis / Gluconeogenesis | 43/4020 | 67/8465 | 4.26e-03 | 1.29e-02 | 7.15e-03 | 43 |
| hsa00785 | Liver | HCC | Lipoic acid metabolism | 14/4020 | 19/8465 | 1.89e-02 | 4.40e-02 | 2.45e-02 | 14 |
| hsa0120051 | Liver | HCC | Carbon metabolism | 89/4020 | 115/8465 | 3.92e-11 | 6.56e-10 | 3.65e-10 | 89 |
| hsa0002031 | Liver | HCC | Citrate cycle (TCA cycle) | 28/4020 | 30/8465 | 1.08e-07 | 1.44e-06 | 8.02e-07 | 28 |
| hsa0062031 | Liver | HCC | Pyruvate metabolism | 37/4020 | 47/8465 | 1.10e-05 | 8.03e-05 | 4.46e-05 | 37 |
| hsa0001032 | Liver | HCC | Glycolysis / Gluconeogenesis | 43/4020 | 67/8465 | 4.26e-03 | 1.29e-02 | 7.15e-03 | 43 |
| hsa007851 | Liver | HCC | Lipoic acid metabolism | 14/4020 | 19/8465 | 1.89e-02 | 4.40e-02 | 2.45e-02 | 14 |
| hsa0002012 | Oral cavity | OSCC | Citrate cycle (TCA cycle) | 26/3704 | 30/8465 | 1.38e-06 | 7.46e-06 | 3.80e-06 | 26 |
| hsa0120014 | Oral cavity | OSCC | Carbon metabolism | 74/3704 | 115/8465 | 6.10e-06 | 3.05e-05 | 1.55e-05 | 74 |
| hsa006209 | Oral cavity | OSCC | Pyruvate metabolism | 31/3704 | 47/8465 | 1.74e-03 | 4.73e-03 | 2.41e-03 | 31 |
| hsa0001014 | Oral cavity | OSCC | Glycolysis / Gluconeogenesis | 40/3704 | 67/8465 | 6.08e-03 | 1.44e-02 | 7.31e-03 | 40 |
| Page: 1 2 |
Top |
Cell-cell communication analysis |
| Identification of potential cell-cell interactions between two cell types and their ligand-receptor pairs for different disease states |
| Ligand | Receptor | LRpair | Pathway | Tissue | Disease Stage |
| Page: 1 |
Top |
Single-cell gene regulatory network inference analysis |
| Find out the significant the regulons (TFs) and the target genes of each regulon across cell types for different disease states |
| TF | Cell Type | Tissue | Disease Stage | Target Gene | RSS | Regulon Activity |
| ∗The dot plots of a searched regulon are shown for all cell subpopulations in each disease state of each tissue based on the regulon specific score inferred using pySCENIC and by calculating the average expression. |
| Page: 1 |
Top |
Somatic mutation of malignant transformation related genes |
| Annotation of somatic variants for genes involved in malignant transformation |
| Hugo Symbol | Variant Class | Variant Classification | dbSNP RS | HGVSc | HGVSp | HGVSp Short | SWISSPROT | BIOTYPE | SIFT | PolyPhen | Tumor Sample Barcode | Tissue | Histology | Sex | Age | Stage | Therapy Types | Drugs | Outcome |
| DLAT | SNV | Missense_Mutation | rs782324198 | c.1555N>A | p.Ala519Thr | p.A519T | P10515 | protein_coding | tolerated(0.66) | benign(0.001) | TCGA-AN-A0AK-01 | Breast | breast invasive carcinoma | Female | >=65 | I/II | Unknown | Unknown | SD |
| DLAT | SNV | Missense_Mutation | rs782025464 | c.1897N>T | p.Ala633Ser | p.A633S | P10515 | protein_coding | tolerated(0.25) | benign(0.113) | TCGA-OL-A6VQ-01 | Breast | breast invasive carcinoma | Female | <65 | I/II | Unknown | Unknown | SD |
| DLAT | deletion | Frame_Shift_Del | c.716delN | p.Val242TrpfsTer5 | p.V242Wfs*5 | P10515 | protein_coding | TCGA-D8-A1XK-01 | Breast | breast invasive carcinoma | Female | <65 | I/II | Chemotherapy | doxorubicine+cyclophosphamide | SD | |||
| DLAT | deletion | Frame_Shift_Del | novel | c.884delN | p.Glu297ArgfsTer15 | p.E297Rfs*15 | P10515 | protein_coding | TCGA-D8-A27V-01 | Breast | breast invasive carcinoma | Female | <65 | I/II | Hormone Therapy | tamoxiphen | SD | ||
| DLAT | SNV | Missense_Mutation | c.343N>C | p.Glu115Gln | p.E115Q | P10515 | protein_coding | deleterious(0) | probably_damaging(0.977) | TCGA-LP-A4AW-01 | Cervix | cervical & endocervical cancer | Female | <65 | I/II | Unknown | Unknown | SD | |
| DLAT | SNV | Missense_Mutation | novel | c.1487N>T | p.Ser496Phe | p.S496F | P10515 | protein_coding | deleterious(0) | probably_damaging(1) | TCGA-ZJ-AAX8-01 | Cervix | cervical & endocervical cancer | Female | <65 | III/IV | Unknown | Unknown | SD |
| DLAT | SNV | Missense_Mutation | c.1105G>T | p.Gly369Trp | p.G369W | P10515 | protein_coding | deleterious(0) | probably_damaging(0.999) | TCGA-A6-5661-01 | Colorectum | colon adenocarcinoma | Female | >=65 | I/II | Unknown | Unknown | SD | |
| DLAT | SNV | Missense_Mutation | rs781951438 | c.605N>T | p.Ser202Leu | p.S202L | P10515 | protein_coding | tolerated(0.19) | benign(0) | TCGA-A6-6653-01 | Colorectum | colon adenocarcinoma | Male | >=65 | I/II | Unknown | Unknown | SD |
| DLAT | SNV | Missense_Mutation | rs782632175 | c.1477N>A | p.Glu493Lys | p.E493K | P10515 | protein_coding | deleterious(0) | probably_damaging(0.978) | TCGA-AA-3510-01 | Colorectum | colon adenocarcinoma | Male | >=65 | I/II | Unknown | Unknown | SD |
| DLAT | SNV | Missense_Mutation | rs782767621 | c.611C>A | p.Pro204His | p.P204H | P10515 | protein_coding | deleterious(0.01) | benign(0.235) | TCGA-EI-6507-01 | Colorectum | rectum adenocarcinoma | Male | <65 | I/II | Unknown | Unknown | SD |
| Page: 1 2 3 4 5 6 7 8 |
Top |
Related drugs of malignant transformation related genes |
| Identification of chemicals and drugs interact with genes involved in malignant transfromation |
| (DGIdb 4.0) |
| Entrez ID | Symbol | Category | Interaction Types | Drug Claim Name | Drug Name | PMIDs |
| Page: 1 |

Copyright 2023-Present -The University of Texas Health Science Center at Houston |