
|
|||||
|
 | |
| |
| |
| |
| |
| |
|
Gene: DERL1 |
Gene summary for DERL1 |
| Gene information | Species | Human | Gene symbol | DERL1 | Gene ID | 79139 |
| Gene name | derlin 1 | |
| Gene Alias | DER-1 | |
| Cytomap | 8q24.13 | |
| Gene Type | protein-coding | GO ID | GO:0006464 | UniProtAcc | Q9BUN8 |
Top |
Malignant transformation analysis |
| Identification of the aberrant gene expression in precancerous and cancerous lesions by comparing the gene expression of stem-like cells in diseased tissues with normal stem cells |
| Entrez ID | Symbol | Replicates | Species | Organ | Tissue | Adj P-value | Log2FC | Malignancy |
| 79139 | DERL1 | LZE4T | Human | Esophagus | ESCC | 1.10e-20 | 6.53e-01 | 0.0811 |
| 79139 | DERL1 | LZE5T | Human | Esophagus | ESCC | 3.24e-06 | 4.37e-01 | 0.0514 |
| 79139 | DERL1 | LZE7T | Human | Esophagus | ESCC | 3.91e-08 | 4.08e-01 | 0.0667 |
| 79139 | DERL1 | LZE8T | Human | Esophagus | ESCC | 1.66e-14 | 5.36e-01 | 0.067 |
| 79139 | DERL1 | LZE20T | Human | Esophagus | ESCC | 4.03e-11 | 5.57e-01 | 0.0662 |
| 79139 | DERL1 | LZE24T | Human | Esophagus | ESCC | 8.19e-29 | 7.57e-01 | 0.0596 |
| 79139 | DERL1 | LZE6T | Human | Esophagus | ESCC | 2.44e-11 | 4.09e-01 | 0.0845 |
| 79139 | DERL1 | P2T-E | Human | Esophagus | ESCC | 7.15e-34 | 7.93e-01 | 0.1177 |
| 79139 | DERL1 | P4T-E | Human | Esophagus | ESCC | 9.60e-29 | 7.64e-01 | 0.1323 |
| 79139 | DERL1 | P5T-E | Human | Esophagus | ESCC | 1.87e-35 | 8.14e-01 | 0.1327 |
| 79139 | DERL1 | P8T-E | Human | Esophagus | ESCC | 1.30e-32 | 5.48e-01 | 0.0889 |
| 79139 | DERL1 | P9T-E | Human | Esophagus | ESCC | 6.92e-28 | 7.88e-01 | 0.1131 |
| 79139 | DERL1 | P10T-E | Human | Esophagus | ESCC | 1.54e-35 | 6.75e-01 | 0.116 |
| 79139 | DERL1 | P11T-E | Human | Esophagus | ESCC | 7.28e-21 | 9.84e-01 | 0.1426 |
| 79139 | DERL1 | P12T-E | Human | Esophagus | ESCC | 1.64e-43 | 9.05e-01 | 0.1122 |
| 79139 | DERL1 | P15T-E | Human | Esophagus | ESCC | 4.18e-39 | 8.39e-01 | 0.1149 |
| 79139 | DERL1 | P16T-E | Human | Esophagus | ESCC | 1.10e-64 | 1.20e+00 | 0.1153 |
| 79139 | DERL1 | P17T-E | Human | Esophagus | ESCC | 2.36e-10 | 7.04e-01 | 0.1278 |
| 79139 | DERL1 | P19T-E | Human | Esophagus | ESCC | 5.35e-06 | 7.90e-01 | 0.1662 |
| 79139 | DERL1 | P20T-E | Human | Esophagus | ESCC | 1.48e-38 | 7.69e-01 | 0.1124 |
| Page: 1 2 3 4 5 6 |
| Tissue | Expression Dynamics | Abbreviation |
| Esophagus | 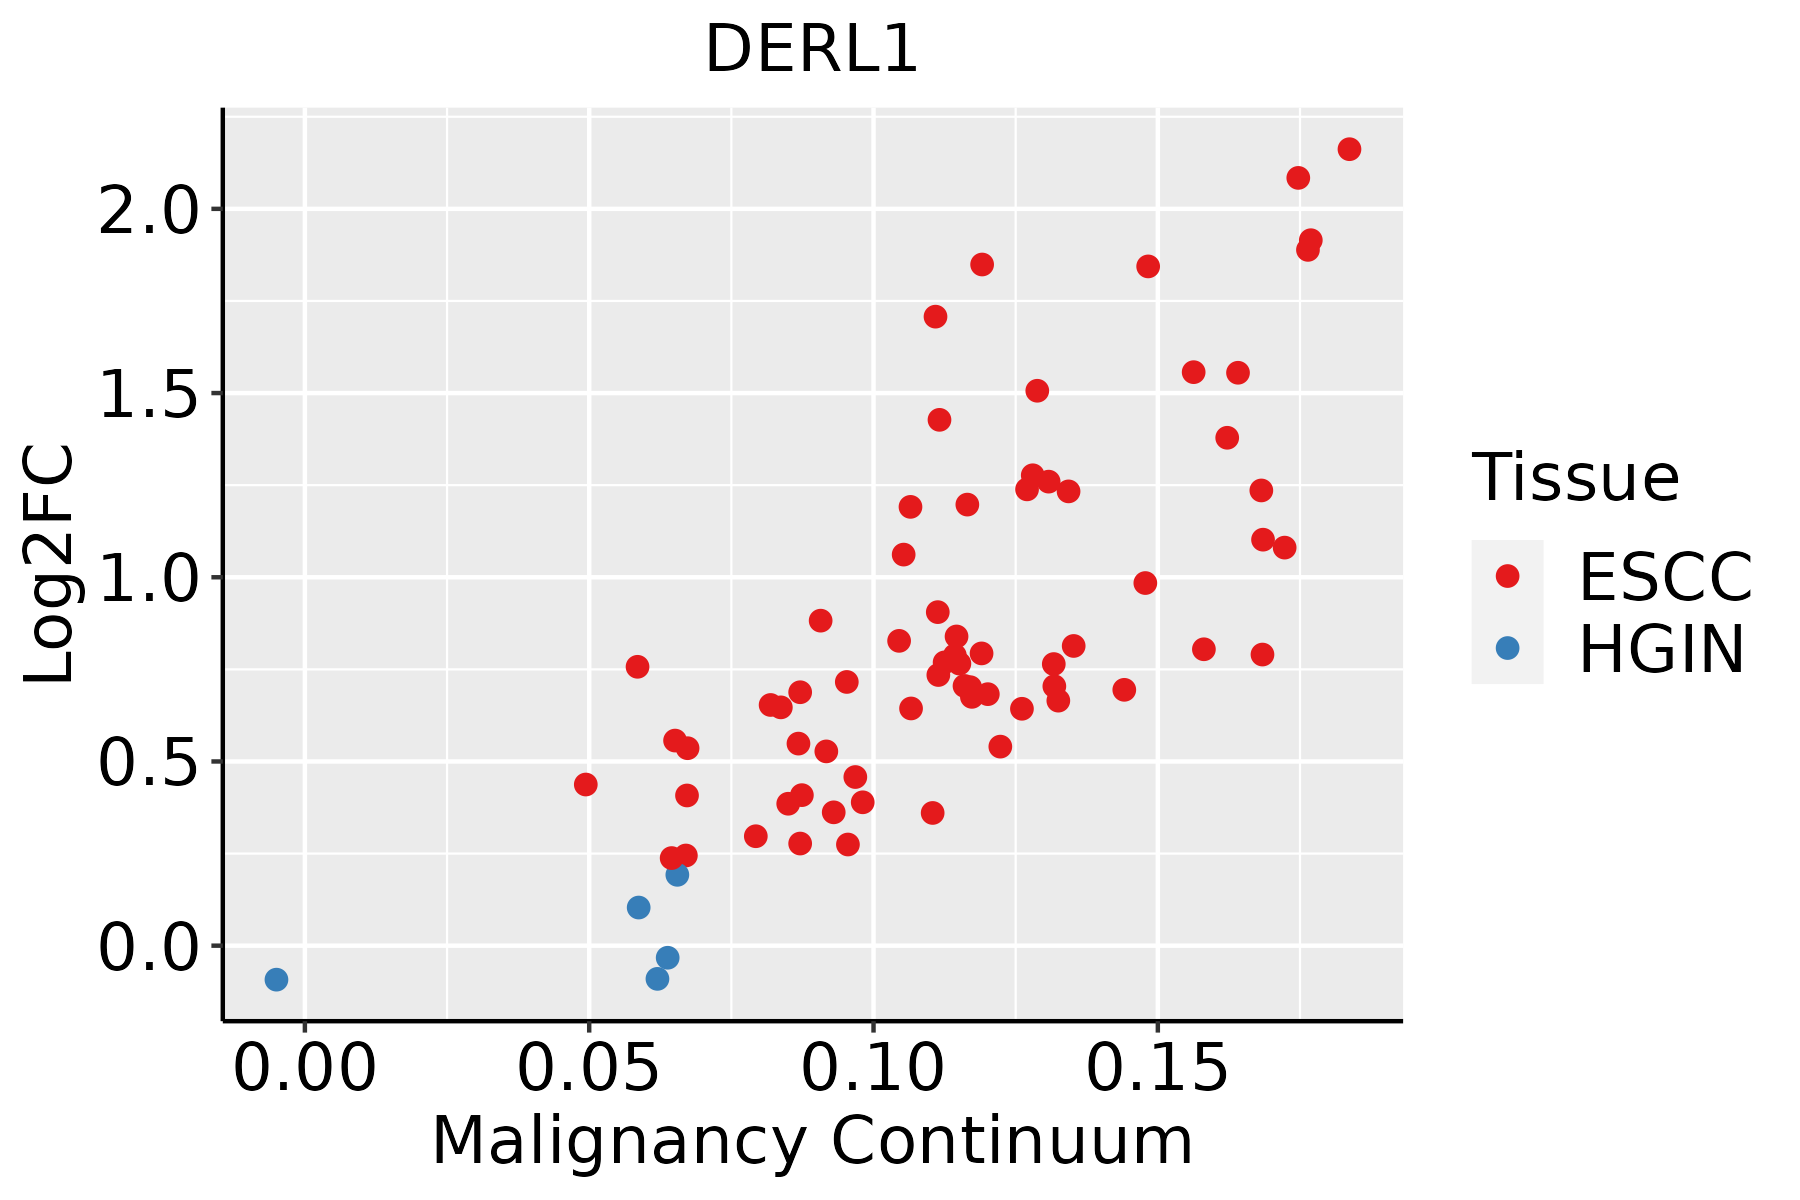 | ESCC: Esophageal squamous cell carcinoma |
| HGIN: High-grade intraepithelial neoplasias | ||
| LGIN: Low-grade intraepithelial neoplasias | ||
| Liver | 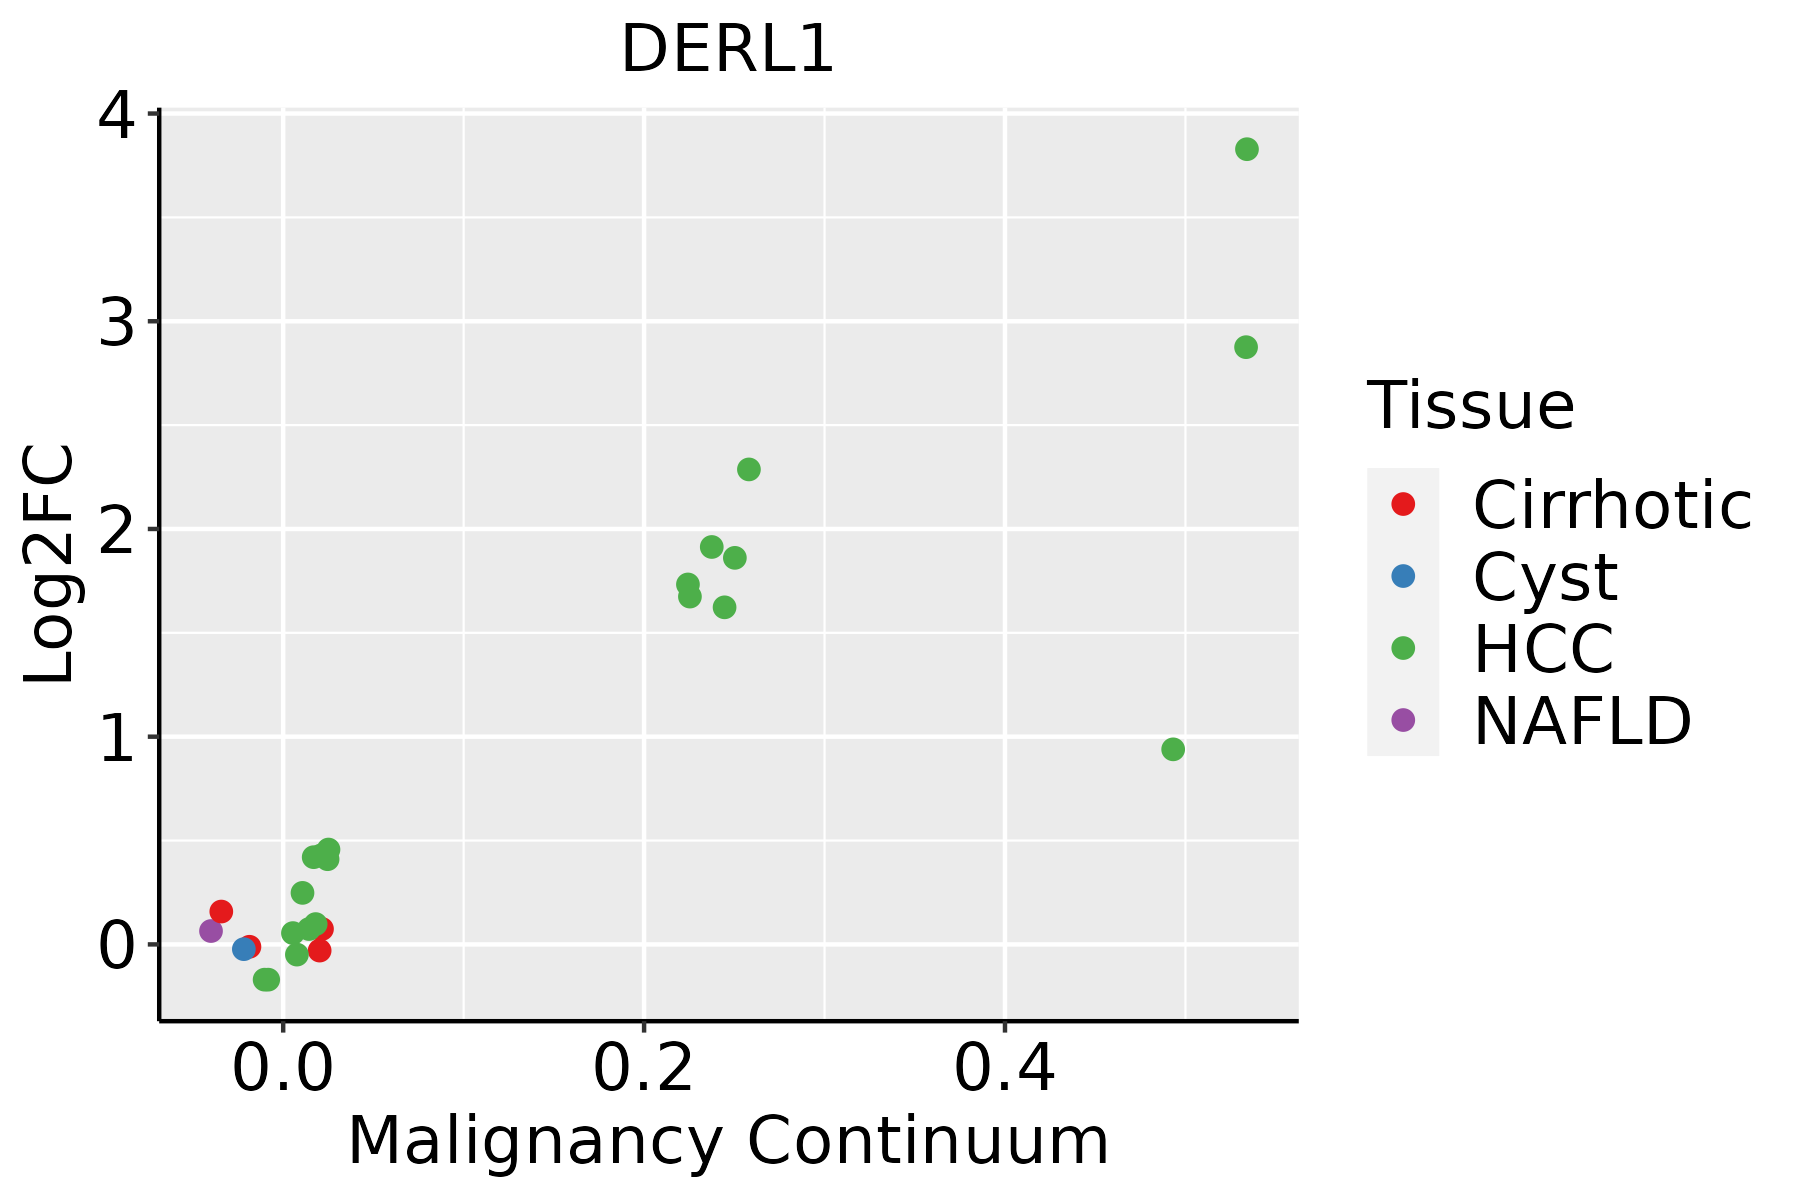 | HCC: Hepatocellular carcinoma |
| NAFLD: Non-alcoholic fatty liver disease | ||
| Oral Cavity | 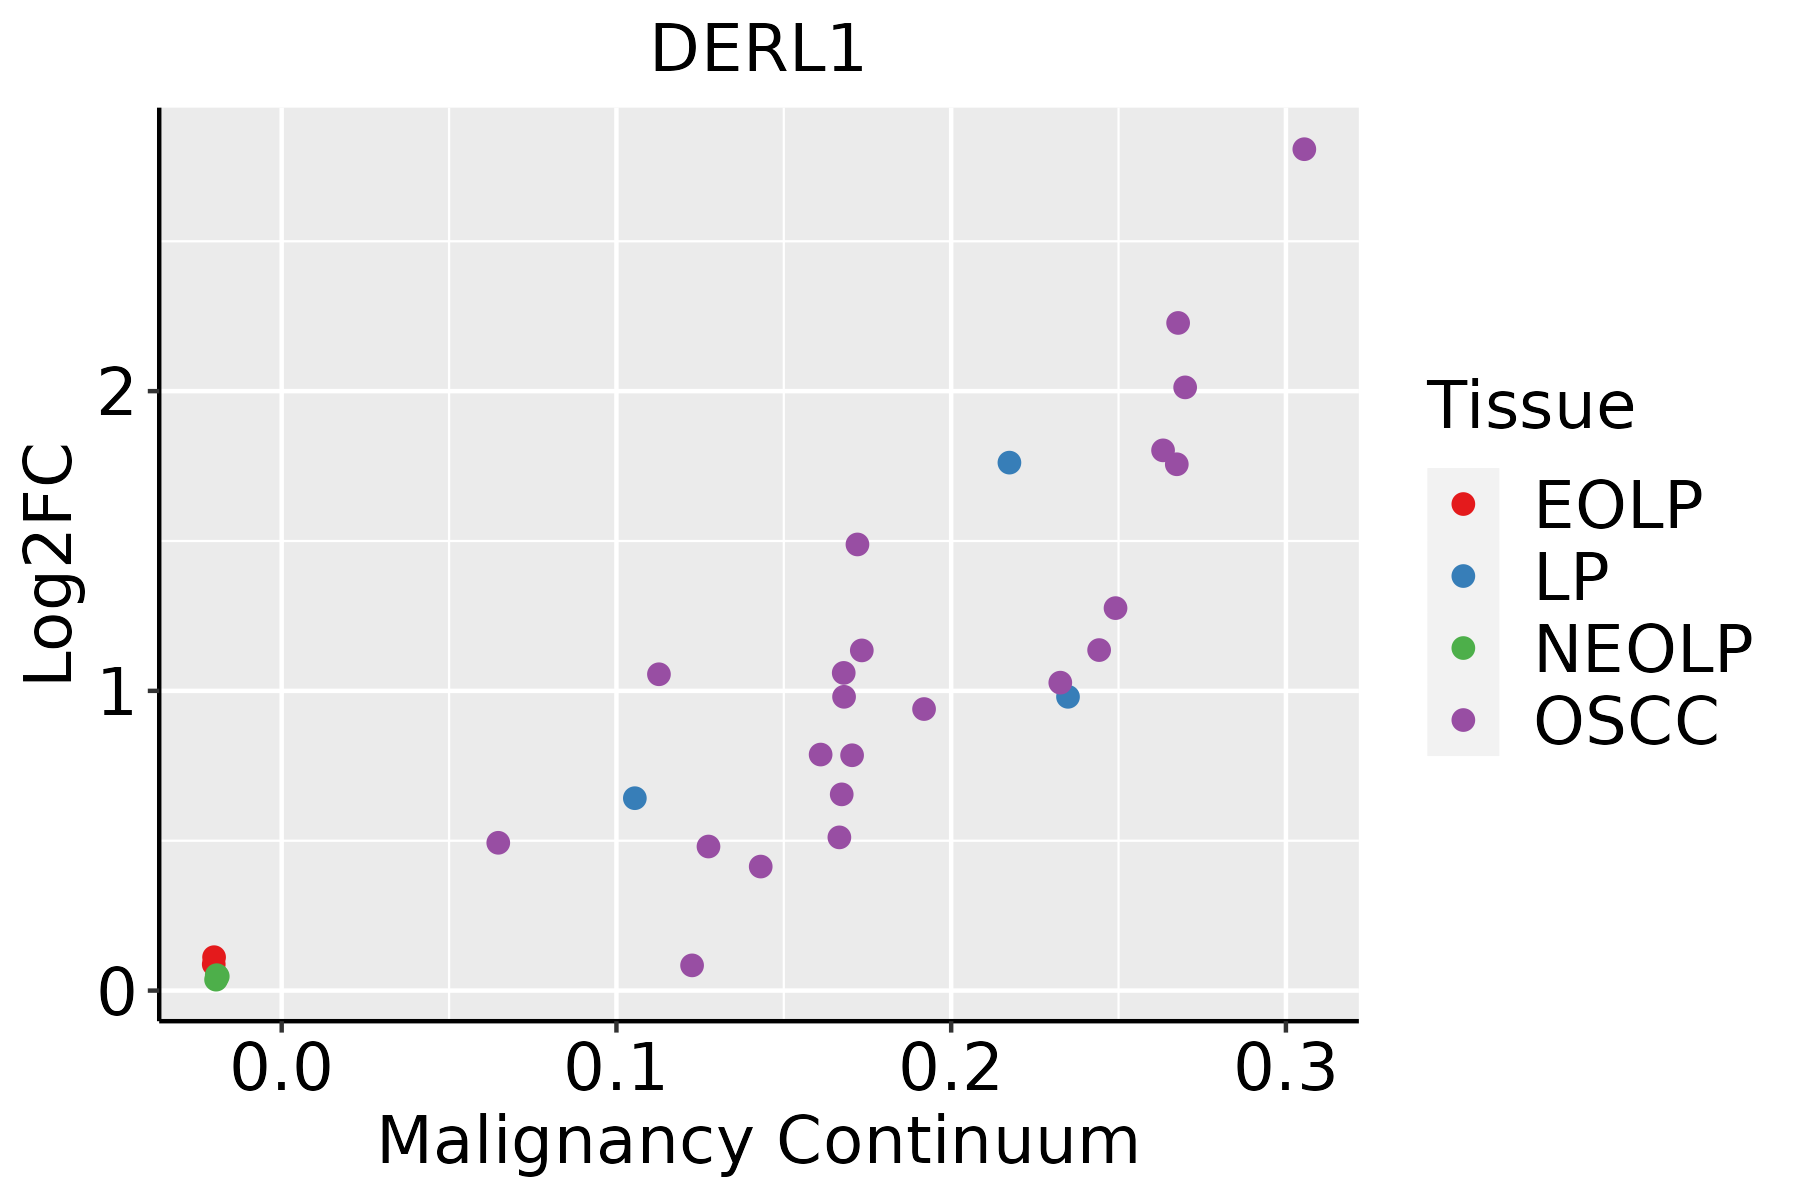 | EOLP: Erosive Oral lichen planus |
| LP: leukoplakia | ||
| NEOLP: Non-erosive oral lichen planus | ||
| OSCC: Oral squamous cell carcinoma | ||
| Skin |  | AK: Actinic keratosis |
| cSCC: Cutaneous squamous cell carcinoma | ||
| SCCIS:squamous cell carcinoma in situ | ||
| Thyroid | 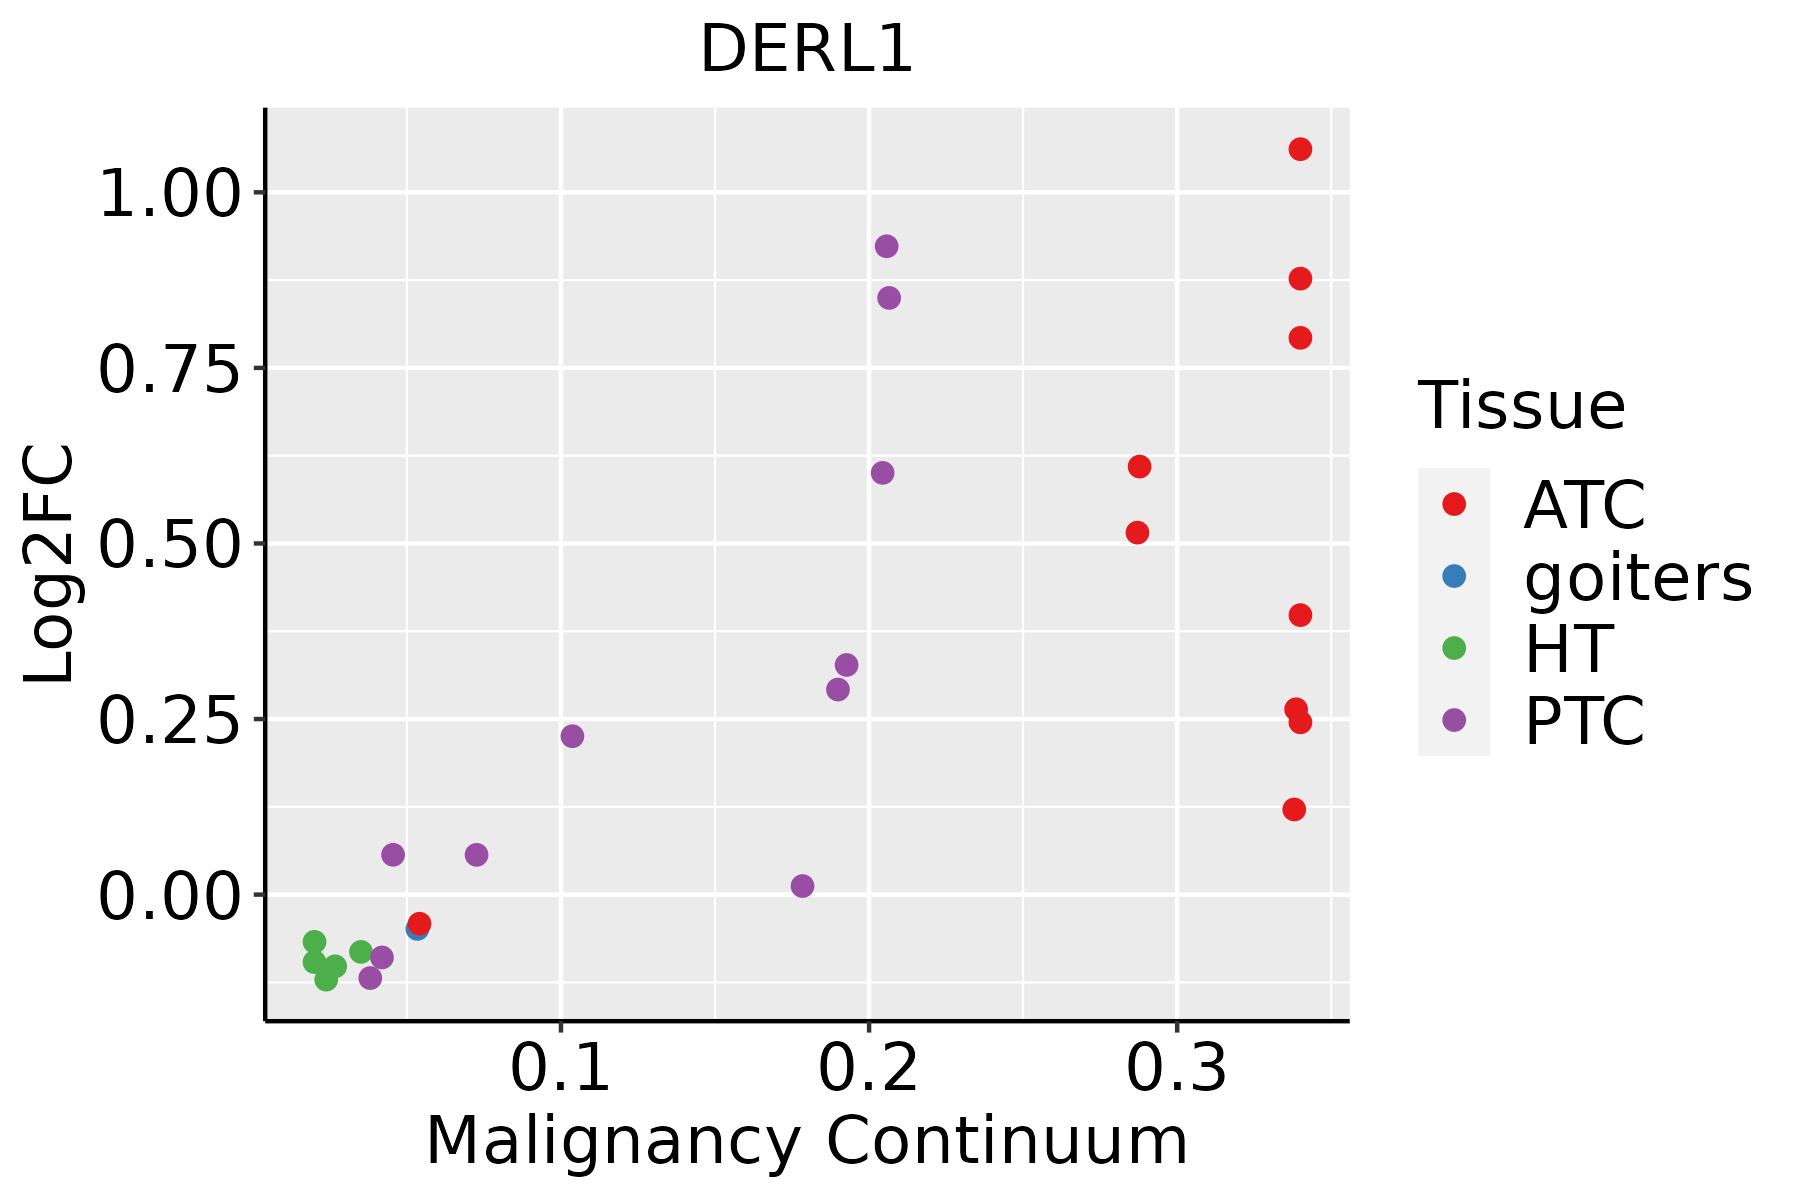 | ATC: Anaplastic thyroid cancer |
| HT: Hashimoto's thyroiditis | ||
| PTC: Papillary thyroid cancer |
| ∗log2FC in expression of this searched gene in stem-like cells from each diseased tissue sample relative to stem-like cells in normal samples in each tissue plotted against the malignancy continuum. Samples are colored based on if they are from different disease stage. |
Top |
Malignant transformation related pathway analysis |
| Find out the enriched GO biological processes and KEGG pathways involved in transition from healthy to precancer to cancer |
| Tissue | Disease Stage | Enriched GO biological Processes |
| Colorectum | AD |  |
| Colorectum | SER |  |
| Colorectum | MSS |  |
| Colorectum | MSI-H |  |
| Colorectum | FAP |  |
| ∗Top 15 enriched GO BP terms are showed in the bar plot of each disease state in each tissue. Each row represents a significant GO biological process which is colored according to the -log10(p.adjust). |
| Page: 1 2 3 4 5 6 7 8 9 |
| GO ID | Tissue | Disease Stage | Description | Gene Ratio | Bg Ratio | pvalue | p.adjust | Count |
| GO:003209215 | Oral cavity | LP | positive regulation of protein binding | 35/4623 | 85/18723 | 5.94e-04 | 5.44e-03 | 35 |
| GO:005178811 | Oral cavity | LP | response to misfolded protein | 14/4623 | 25/18723 | 7.95e-04 | 7.01e-03 | 14 |
| GO:007121812 | Oral cavity | LP | cellular response to misfolded protein | 12/4623 | 23/18723 | 4.14e-03 | 2.66e-02 | 12 |
| GO:190332026 | Oral cavity | EOLP | regulation of protein modification by small protein conjugation or removal | 73/2218 | 242/18723 | 1.41e-14 | 6.47e-12 | 73 |
| GO:003596624 | Oral cavity | EOLP | response to topologically incorrect protein | 54/2218 | 159/18723 | 1.93e-13 | 6.44e-11 | 54 |
| GO:000698624 | Oral cavity | EOLP | response to unfolded protein | 48/2218 | 137/18723 | 1.14e-12 | 2.52e-10 | 48 |
| GO:003139626 | Oral cavity | EOLP | regulation of protein ubiquitination | 62/2218 | 210/18723 | 3.86e-12 | 7.34e-10 | 62 |
| GO:001049825 | Oral cavity | EOLP | proteasomal protein catabolic process | 108/2218 | 490/18723 | 7.79e-11 | 9.51e-09 | 108 |
| GO:003164726 | Oral cavity | EOLP | regulation of protein stability | 75/2218 | 298/18723 | 1.22e-10 | 1.35e-08 | 75 |
| GO:003497624 | Oral cavity | EOLP | response to endoplasmic reticulum stress | 66/2218 | 256/18723 | 5.33e-10 | 4.31e-08 | 66 |
| GO:004316125 | Oral cavity | EOLP | proteasome-mediated ubiquitin-dependent protein catabolic process | 92/2218 | 412/18723 | 9.87e-10 | 6.96e-08 | 92 |
| GO:005109824 | Oral cavity | EOLP | regulation of binding | 79/2218 | 363/18723 | 4.86e-08 | 1.81e-06 | 79 |
| GO:003596724 | Oral cavity | EOLP | cellular response to topologically incorrect protein | 35/2218 | 116/18723 | 9.93e-08 | 3.40e-06 | 35 |
| GO:003252721 | Oral cavity | EOLP | protein exit from endoplasmic reticulum | 20/2218 | 48/18723 | 1.68e-07 | 5.43e-06 | 20 |
| GO:003462024 | Oral cavity | EOLP | cellular response to unfolded protein | 30/2218 | 96/18723 | 3.43e-07 | 1.01e-05 | 30 |
| GO:005109924 | Oral cavity | EOLP | positive regulation of binding | 42/2218 | 173/18723 | 3.81e-06 | 8.06e-05 | 42 |
| GO:004339323 | Oral cavity | EOLP | regulation of protein binding | 45/2218 | 196/18723 | 8.47e-06 | 1.61e-04 | 45 |
| GO:003097021 | Oral cavity | EOLP | retrograde protein transport, ER to cytosol | 13/2218 | 29/18723 | 9.41e-06 | 1.74e-04 | 13 |
| GO:190351321 | Oral cavity | EOLP | endoplasmic reticulum to cytosol transport | 13/2218 | 29/18723 | 9.41e-06 | 1.74e-04 | 13 |
| GO:190332221 | Oral cavity | EOLP | positive regulation of protein modification by small protein conjugation or removal | 33/2218 | 138/18723 | 5.51e-05 | 7.04e-04 | 33 |
| Page: 1 2 3 4 5 6 7 8 9 10 11 |
| Pathway ID | Tissue | Disease Stage | Description | Gene Ratio | Bg Ratio | pvalue | p.adjust | qvalue | Count |
| hsa04141211 | Esophagus | ESCC | Protein processing in endoplasmic reticulum | 147/4205 | 174/8465 | 3.29e-22 | 1.10e-19 | 5.64e-20 | 147 |
| hsa05014210 | Esophagus | ESCC | Amyotrophic lateral sclerosis | 266/4205 | 364/8465 | 1.31e-20 | 2.20e-18 | 1.13e-18 | 266 |
| hsa05022210 | Esophagus | ESCC | Pathways of neurodegeneration - multiple diseases | 318/4205 | 476/8465 | 6.10e-15 | 2.04e-13 | 1.05e-13 | 318 |
| hsa04141310 | Esophagus | ESCC | Protein processing in endoplasmic reticulum | 147/4205 | 174/8465 | 3.29e-22 | 1.10e-19 | 5.64e-20 | 147 |
| hsa0501438 | Esophagus | ESCC | Amyotrophic lateral sclerosis | 266/4205 | 364/8465 | 1.31e-20 | 2.20e-18 | 1.13e-18 | 266 |
| hsa0502238 | Esophagus | ESCC | Pathways of neurodegeneration - multiple diseases | 318/4205 | 476/8465 | 6.10e-15 | 2.04e-13 | 1.05e-13 | 318 |
| hsa0414122 | Liver | HCC | Protein processing in endoplasmic reticulum | 146/4020 | 174/8465 | 7.34e-24 | 2.46e-21 | 1.37e-21 | 146 |
| hsa0501422 | Liver | HCC | Amyotrophic lateral sclerosis | 252/4020 | 364/8465 | 8.85e-18 | 7.41e-16 | 4.12e-16 | 252 |
| hsa0502222 | Liver | HCC | Pathways of neurodegeneration - multiple diseases | 298/4020 | 476/8465 | 6.59e-12 | 1.30e-10 | 7.22e-11 | 298 |
| hsa0414132 | Liver | HCC | Protein processing in endoplasmic reticulum | 146/4020 | 174/8465 | 7.34e-24 | 2.46e-21 | 1.37e-21 | 146 |
| hsa0501432 | Liver | HCC | Amyotrophic lateral sclerosis | 252/4020 | 364/8465 | 8.85e-18 | 7.41e-16 | 4.12e-16 | 252 |
| hsa0502232 | Liver | HCC | Pathways of neurodegeneration - multiple diseases | 298/4020 | 476/8465 | 6.59e-12 | 1.30e-10 | 7.22e-11 | 298 |
| hsa0414130 | Oral cavity | OSCC | Protein processing in endoplasmic reticulum | 143/3704 | 174/8465 | 6.82e-26 | 2.28e-23 | 1.16e-23 | 143 |
| hsa0501428 | Oral cavity | OSCC | Amyotrophic lateral sclerosis | 246/3704 | 364/8465 | 6.65e-21 | 1.11e-18 | 5.67e-19 | 246 |
| hsa0502228 | Oral cavity | OSCC | Pathways of neurodegeneration - multiple diseases | 292/3704 | 476/8465 | 1.60e-15 | 4.47e-14 | 2.28e-14 | 292 |
| hsa04141113 | Oral cavity | OSCC | Protein processing in endoplasmic reticulum | 143/3704 | 174/8465 | 6.82e-26 | 2.28e-23 | 1.16e-23 | 143 |
| hsa05014112 | Oral cavity | OSCC | Amyotrophic lateral sclerosis | 246/3704 | 364/8465 | 6.65e-21 | 1.11e-18 | 5.67e-19 | 246 |
| hsa05022112 | Oral cavity | OSCC | Pathways of neurodegeneration - multiple diseases | 292/3704 | 476/8465 | 1.60e-15 | 4.47e-14 | 2.28e-14 | 292 |
| hsa0501429 | Oral cavity | LP | Amyotrophic lateral sclerosis | 197/2418 | 364/8465 | 1.25e-25 | 1.39e-23 | 8.93e-24 | 197 |
| hsa04141210 | Oral cavity | LP | Protein processing in endoplasmic reticulum | 113/2418 | 174/8465 | 8.74e-24 | 5.82e-22 | 3.76e-22 | 113 |
| Page: 1 2 |
Top |
Cell-cell communication analysis |
| Identification of potential cell-cell interactions between two cell types and their ligand-receptor pairs for different disease states |
| Ligand | Receptor | LRpair | Pathway | Tissue | Disease Stage |
| Page: 1 |
Top |
Single-cell gene regulatory network inference analysis |
| Find out the significant the regulons (TFs) and the target genes of each regulon across cell types for different disease states |
| TF | Cell Type | Tissue | Disease Stage | Target Gene | RSS | Regulon Activity |
| ∗The dot plots of a searched regulon are shown for all cell subpopulations in each disease state of each tissue based on the regulon specific score inferred using pySCENIC and by calculating the average expression. |
| Page: 1 |
Top |
Somatic mutation of malignant transformation related genes |
| Annotation of somatic variants for genes involved in malignant transformation |
| Hugo Symbol | Variant Class | Variant Classification | dbSNP RS | HGVSc | HGVSp | HGVSp Short | SWISSPROT | BIOTYPE | SIFT | PolyPhen | Tumor Sample Barcode | Tissue | Histology | Sex | Age | Stage | Therapy Types | Drugs | Outcome |
| DERL1 | SNV | Missense_Mutation | novel | c.532N>G | p.Leu178Val | p.L178V | Q9BUN8 | protein_coding | tolerated(0.14) | benign(0.163) | TCGA-AR-A1AQ-01 | Breast | breast invasive carcinoma | Female | <65 | I/II | Chemotherapy | doxorubicin | SD |
| DERL1 | insertion | Nonsense_Mutation | novel | c.640_641insTTCTCTTTACAAATTGAAAAAAAAAATCCTTATTTTGTATAAAG | p.Arg214IlefsTer6 | p.R214Ifs*6 | Q9BUN8 | protein_coding | TCGA-B6-A0IK-01 | Breast | breast invasive carcinoma | Female | <65 | III/IV | Unknown | Unknown | PD | ||
| DERL1 | SNV | Missense_Mutation | c.454N>A | p.Ala152Thr | p.A152T | Q9BUN8 | protein_coding | deleterious(0) | probably_damaging(0.996) | TCGA-DG-A2KH-01 | Cervix | cervical & endocervical cancer | Female | <65 | I/II | Unknown | Unknown | SD | |
| DERL1 | SNV | Missense_Mutation | c.502N>T | p.Gly168Cys | p.G168C | Q9BUN8 | protein_coding | deleterious(0) | probably_damaging(0.995) | TCGA-AD-5900-01 | Colorectum | colon adenocarcinoma | Male | >=65 | I/II | Unknown | Unknown | SD | |
| DERL1 | SNV | Missense_Mutation | c.188N>A | p.Pro63His | p.P63H | Q9BUN8 | protein_coding | deleterious(0) | probably_damaging(0.999) | TCGA-AY-6197-01 | Colorectum | colon adenocarcinoma | Male | <65 | I/II | Unknown | Unknown | SD | |
| DERL1 | SNV | Missense_Mutation | c.211N>A | p.Leu71Ile | p.L71I | Q9BUN8 | protein_coding | tolerated(0.2) | possibly_damaging(0.664) | TCGA-AZ-4315-01 | Colorectum | colon adenocarcinoma | Male | <65 | I/II | Unknown | Unknown | SD | |
| DERL1 | SNV | Missense_Mutation | novel | c.415N>T | p.Asp139Tyr | p.D139Y | Q9BUN8 | protein_coding | deleterious(0) | probably_damaging(0.992) | TCGA-F5-6814-01 | Colorectum | rectum adenocarcinoma | Male | <65 | I/II | Unknown | Unknown | SD |
| DERL1 | SNV | Missense_Mutation | rs751887904 | c.605C>T | p.Thr202Ile | p.T202I | Q9BUN8 | protein_coding | deleterious(0.01) | probably_damaging(0.982) | TCGA-A5-A0G2-01 | Endometrium | uterine corpus endometrioid carcinoma | Female | <65 | III/IV | Unknown | Unknown | SD |
| DERL1 | SNV | Missense_Mutation | novel | c.527G>T | p.Gly176Val | p.G176V | Q9BUN8 | protein_coding | deleterious(0) | probably_damaging(1) | TCGA-A5-A1OF-01 | Endometrium | uterine corpus endometrioid carcinoma | Female | <65 | I/II | Unknown | Unknown | SD |
| DERL1 | SNV | Missense_Mutation | c.405N>T | p.Gln135His | p.Q135H | Q9BUN8 | protein_coding | deleterious(0.02) | possibly_damaging(0.706) | TCGA-AP-A051-01 | Endometrium | uterine corpus endometrioid carcinoma | Female | >=65 | I/II | Unknown | Unknown | SD |
| Page: 1 2 3 |
Top |
Related drugs of malignant transformation related genes |
| Identification of chemicals and drugs interact with genes involved in malignant transfromation |
| (DGIdb 4.0) |
| Entrez ID | Symbol | Category | Interaction Types | Drug Claim Name | Drug Name | PMIDs |
| Page: 1 |

Copyright 2023-Present -The University of Texas Health Science Center at Houston |