Schematic overview of the cellular and molecular mechanisms involved in the cancer progression, including the proposed cellular and molecular mechanisms in cancer cells trajectory. AT1: alveolar type 1 cells; AT2: alveolar type 2 cells; AAH: atypical adenomatous hyperplasia; AIS: adenocarcinoma in situ; MIA: minimally invasive adenocarcinoma; IA: invasive adenocarcinoma; EMT: epithelial-mesenchymal transition

Home

Download

Statistics

Help

Contact

Center for Computational Systems Medicine
leaf

Gene summary

leaf

Malignant transformation analysis

leaf

Malignant transformation related pathway analysis

leaf

Cell-cell communication analysis

leaf

Single-cell gene regulatory network inference analysis

leaf

Somatic mutation of malignant transformation related genes

leaf

Related drugs of malignant transformation related genes

Gene: DENND4C

Gene summary for DENND4C

check button Gene summary.

Gene informationSpeciesHuman
Gene symbol

DENND4C

Gene ID

55667

Gene nameDENN domain containing 4C
Gene AliasC9orf55
Cytomap9p22.1
Gene Typeprotein-coding
GO ID

GO:0006810

UniProtAcc

Q5VZ89


Top

Malignant transformation analysis

check button Identification of the aberrant gene expression in precancerous and cancerous lesions by comparing the gene expression of stem-like cells in diseased tissues with normal stem cells
check button Malignant transformation involving gene list.
Entrez IDSymbolReplicatesSpeciesOrganTissueAdj P-valueLog2FCMalignancy
55667DENND4CCCI_1HumanCervixCC9.71e-045.81e-010.528
55667DENND4CCCI_2HumanCervixCC1.50e-081.13e+000.5249
55667DENND4CCCI_3HumanCervixCC1.44e-087.96e-010.516
55667DENND4CHTA11_347_2000001011HumanColorectumAD8.10e-115.74e-01-0.1954
55667DENND4CHTA11_99999965104_69814HumanColorectumMSS1.14e-025.73e-010.281
55667DENND4CHTA11_99999974143_84620HumanColorectumMSS1.47e-03-3.49e-010.3005
55667DENND4CA002-C-010HumanColorectumFAP3.23e-024.66e-020.242
55667DENND4CA001-C-207HumanColorectumFAP4.08e-03-1.46e-010.1278
55667DENND4CA015-C-203HumanColorectumFAP1.33e-34-3.50e-01-0.1294
55667DENND4CA015-C-204HumanColorectumFAP5.88e-07-3.27e-01-0.0228
55667DENND4CA014-C-040HumanColorectumFAP3.24e-03-2.28e-01-0.1184
55667DENND4CA002-C-201HumanColorectumFAP1.70e-13-2.98e-010.0324
55667DENND4CA002-C-203HumanColorectumFAP1.29e-03-9.22e-020.2786
55667DENND4CA001-C-119HumanColorectumFAP6.02e-06-2.52e-01-0.1557
55667DENND4CA001-C-108HumanColorectumFAP4.40e-18-1.63e-01-0.0272
55667DENND4CA002-C-205HumanColorectumFAP1.43e-23-4.11e-01-0.1236
55667DENND4CA001-C-104HumanColorectumFAP3.70e-02-1.14e-010.0184
55667DENND4CA015-C-005HumanColorectumFAP5.02e-03-2.85e-01-0.0336
55667DENND4CA015-C-006HumanColorectumFAP3.11e-19-5.17e-01-0.0994
55667DENND4CA015-C-106HumanColorectumFAP4.96e-12-1.61e-01-0.0511
Page: 1 2 3 4 5 6 7 8 

check button Transcriptomic changes along malignancy continuum.
TissueExpression DynamicsAbbreviation
CervixThe image shows the transcriptomic changes along malignancy continuum.log2FC in expression of this searched gene in stem-like cells from each diseased tissue sample relative to stem-like cells in normal samples in each tissue plotted against the malignancy continuum. Samples are colored based on if they are from different disease stage.CC: Cervix cancer
HSIL_HPV: HPV-infected high-grade squamous intraepithelial lesions
N_HPV: HPV-infected normal cervix
Colorectum (GSE201348)The image shows the transcriptomic changes along malignancy continuum.log2FC in expression of this searched gene in stem-like cells from each diseased tissue sample relative to stem-like cells in normal samples in each tissue plotted against the malignancy continuum. Samples are colored based on if they are from different disease stage.FAP: Familial adenomatous polyposis
CRC: Colorectal cancer
Colorectum (HTA11)The image shows the transcriptomic changes along malignancy continuum.log2FC in expression of this searched gene in stem-like cells from each diseased tissue sample relative to stem-like cells in normal samples in each tissue plotted against the malignancy continuum. Samples are colored based on if they are from different disease stage.AD: Adenomas
SER: Sessile serrated lesions
MSI-H: Microsatellite-high colorectal cancer
MSS: Microsatellite stable colorectal cancer
EsophagusThe image shows the transcriptomic changes along malignancy continuum.log2FC in expression of this searched gene in stem-like cells from each diseased tissue sample relative to stem-like cells in normal samples in each tissue plotted against the malignancy continuum. Samples are colored based on if they are from different disease stage.ESCC: Esophageal squamous cell carcinoma
HGIN: High-grade intraepithelial neoplasias
LGIN: Low-grade intraepithelial neoplasias
LiverThe image shows the transcriptomic changes along malignancy continuum.log2FC in expression of this searched gene in stem-like cells from each diseased tissue sample relative to stem-like cells in normal samples in each tissue plotted against the malignancy continuum. Samples are colored based on if they are from different disease stage.
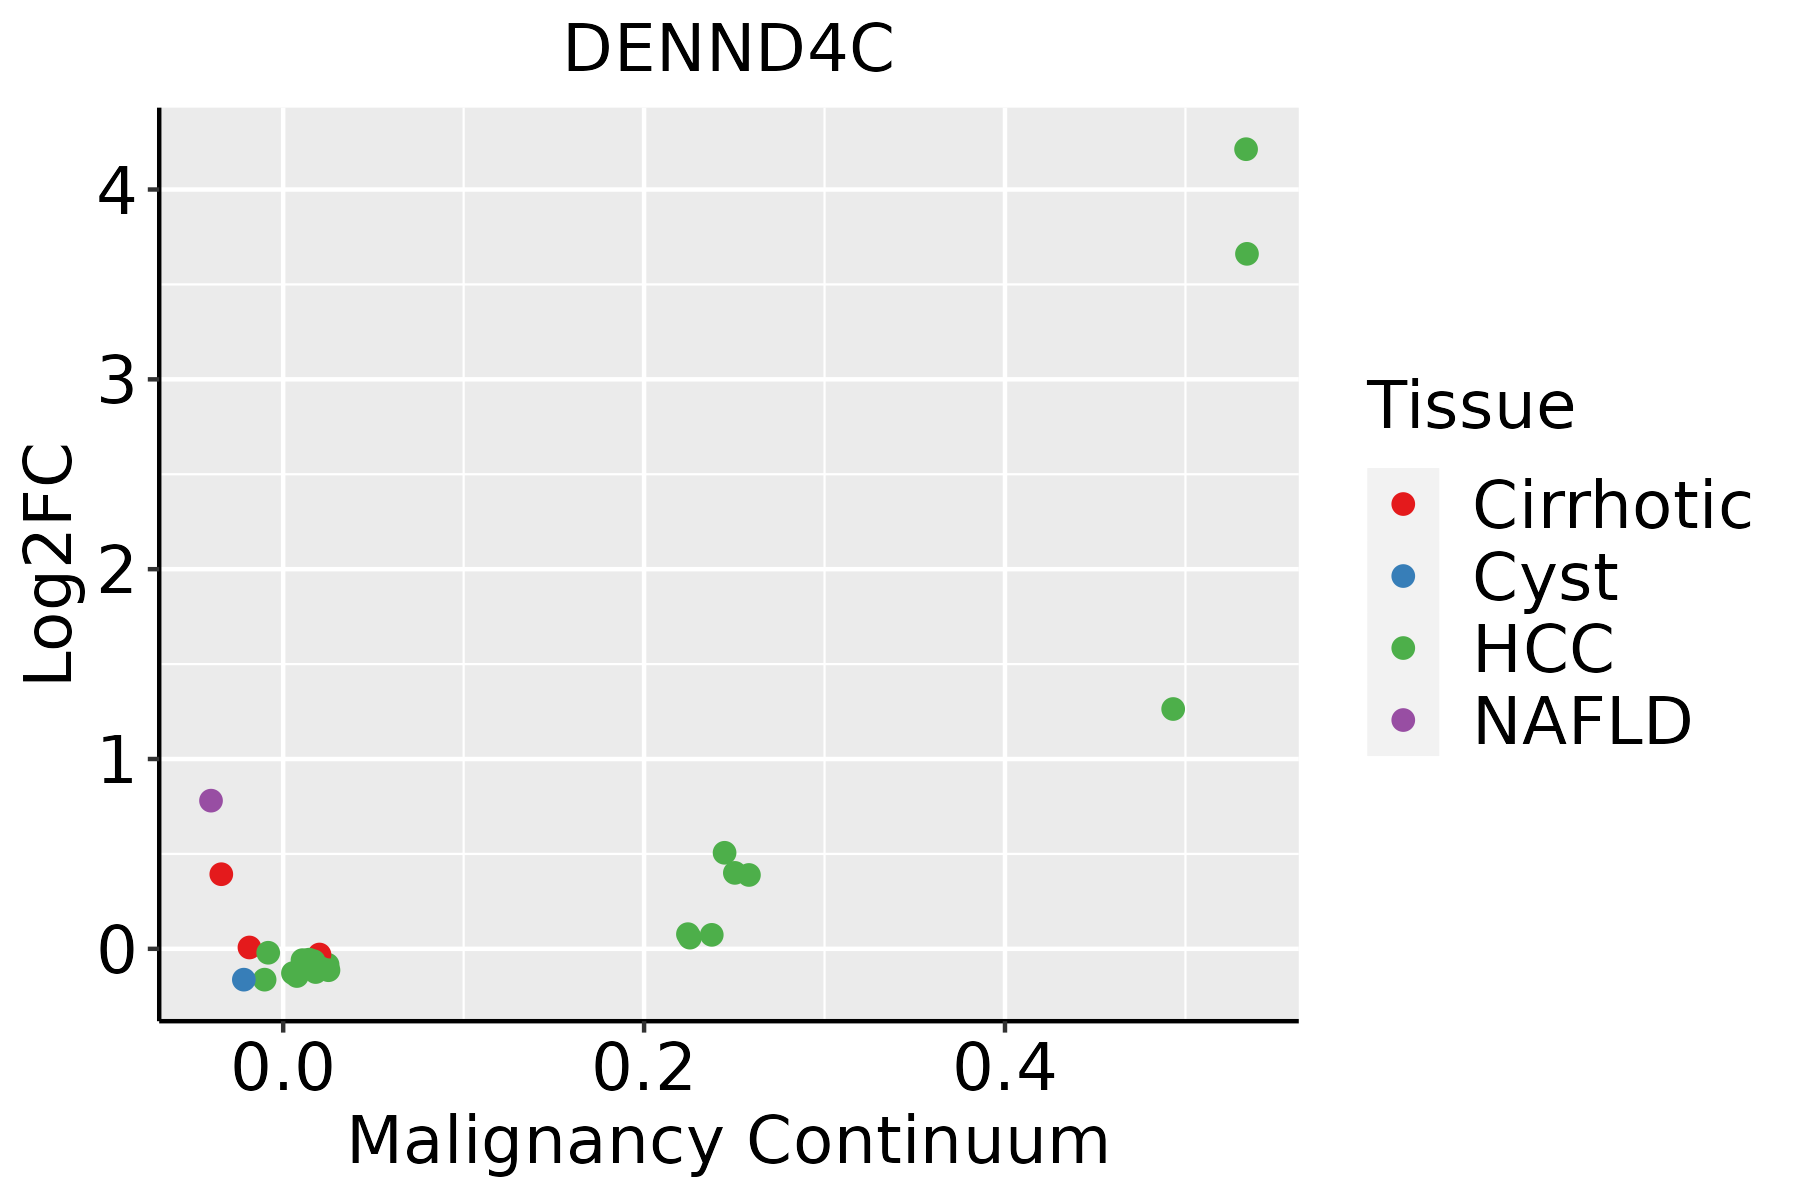
HCC: Hepatocellular carcinoma
NAFLD: Non-alcoholic fatty liver disease
LungThe image shows the transcriptomic changes along malignancy continuum.log2FC in expression of this searched gene in stem-like cells from each diseased tissue sample relative to stem-like cells in normal samples in each tissue plotted against the malignancy continuum. Samples are colored based on if they are from different disease stage.
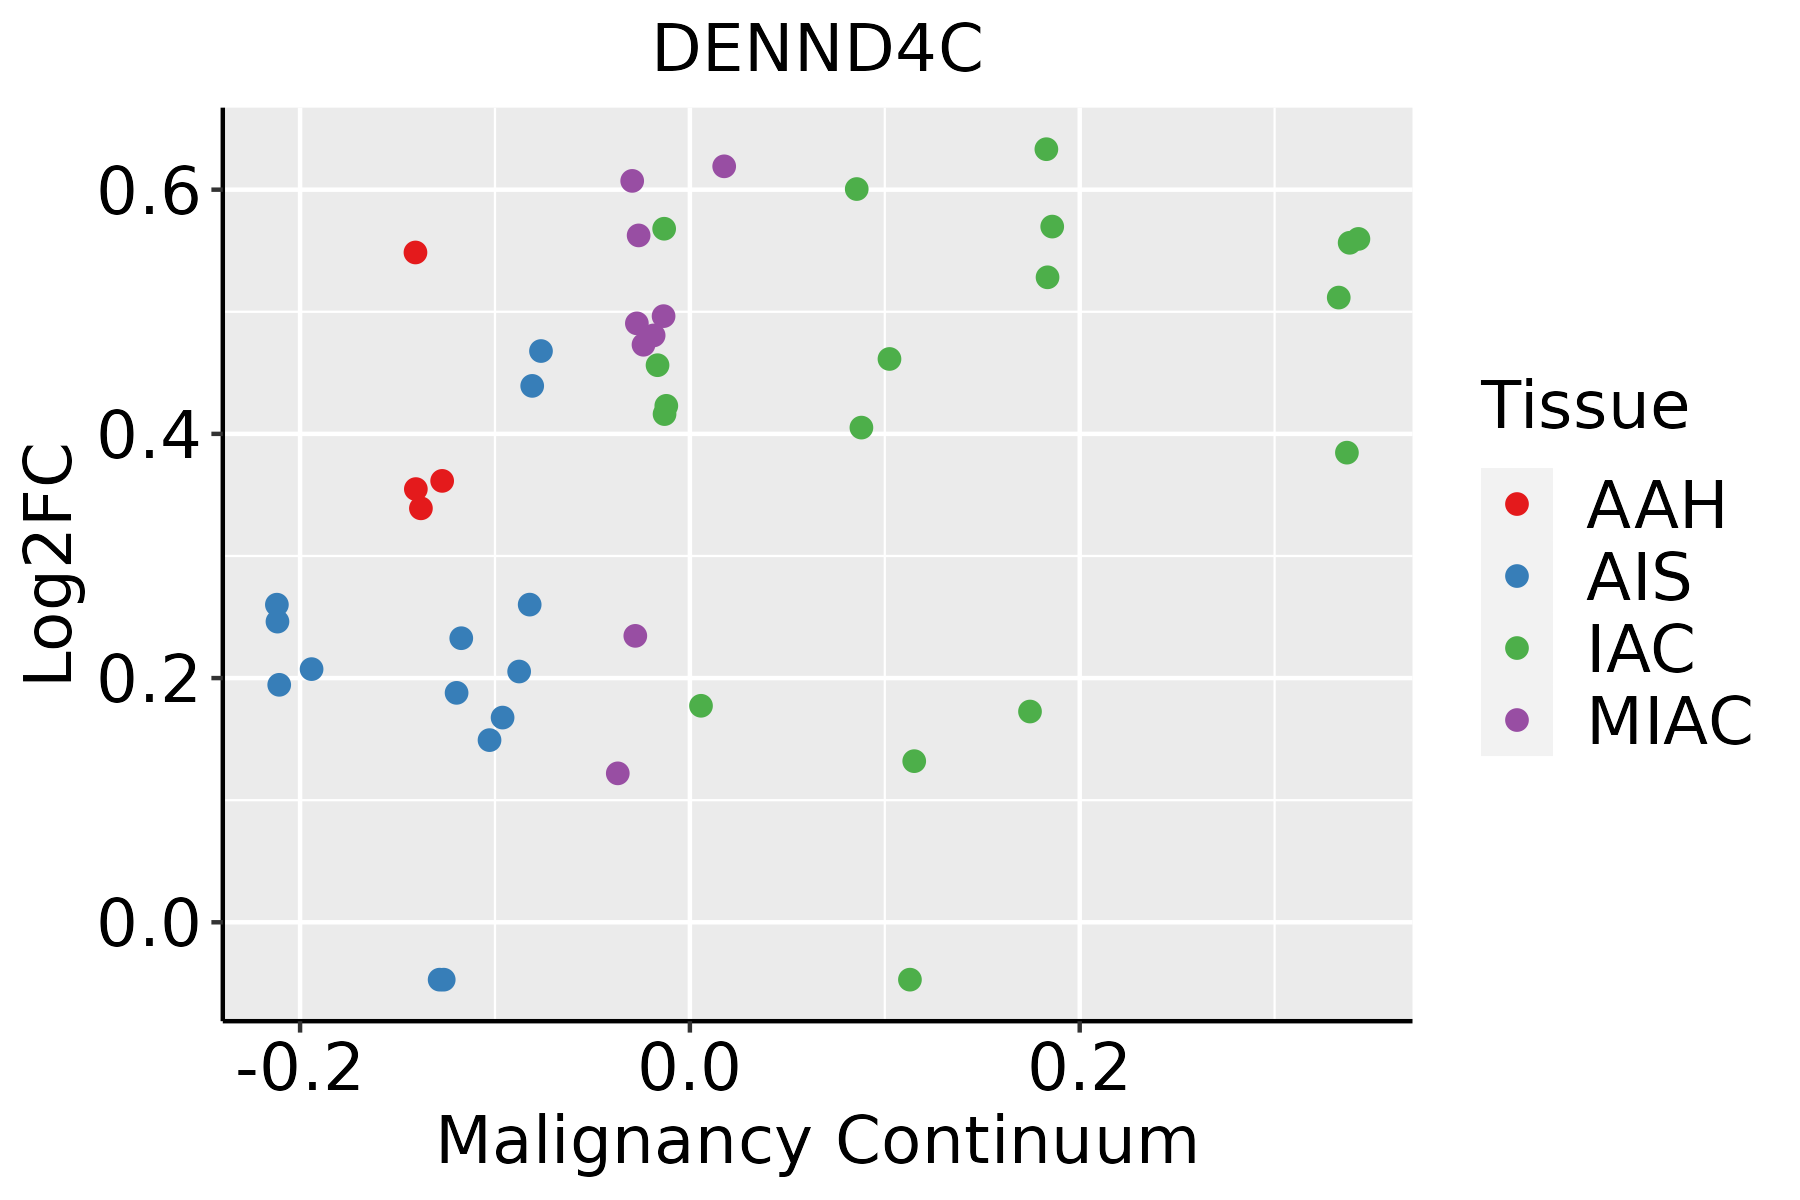
AAH: Atypical adenomatous hyperplasia
AIS: Adenocarcinoma in situ
IAC: Invasive lung adenocarcinoma
MIA: Minimally invasive adenocarcinoma
ProstateThe image shows the transcriptomic changes along malignancy continuum.log2FC in expression of this searched gene in stem-like cells from each diseased tissue sample relative to stem-like cells in normal samples in each tissue plotted against the malignancy continuum. Samples are colored based on if they are from different disease stage.
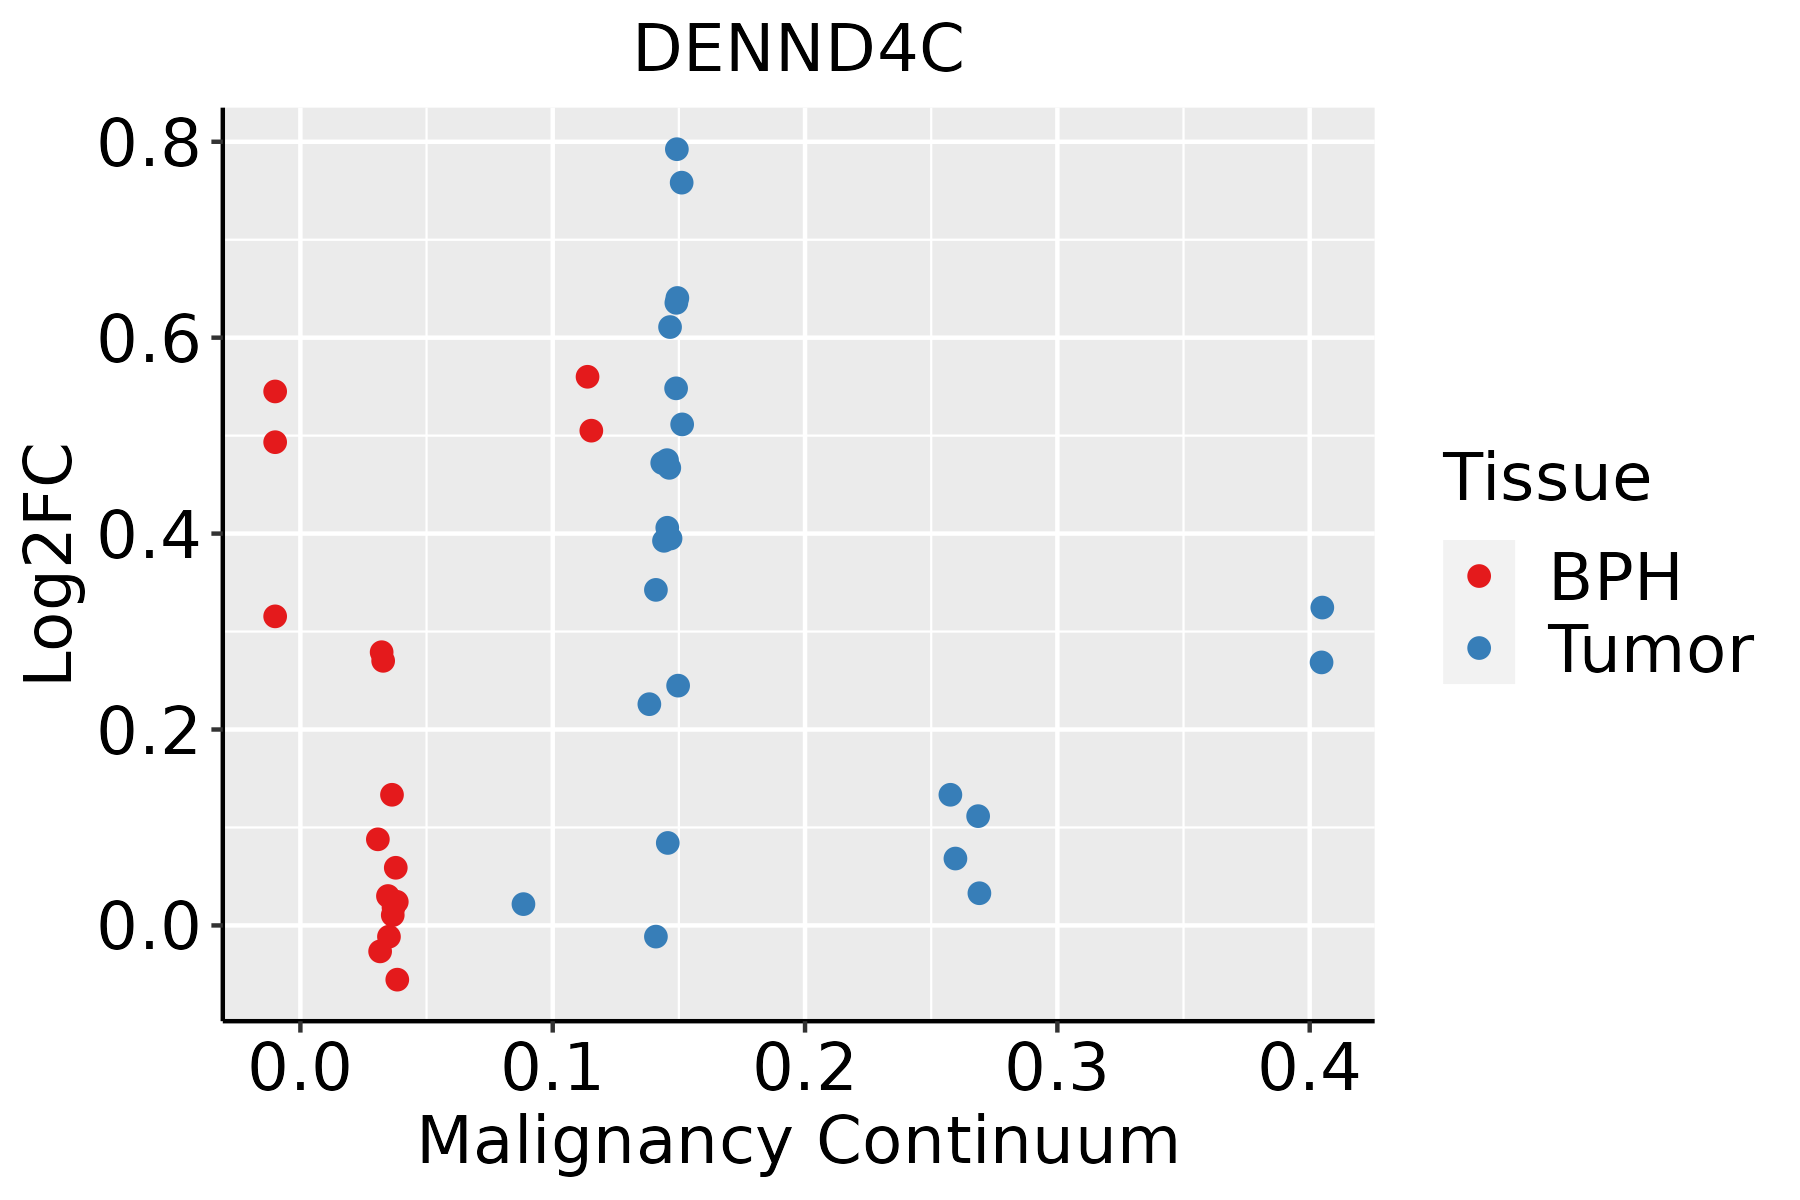
BPH: Benign Prostatic Hyperplasia
SkinThe image shows the transcriptomic changes along malignancy continuum.log2FC in expression of this searched gene in stem-like cells from each diseased tissue sample relative to stem-like cells in normal samples in each tissue plotted against the malignancy continuum. Samples are colored based on if they are from different disease stage.AK: Actinic keratosis
cSCC: Cutaneous squamous cell carcinoma
SCCIS:squamous cell carcinoma in situ
ThyroidThe image shows the transcriptomic changes along malignancy continuum.log2FC in expression of this searched gene in stem-like cells from each diseased tissue sample relative to stem-like cells in normal samples in each tissue plotted against the malignancy continuum. Samples are colored based on if they are from different disease stage.ATC: Anaplastic thyroid cancer
HT: Hashimoto's thyroiditis
PTC: Papillary thyroid cancer
∗log2FC in expression of this searched gene in stem-like cells from each diseased tissue sample relative to stem-like cells in normal samples in each tissue plotted against the malignancy continuum. Samples are colored based on if they are from different disease stage.

Top

Malignant transformation related pathway analysis

check buttonFind out the enriched GO biological processes and KEGG pathways involved in transition from healthy to precancer to cancer
check button Figure of enriched GO biological processes.
TissueDisease StageEnriched GO biological Processes
ColorectumADGO analysis - Figure of enriched GO biological processes: Top 15 enriched GO BP terms are showed in the bar plot of each disease state in each tissue. Each row represents a significant GO biological process which is colored according to the -log10(p.adjust).
ColorectumSERGO analysis - Figure of enriched GO biological processes: Top 15 enriched GO BP terms are showed in the bar plot of each disease state in each tissue. Each row represents a significant GO biological process which is colored according to the -log10(p.adjust).
ColorectumMSSGO analysis - Figure of enriched GO biological processes: Top 15 enriched GO BP terms are showed in the bar plot of each disease state in each tissue. Each row represents a significant GO biological process which is colored according to the -log10(p.adjust).
ColorectumMSI-HGO analysis - Figure of enriched GO biological processes: Top 15 enriched GO BP terms are showed in the bar plot of each disease state in each tissue. Each row represents a significant GO biological process which is colored according to the -log10(p.adjust).
ColorectumFAPGO analysis - Figure of enriched GO biological processes: Top 15 enriched GO BP terms are showed in the bar plot of each disease state in each tissue. Each row represents a significant GO biological process which is colored according to the -log10(p.adjust).
∗Top 15 enriched GO BP terms are showed in the bar plot of each disease state in each tissue. Each row represents a significant GO biological process which is colored according to the -log10(p.adjust).
Page: 1 2 3 4 5 6 7 8 9 

check button Enriched GO biological processes.
GO IDTissueDisease StageDescriptionGene RatioBg Ratiopvaluep.adjustCount
GO:190165310ProstateBPHcellular response to peptide104/3107359/187232.51e-091.00e-07104
GO:199077810ProstateBPHprotein localization to cell periphery95/3107333/187232.78e-088.13e-0795
GO:004343417ProstateBPHresponse to peptide hormone109/3107414/187232.73e-075.91e-06109
GO:00713759ProstateBPHcellular response to peptide hormone stimulus82/3107290/187233.65e-077.65e-0682
GO:003286910ProstateBPHcellular response to insulin stimulus61/3107203/187231.26e-062.20e-0561
GO:003286810ProstateBPHresponse to insulin73/3107264/187233.80e-065.83e-0573
GO:00510568ProstateBPHregulation of small GTPase mediated signal transduction78/3107302/187232.69e-053.16e-0478
GO:00465787ProstateBPHregulation of Ras protein signal transduction53/3107189/187235.08e-055.24e-0453
GO:007265917ProstateTumorprotein localization to plasma membrane90/3246284/187232.07e-098.99e-0890
GO:000726514ProstateTumorRas protein signal transduction101/3246337/187236.29e-092.44e-07101
GO:190165315ProstateTumorcellular response to peptide104/3246359/187232.71e-088.90e-07104
GO:199077815ProstateTumorprotein localization to cell periphery97/3246333/187235.88e-081.75e-0697
GO:004343418ProstateTumorresponse to peptide hormone113/3246414/187232.24e-075.42e-06113
GO:007137514ProstateTumorcellular response to peptide hormone stimulus83/3246290/187231.14e-062.16e-0583
GO:003286915ProstateTumorcellular response to insulin stimulus63/3246203/187231.15e-062.18e-0563
GO:003286815ProstateTumorresponse to insulin75/3246264/187234.94e-067.68e-0575
GO:005105613ProstateTumorregulation of small GTPase mediated signal transduction80/3246302/187233.96e-054.57e-0480
GO:004657814ProstateTumorregulation of Ras protein signal transduction53/3246189/187231.63e-041.46e-0353
GO:000726516SkinAKRas protein signal transduction68/1910337/187232.83e-081.57e-0668
GO:007265925SkinAKprotein localization to plasma membrane59/1910284/187238.01e-083.80e-0659
Page: 1 2 3 4 5 6 7 8 9 

check button Enriched KEGG pathways.
Pathway IDTissueDisease StageDescriptionGene RatioBg Ratiopvaluep.adjustqvalueCount
Page: 1 

Top

Cell-cell communication analysis

check buttonIdentification of potential cell-cell interactions between two cell types and their ligand-receptor pairs for different disease states
LigandReceptorLRpairPathwayTissueDisease Stage
Page: 1 

Top

Single-cell gene regulatory network inference analysis

check buttonFind out the significant the regulons (TFs) and the target genes of each regulon across cell types for different disease states
TFCell TypeTissueDisease StageTarget GeneRSSRegulon Activity
∗The dot plots of a searched regulon are shown for all cell subpopulations in each disease state of each tissue based on the regulon specific score inferred using pySCENIC and by calculating the average expression.
Page: 1 

Top

Somatic mutation of malignant transformation related genes

check buttonAnnotation of somatic variants for genes involved in malignant transformation
Hugo SymbolVariant ClassVariant ClassificationdbSNP RSHGVScHGVSpHGVSp ShortSWISSPROTBIOTYPESIFTPolyPhenTumor Sample BarcodeTissueHistologySexAgeStageTherapy TypesDrugsOutcome
DENND4CSNVMissense_Mutationc.950N>Tp.Ser317Leup.S317Lprotein_codingdeleterious(0)probably_damaging(1)TCGA-A2-A0T2-01Breastbreast invasive carcinomaFemale>=65III/IVChemotherapyxelodaPD
DENND4CSNVMissense_Mutationc.2723N>Gp.Ser908Cysp.S908Cprotein_codingdeleterious(0.02)possibly_damaging(0.754)TCGA-AC-A23H-01Breastbreast invasive carcinomaFemale>=65I/IIUnknownUnknownPD
DENND4CSNVMissense_Mutationc.1828N>Tp.Arg610Cysp.R610Cprotein_codingdeleterious(0)probably_damaging(1)TCGA-AN-A046-01Breastbreast invasive carcinomaFemale>=65I/IIUnknownUnknownSD
DENND4CSNVMissense_Mutationc.5516N>Tp.Arg1839Metp.R1839Mprotein_codingdeleterious(0)probably_damaging(0.975)TCGA-BH-A0AY-01Breastbreast invasive carcinomaFemale<65I/IIChemotherapySD
DENND4CSNVMissense_Mutationc.2254G>Ap.Glu752Lysp.E752Kprotein_codingdeleterious(0)probably_damaging(0.999)TCGA-BH-A1FN-01Breastbreast invasive carcinomaFemale<65I/IIUnknownUnknownPD
DENND4CSNVMissense_Mutationc.3698G>Cp.Ser1233Thrp.S1233Tprotein_codingdeleterious(0.01)possibly_damaging(0.831)TCGA-C8-A27B-01Breastbreast invasive carcinomaFemale<65I/IIChemotherapy5-fluorouracilCR
DENND4CinsertionFrame_Shift_Insnovelc.3706_3707insATp.Gly1236AspfsTer16p.G1236Dfs*16protein_codingTCGA-A8-A07R-01Breastbreast invasive carcinomaFemale>=65III/IVAncillaryzoledronicSD
DENND4CinsertionNonsense_Mutationnovelc.3707_3708insAGAATCCTAAATATGAAp.Ile1237GlufsTer3p.I1237Efs*3protein_codingTCGA-A8-A07R-01Breastbreast invasive carcinomaFemale>=65III/IVAncillaryzoledronicSD
DENND4CinsertionFrame_Shift_Insnovelc.1458_1459insTACTCTCTGAACCCTCAGCTGTACCACTGCTGTACTTAp.Ile487TyrfsTer13p.I487Yfs*13protein_codingTCGA-AO-A128-01Breastbreast invasive carcinomaFemale<65I/IIChemotherapydoxorubicinSD
DENND4CSNVMissense_Mutationrs772654971c.1702N>Tp.Arg568Cysp.R568Cprotein_codingtolerated(0.15)probably_damaging(0.928)TCGA-2W-A8YY-01Cervixcervical & endocervical cancerFemale<65I/IIChemotherapycisplatinCR
Page: 1 2 3 4 5 6 7 8 9 10 11 12 13 14 15 16 17 

Top

Related drugs of malignant transformation related genes

check buttonIdentification of chemicals and drugs interact with genes involved in malignant transfromation
(DGIdb 4.0)
Entrez IDSymbolCategoryInteraction TypesDrug Claim NameDrug NamePMIDs
Page: 1