
|
|||||
|
 | |
| |
| |
| |
| |
| |
|
Gene: DECR1 |
Gene summary for DECR1 |
| Gene information | Species | Human | Gene symbol | DECR1 | Gene ID | 1666 |
| Gene name | 2,4-dienoyl-CoA reductase 1 | |
| Gene Alias | DECR | |
| Cytomap | 8q21.3 | |
| Gene Type | protein-coding | GO ID | GO:0001659 | UniProtAcc | Q16698 |
Top |
Malignant transformation analysis |
| Identification of the aberrant gene expression in precancerous and cancerous lesions by comparing the gene expression of stem-like cells in diseased tissues with normal stem cells |
| Entrez ID | Symbol | Replicates | Species | Organ | Tissue | Adj P-value | Log2FC | Malignancy |
| 1666 | DECR1 | HTA11_347_2000001011 | Human | Colorectum | AD | 9.91e-11 | 5.55e-01 | -0.1954 |
| 1666 | DECR1 | HTA11_99999965104_69814 | Human | Colorectum | MSS | 8.48e-03 | 4.84e-01 | 0.281 |
| 1666 | DECR1 | A001-C-207 | Human | Colorectum | FAP | 2.55e-02 | -1.54e-01 | 0.1278 |
| 1666 | DECR1 | A015-C-203 | Human | Colorectum | FAP | 2.31e-16 | -3.69e-01 | -0.1294 |
| 1666 | DECR1 | A015-C-204 | Human | Colorectum | FAP | 9.07e-05 | -2.14e-01 | -0.0228 |
| 1666 | DECR1 | A014-C-040 | Human | Colorectum | FAP | 1.85e-02 | -3.70e-01 | -0.1184 |
| 1666 | DECR1 | A002-C-201 | Human | Colorectum | FAP | 2.23e-07 | -2.44e-01 | 0.0324 |
| 1666 | DECR1 | A002-C-203 | Human | Colorectum | FAP | 1.33e-03 | -2.32e-01 | 0.2786 |
| 1666 | DECR1 | A001-C-119 | Human | Colorectum | FAP | 4.18e-05 | -4.02e-01 | -0.1557 |
| 1666 | DECR1 | A001-C-108 | Human | Colorectum | FAP | 1.29e-08 | -2.57e-01 | -0.0272 |
| 1666 | DECR1 | A002-C-205 | Human | Colorectum | FAP | 3.74e-15 | -3.54e-01 | -0.1236 |
| 1666 | DECR1 | A015-C-005 | Human | Colorectum | FAP | 1.89e-03 | -2.55e-01 | -0.0336 |
| 1666 | DECR1 | A015-C-006 | Human | Colorectum | FAP | 9.84e-11 | -3.13e-01 | -0.0994 |
| 1666 | DECR1 | A015-C-106 | Human | Colorectum | FAP | 1.33e-07 | -3.28e-01 | -0.0511 |
| 1666 | DECR1 | A002-C-114 | Human | Colorectum | FAP | 1.91e-12 | -3.34e-01 | -0.1561 |
| 1666 | DECR1 | A015-C-104 | Human | Colorectum | FAP | 8.49e-15 | -3.22e-01 | -0.1899 |
| 1666 | DECR1 | A001-C-014 | Human | Colorectum | FAP | 1.36e-05 | -1.96e-01 | 0.0135 |
| 1666 | DECR1 | A002-C-016 | Human | Colorectum | FAP | 4.84e-08 | -2.39e-01 | 0.0521 |
| 1666 | DECR1 | A015-C-002 | Human | Colorectum | FAP | 1.34e-06 | -3.06e-01 | -0.0763 |
| 1666 | DECR1 | A002-C-116 | Human | Colorectum | FAP | 5.34e-19 | -3.73e-01 | -0.0452 |
| Page: 1 2 3 4 5 6 7 8 9 |
| Tissue | Expression Dynamics | Abbreviation |
| Colorectum (GSE201348) |  | FAP: Familial adenomatous polyposis |
| CRC: Colorectal cancer | ||
| Colorectum (HTA11) |  | AD: Adenomas |
| SER: Sessile serrated lesions | ||
| MSI-H: Microsatellite-high colorectal cancer | ||
| MSS: Microsatellite stable colorectal cancer | ||
| Esophagus | 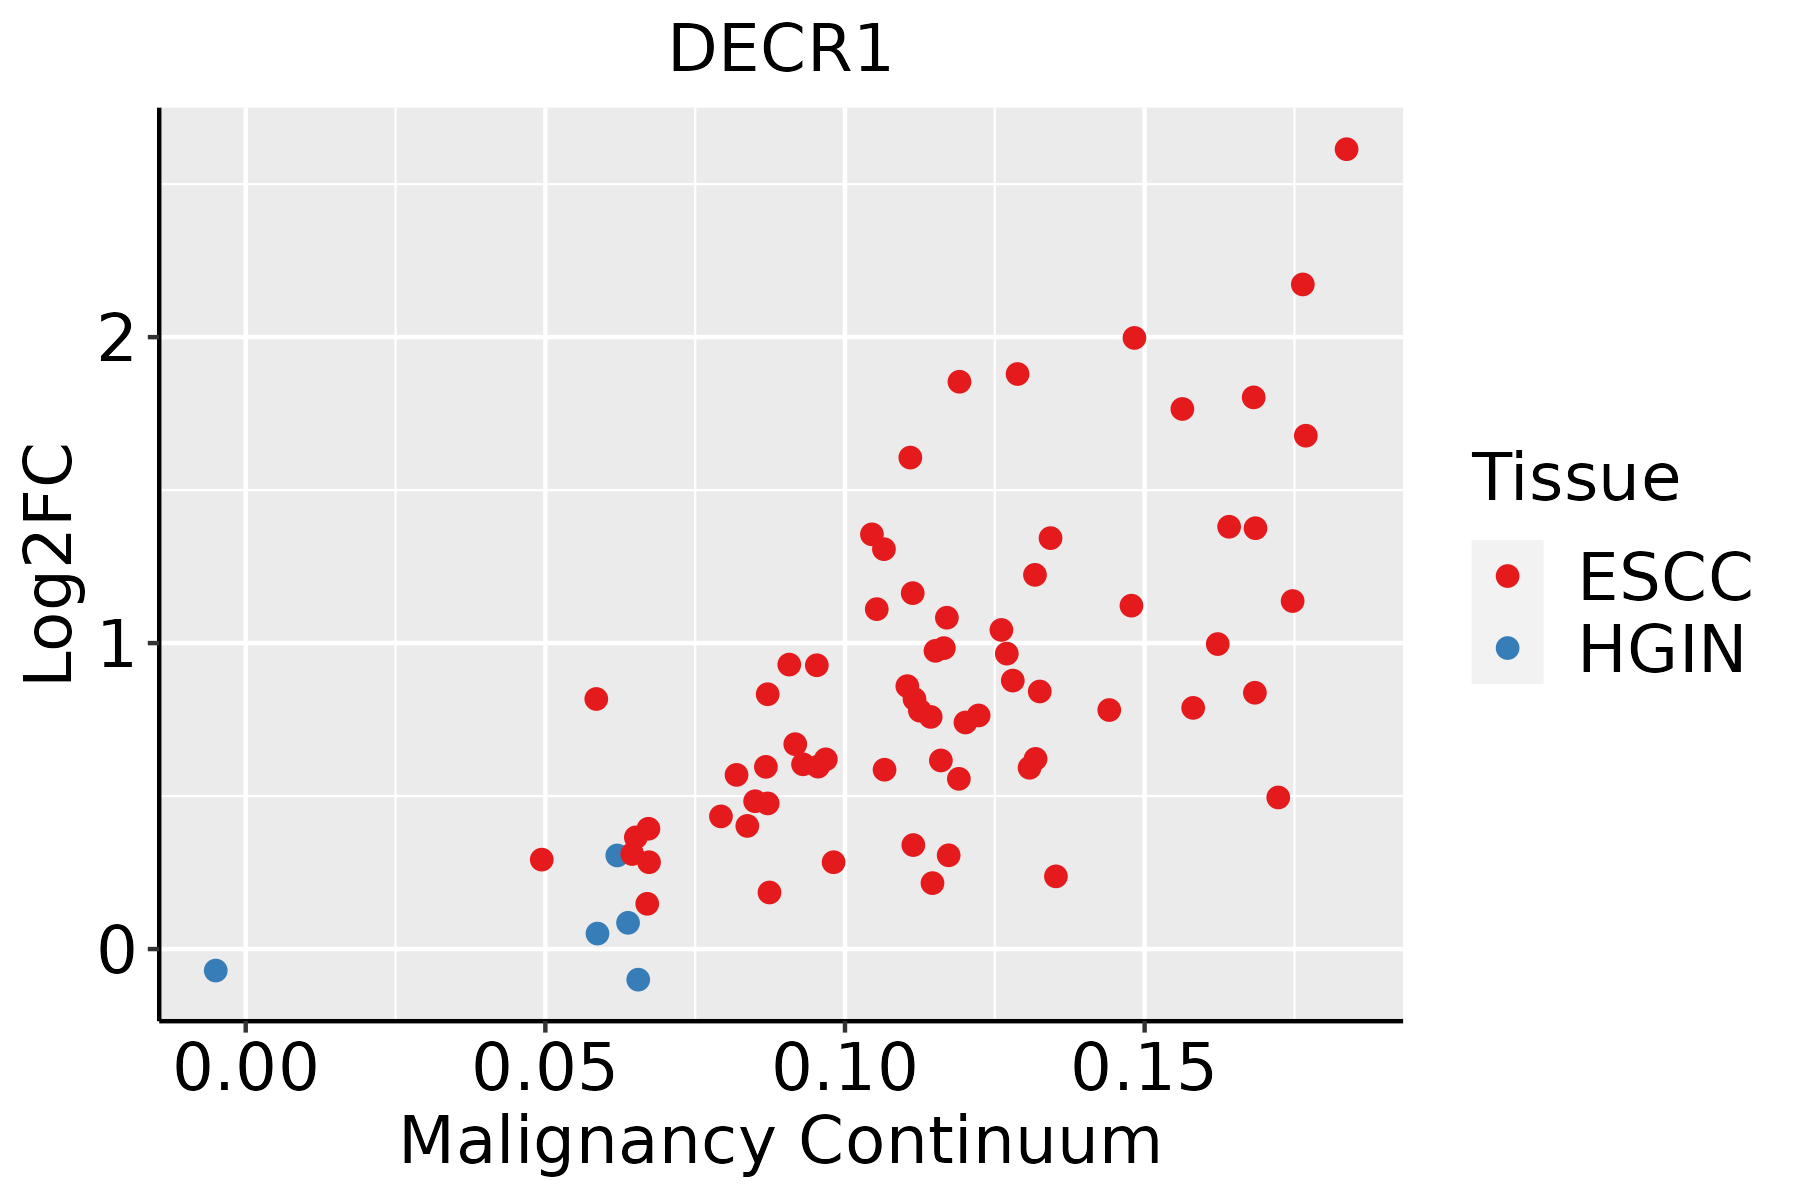 | ESCC: Esophageal squamous cell carcinoma |
| HGIN: High-grade intraepithelial neoplasias | ||
| LGIN: Low-grade intraepithelial neoplasias | ||
| GC | 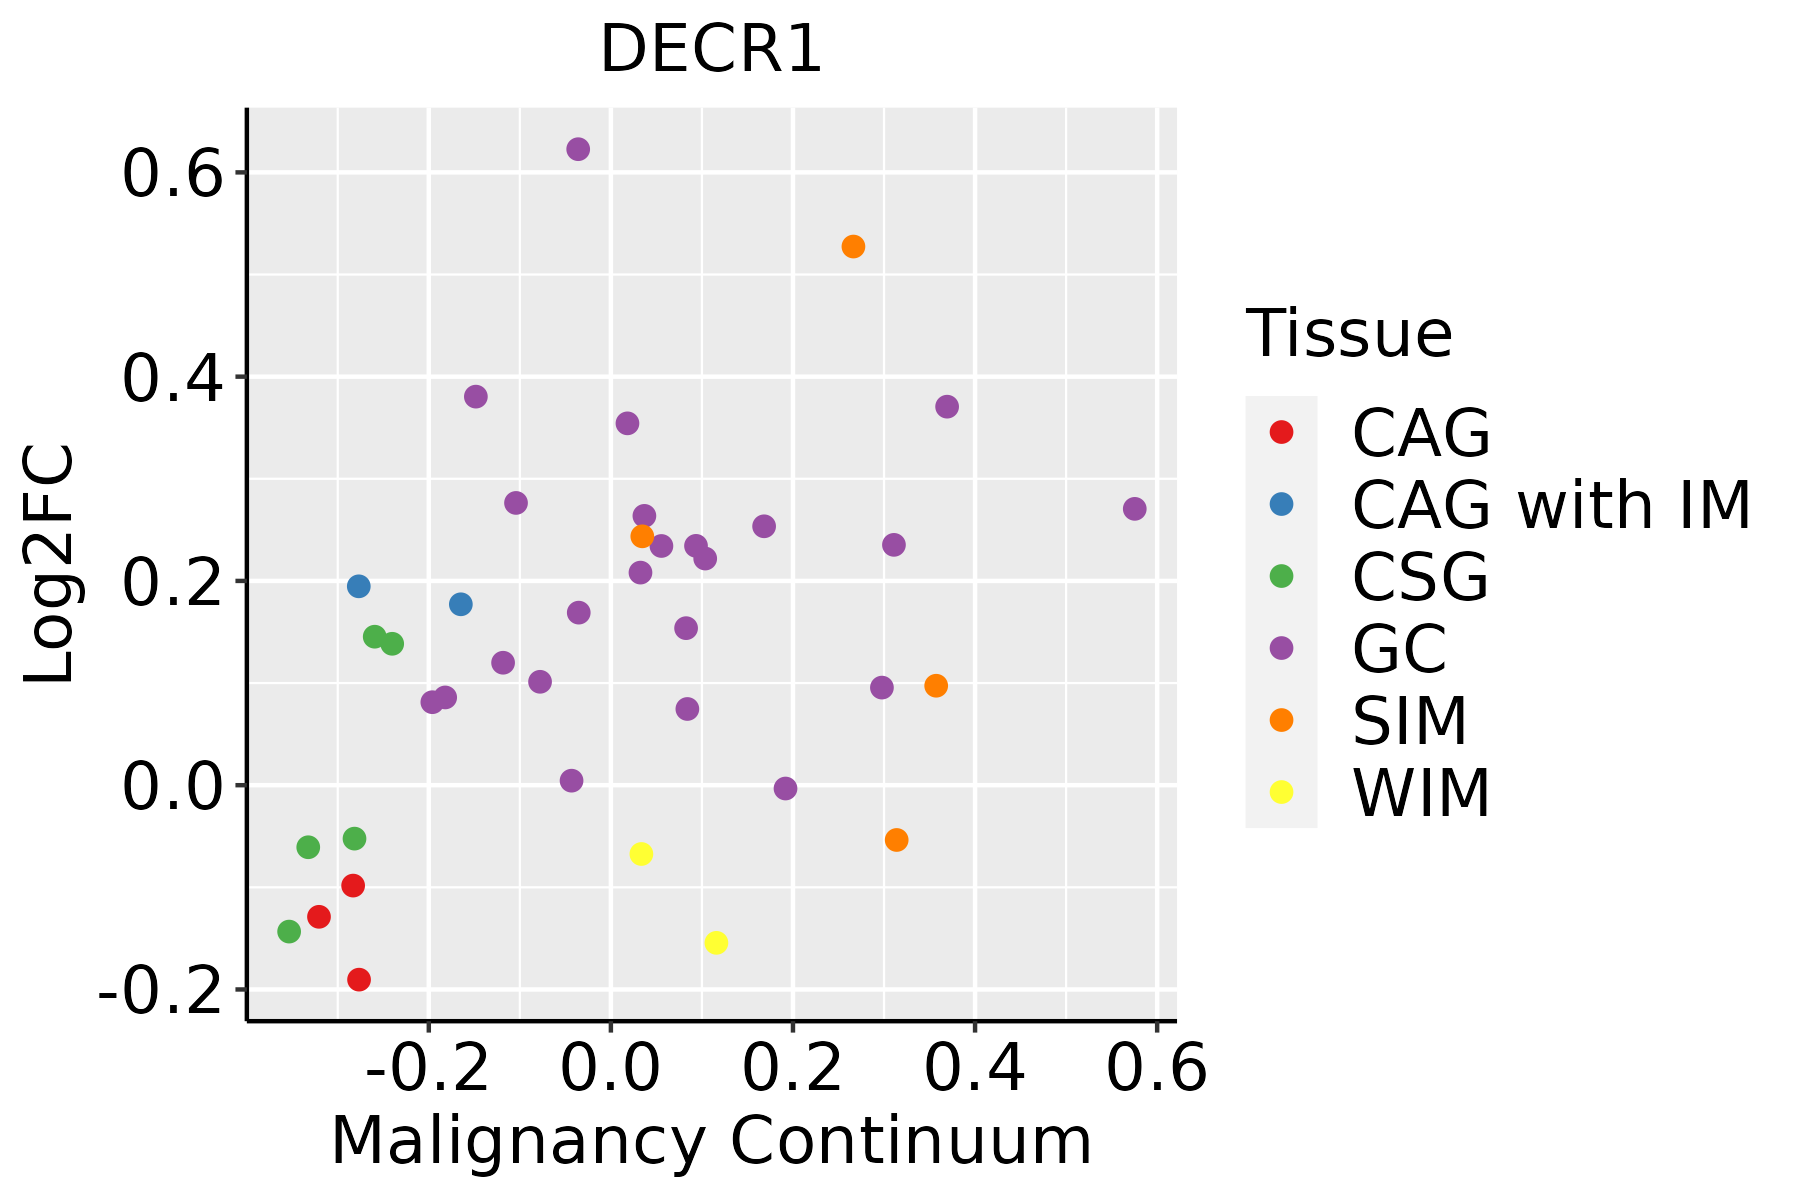 | CAG: Chronic atrophic gastritis |
| CAG with IM: Chronic atrophic gastritis with intestinal metaplasia | ||
| CSG: Chronic superficial gastritis | ||
| GC: Gastric cancer | ||
| SIM: Severe intestinal metaplasia | ||
| WIM: Wild intestinal metaplasia | ||
| Liver | 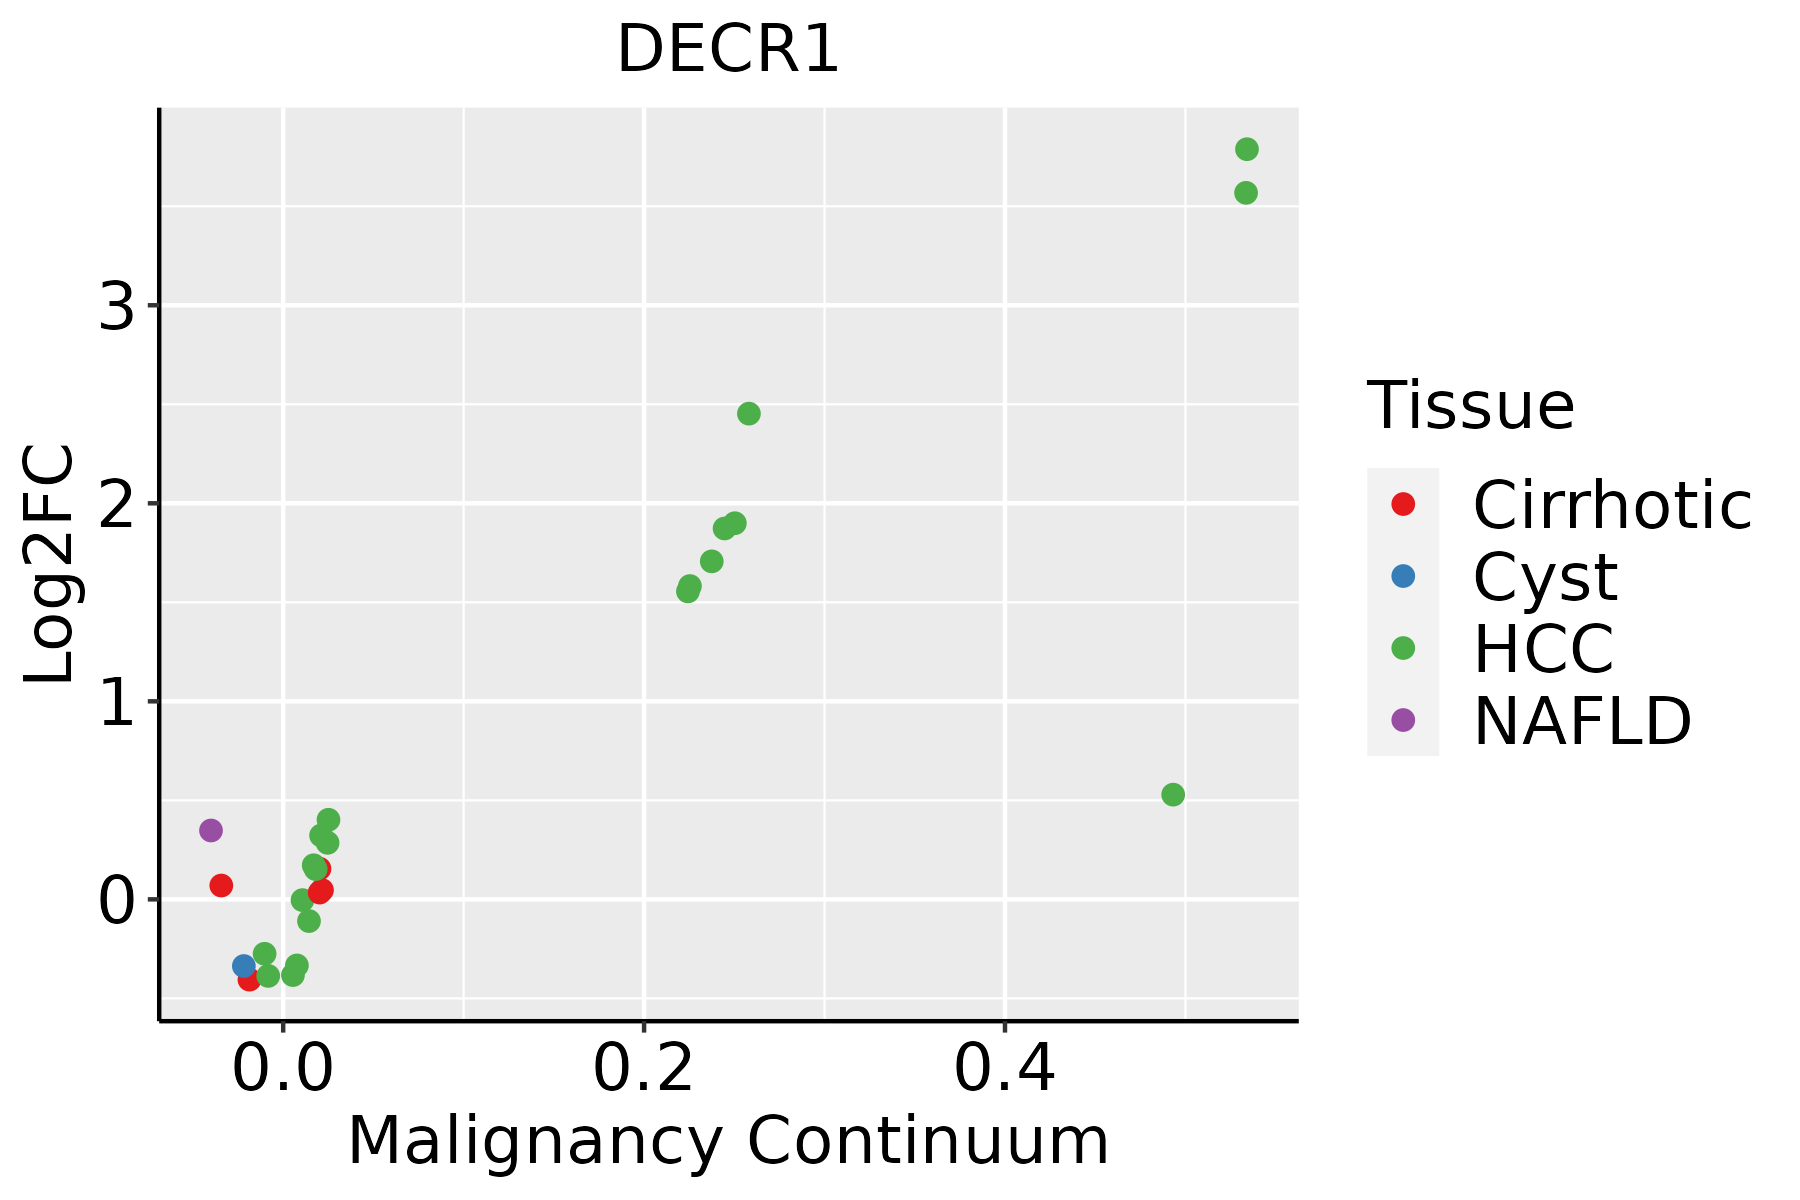 | HCC: Hepatocellular carcinoma |
| NAFLD: Non-alcoholic fatty liver disease | ||
| Oral Cavity | 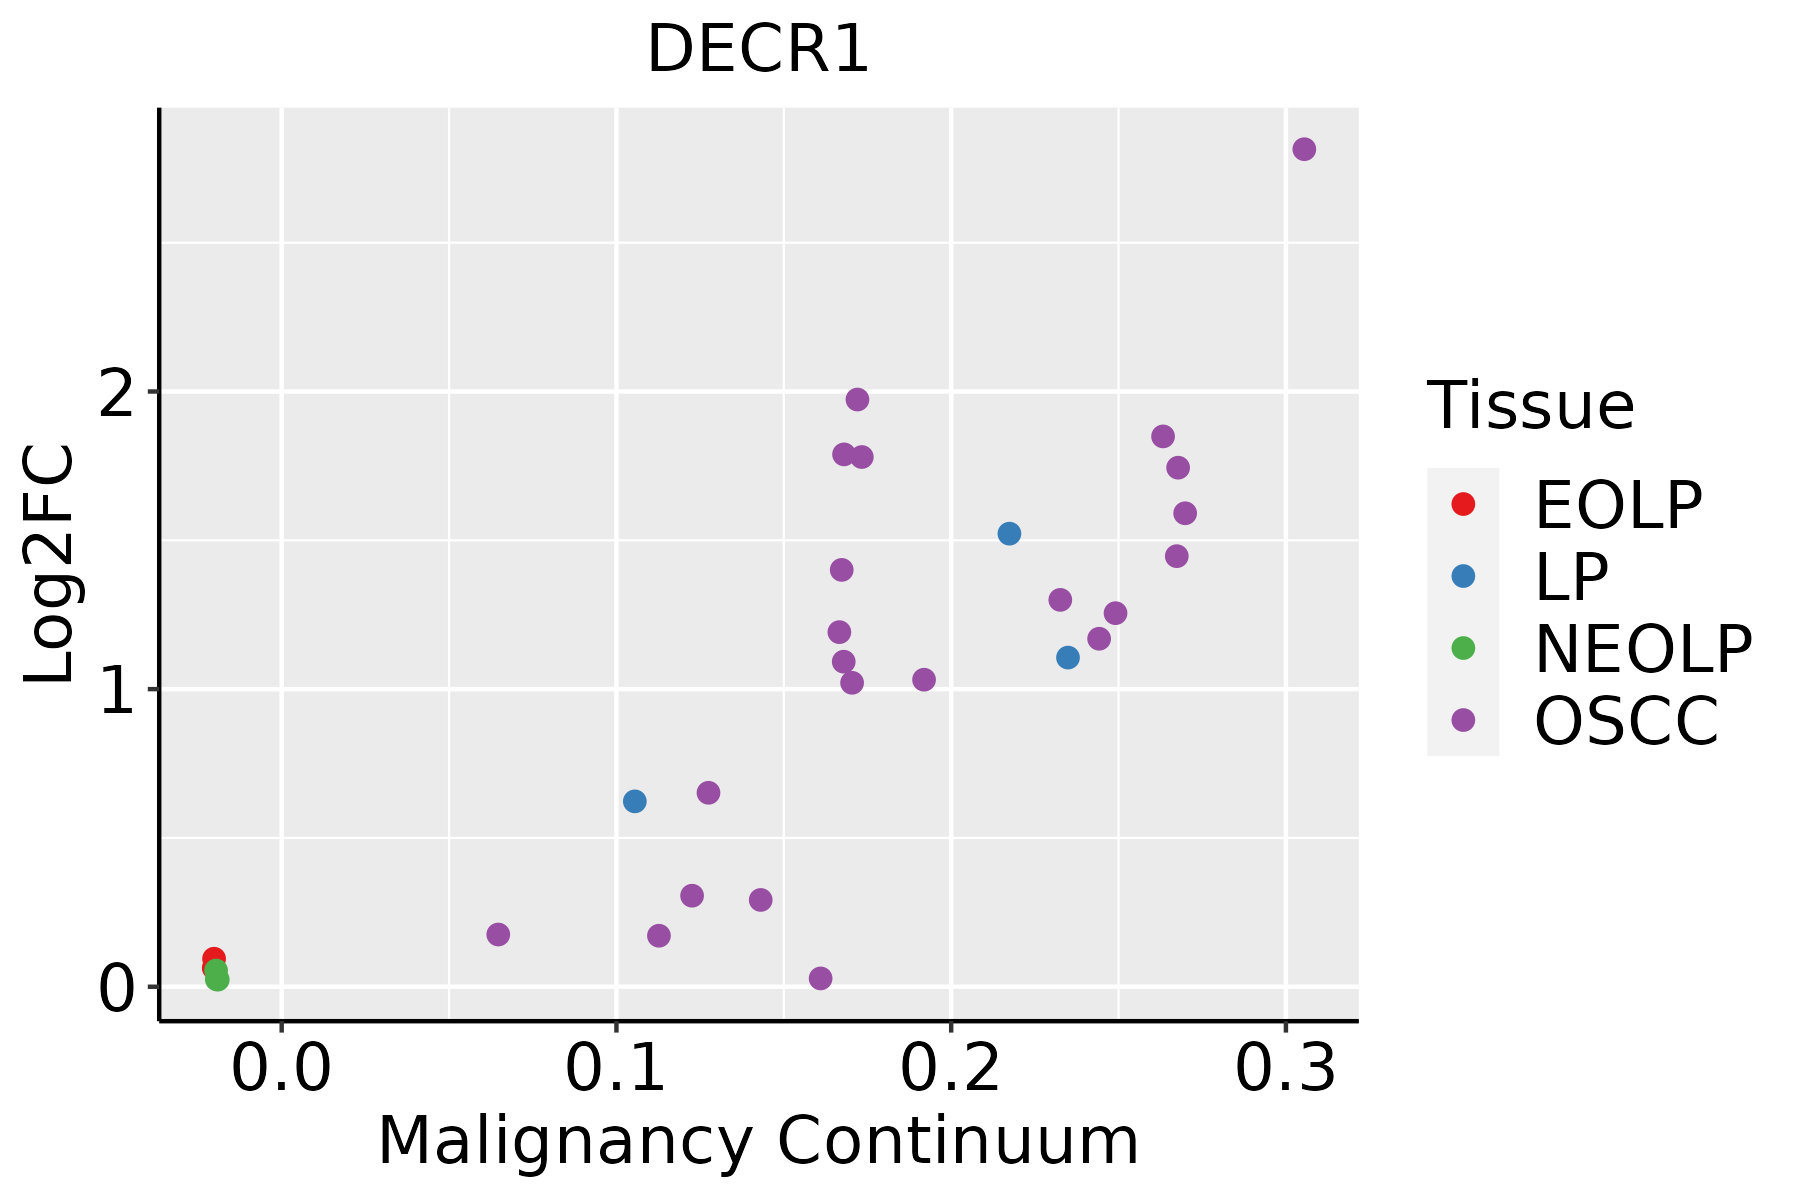 | EOLP: Erosive Oral lichen planus |
| LP: leukoplakia | ||
| NEOLP: Non-erosive oral lichen planus | ||
| OSCC: Oral squamous cell carcinoma | ||
| Prostate | 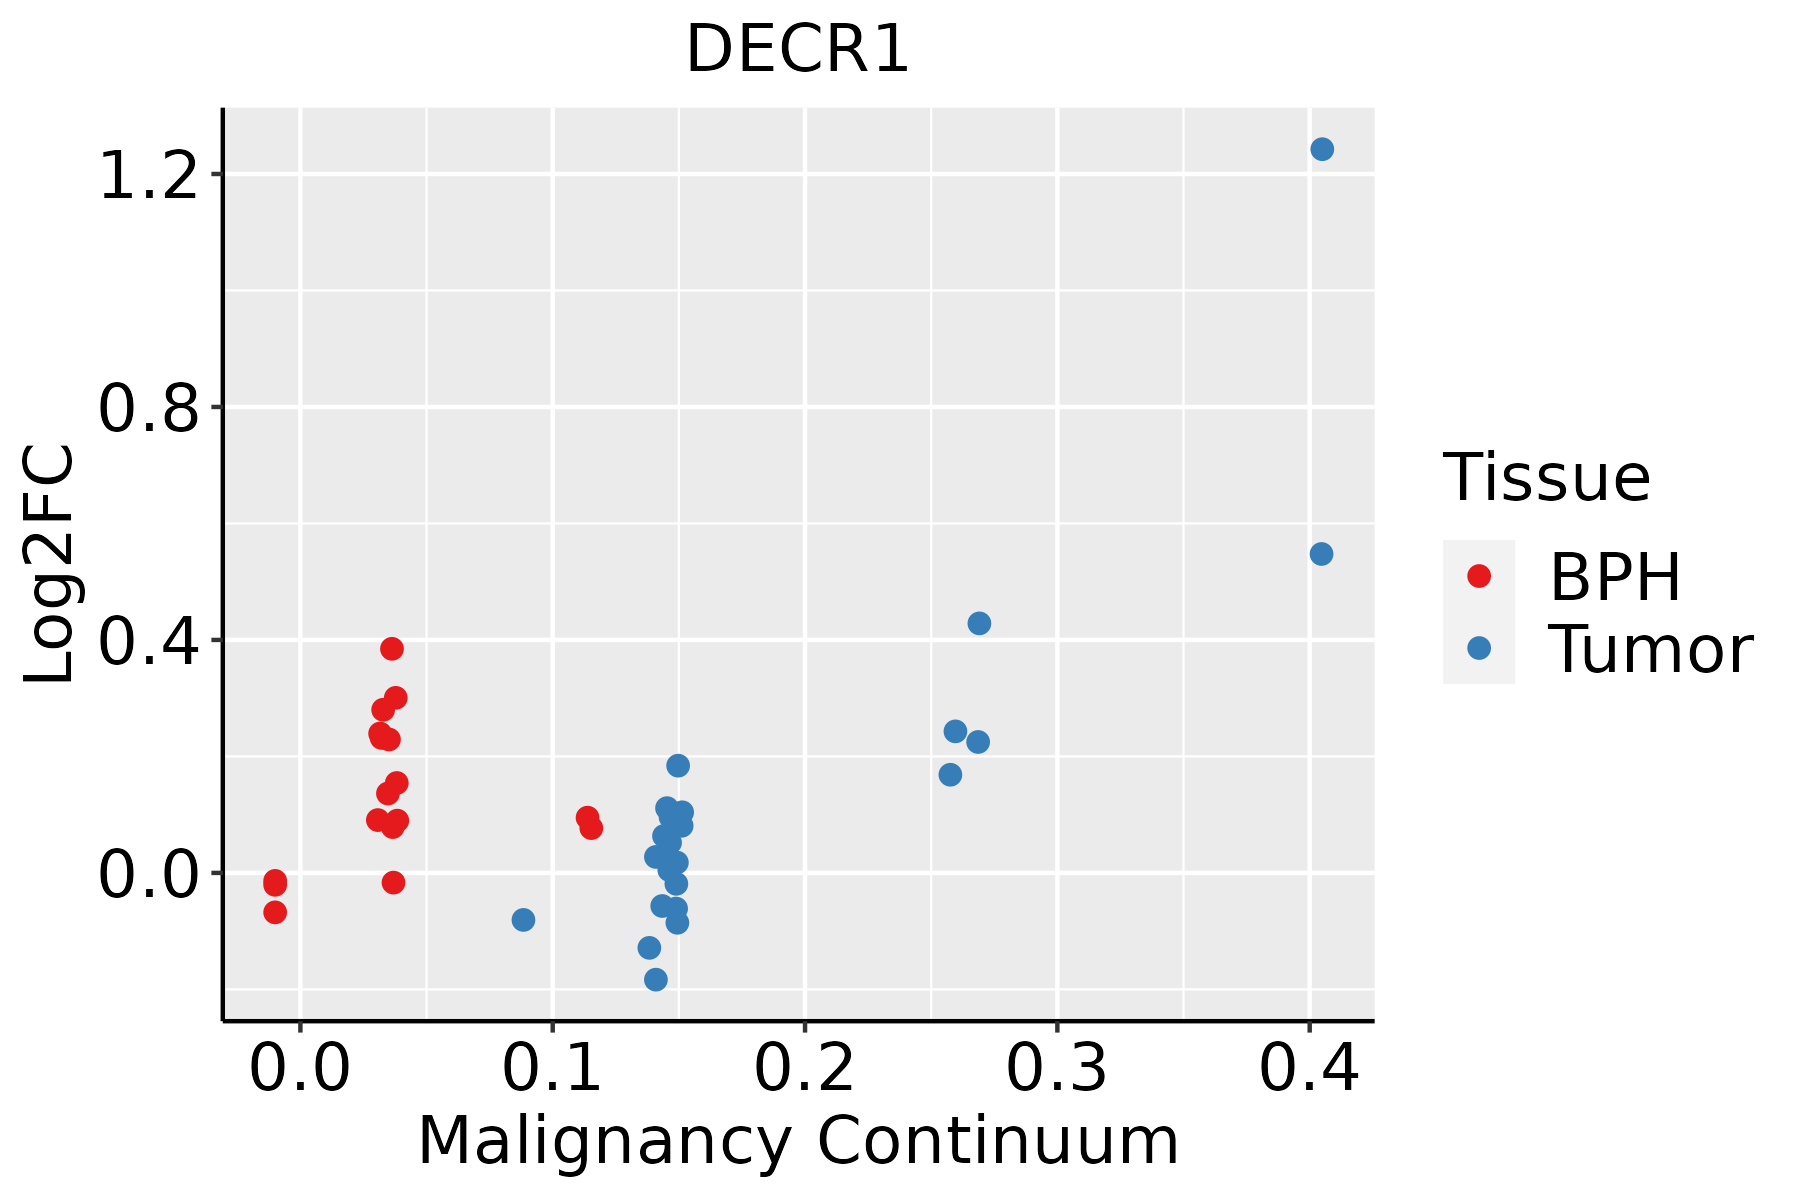 | BPH: Benign Prostatic Hyperplasia |
| Skin | 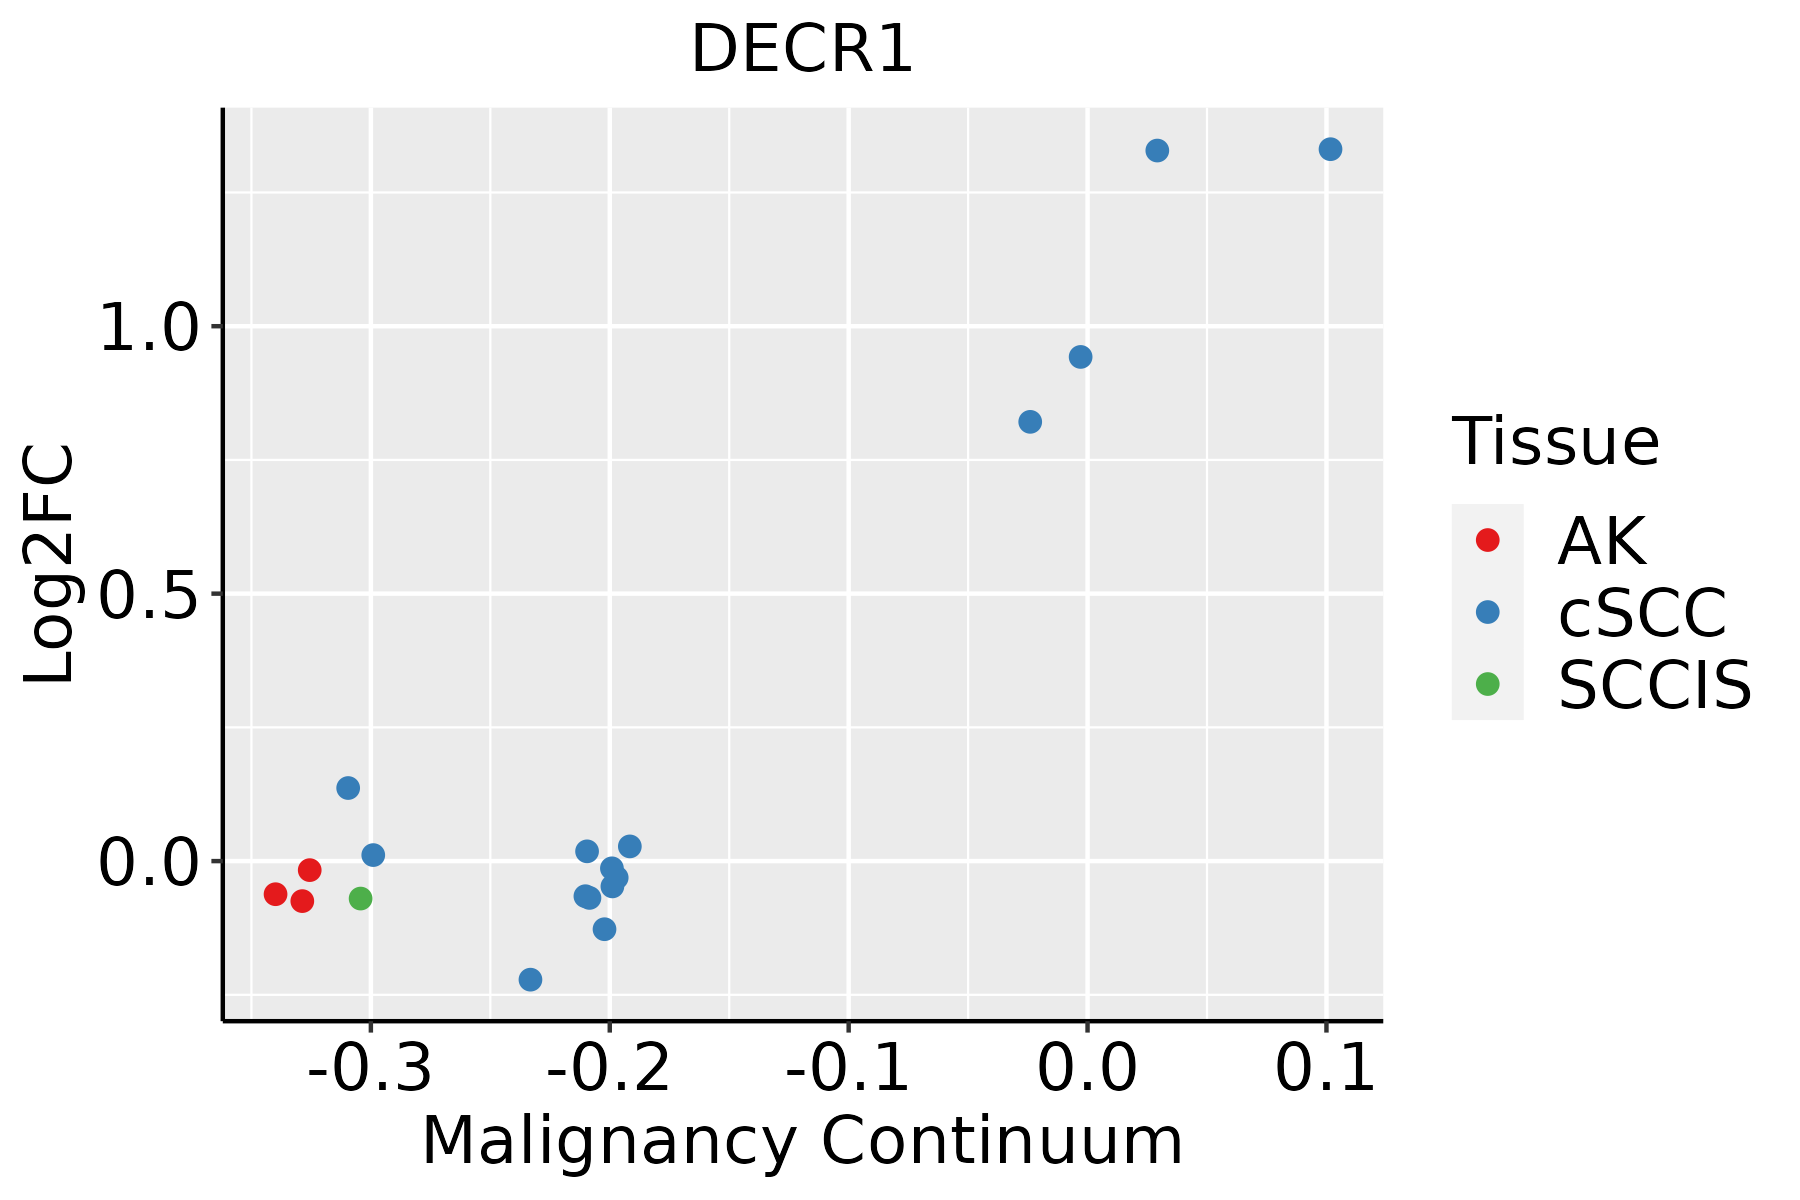 | AK: Actinic keratosis |
| cSCC: Cutaneous squamous cell carcinoma | ||
| SCCIS:squamous cell carcinoma in situ | ||
| Thyroid | 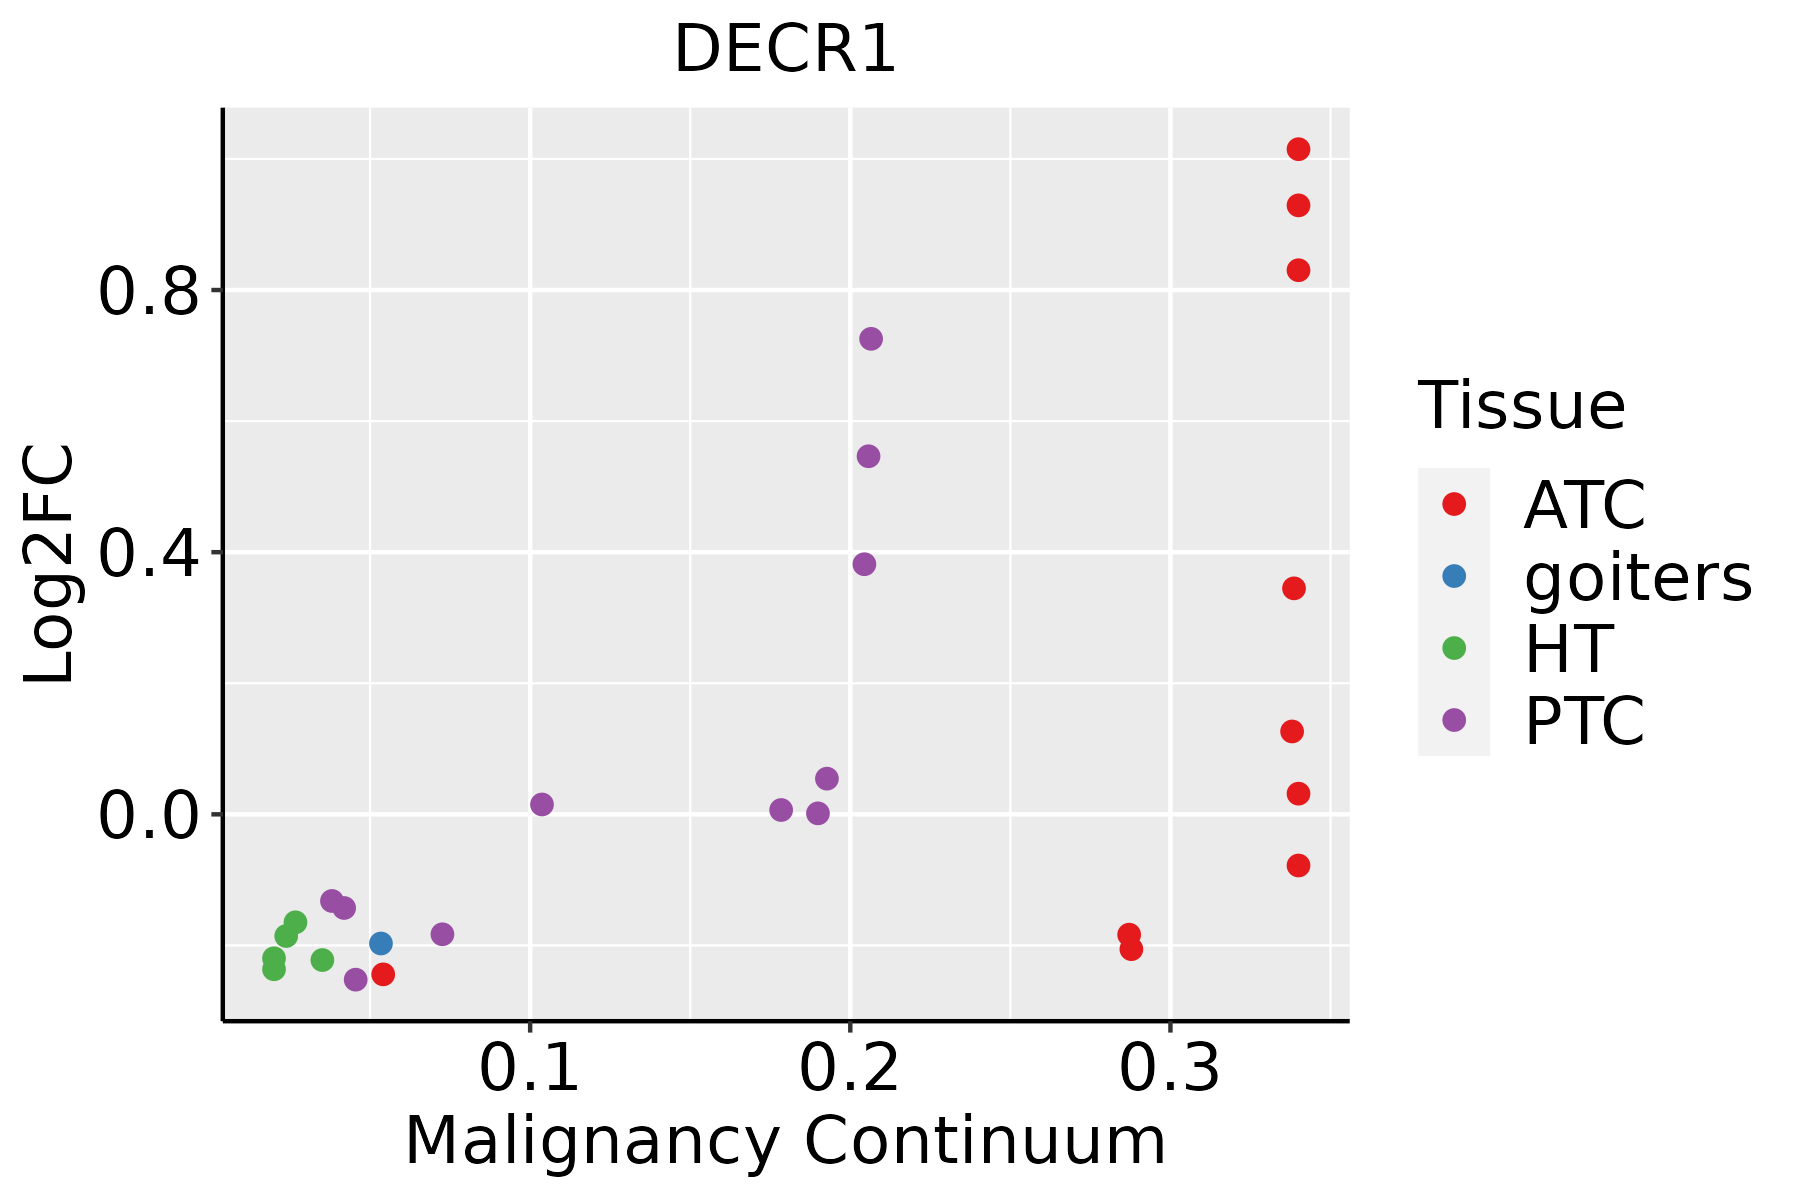 | ATC: Anaplastic thyroid cancer |
| HT: Hashimoto's thyroiditis | ||
| PTC: Papillary thyroid cancer |
| ∗log2FC in expression of this searched gene in stem-like cells from each diseased tissue sample relative to stem-like cells in normal samples in each tissue plotted against the malignancy continuum. Samples are colored based on if they are from different disease stage. |
Top |
Malignant transformation related pathway analysis |
| Find out the enriched GO biological processes and KEGG pathways involved in transition from healthy to precancer to cancer |
| Tissue | Disease Stage | Enriched GO biological Processes |
| Colorectum | AD |  |
| Colorectum | SER |  |
| Colorectum | MSS |  |
| Colorectum | MSI-H |  |
| Colorectum | FAP |  |
| ∗Top 15 enriched GO BP terms are showed in the bar plot of each disease state in each tissue. Each row represents a significant GO biological process which is colored according to the -log10(p.adjust). |
| Page: 1 2 3 4 5 6 7 8 9 |
| GO ID | Tissue | Disease Stage | Description | Gene Ratio | Bg Ratio | pvalue | p.adjust | Count |
| GO:001939522 | Liver | HCC | fatty acid oxidation | 72/7958 | 103/18723 | 1.63e-08 | 3.92e-07 | 72 |
| GO:000906221 | Liver | HCC | fatty acid catabolic process | 70/7958 | 100/18723 | 2.34e-08 | 5.44e-07 | 70 |
| GO:003444021 | Liver | HCC | lipid oxidation | 73/7958 | 108/18723 | 1.17e-07 | 2.25e-06 | 73 |
| GO:007232921 | Liver | HCC | monocarboxylic acid catabolic process | 80/7958 | 122/18723 | 2.18e-07 | 3.91e-06 | 80 |
| GO:000663521 | Liver | HCC | fatty acid beta-oxidation | 52/7958 | 74/18723 | 1.22e-06 | 1.80e-05 | 52 |
| GO:003025821 | Liver | HCC | lipid modification | 123/7958 | 212/18723 | 3.50e-06 | 4.58e-05 | 123 |
| GO:001604221 | Liver | HCC | lipid catabolic process | 175/7958 | 320/18723 | 6.50e-06 | 7.88e-05 | 175 |
| GO:010610611 | Liver | HCC | cold-induced thermogenesis | 76/7958 | 144/18723 | 8.07e-03 | 3.18e-02 | 76 |
| GO:012016111 | Liver | HCC | regulation of cold-induced thermogenesis | 76/7958 | 144/18723 | 8.07e-03 | 3.18e-02 | 76 |
| GO:199084511 | Liver | HCC | adaptive thermogenesis | 81/7958 | 157/18723 | 1.32e-02 | 4.72e-02 | 81 |
| GO:00090627 | Oral cavity | OSCC | fatty acid catabolic process | 59/7305 | 100/18723 | 3.99e-05 | 3.48e-04 | 59 |
| GO:00066317 | Oral cavity | OSCC | fatty acid metabolic process | 186/7305 | 390/18723 | 2.65e-04 | 1.69e-03 | 186 |
| GO:00723296 | Oral cavity | OSCC | monocarboxylic acid catabolic process | 66/7305 | 122/18723 | 5.02e-04 | 2.95e-03 | 66 |
| GO:00193957 | Oral cavity | OSCC | fatty acid oxidation | 57/7305 | 103/18723 | 5.58e-04 | 3.23e-03 | 57 |
| GO:00344406 | Oral cavity | OSCC | lipid oxidation | 59/7305 | 108/18723 | 7.01e-04 | 3.89e-03 | 59 |
| GO:00066357 | Oral cavity | OSCC | fatty acid beta-oxidation | 42/7305 | 74/18723 | 1.47e-03 | 7.09e-03 | 42 |
| GO:00442826 | Oral cavity | OSCC | small molecule catabolic process | 174/7305 | 376/18723 | 2.25e-03 | 1.00e-02 | 174 |
| GO:00442426 | Oral cavity | OSCC | cellular lipid catabolic process | 104/7305 | 214/18723 | 2.61e-03 | 1.15e-02 | 104 |
| GO:01061065 | Oral cavity | OSCC | cold-induced thermogenesis | 71/7305 | 144/18723 | 7.51e-03 | 2.75e-02 | 71 |
| GO:01201615 | Oral cavity | OSCC | regulation of cold-induced thermogenesis | 71/7305 | 144/18723 | 7.51e-03 | 2.75e-02 | 71 |
| Page: 1 2 3 4 5 6 7 8 |
| Pathway ID | Tissue | Disease Stage | Description | Gene Ratio | Bg Ratio | pvalue | p.adjust | qvalue | Count |
| Page: 1 |
Top |
Cell-cell communication analysis |
| Identification of potential cell-cell interactions between two cell types and their ligand-receptor pairs for different disease states |
| Ligand | Receptor | LRpair | Pathway | Tissue | Disease Stage |
| Page: 1 |
Top |
Single-cell gene regulatory network inference analysis |
| Find out the significant the regulons (TFs) and the target genes of each regulon across cell types for different disease states |
| TF | Cell Type | Tissue | Disease Stage | Target Gene | RSS | Regulon Activity |
| ∗The dot plots of a searched regulon are shown for all cell subpopulations in each disease state of each tissue based on the regulon specific score inferred using pySCENIC and by calculating the average expression. |
| Page: 1 |
Top |
Somatic mutation of malignant transformation related genes |
| Annotation of somatic variants for genes involved in malignant transformation |
| Hugo Symbol | Variant Class | Variant Classification | dbSNP RS | HGVSc | HGVSp | HGVSp Short | SWISSPROT | BIOTYPE | SIFT | PolyPhen | Tumor Sample Barcode | Tissue | Histology | Sex | Age | Stage | Therapy Types | Drugs | Outcome |
| DECR1 | SNV | Missense_Mutation | c.129N>G | p.Phe43Leu | p.F43L | Q16698 | protein_coding | deleterious(0.04) | benign(0.01) | TCGA-AC-A23H-01 | Breast | breast invasive carcinoma | Female | >=65 | I/II | Unknown | Unknown | PD | |
| DECR1 | SNV | Missense_Mutation | novel | c.171N>G | p.Phe57Leu | p.F57L | Q16698 | protein_coding | tolerated(0.73) | benign(0.021) | TCGA-AO-A128-01 | Breast | breast invasive carcinoma | Female | <65 | I/II | Chemotherapy | doxorubicin | SD |
| DECR1 | SNV | Missense_Mutation | c.272N>C | p.Arg91Pro | p.R91P | Q16698 | protein_coding | deleterious(0) | probably_damaging(0.999) | TCGA-BH-A0AW-01 | Breast | breast invasive carcinoma | Female | <65 | I/II | Chemotherapy | carboplatin | SD | |
| DECR1 | SNV | Missense_Mutation | c.470C>T | p.Ser157Phe | p.S157F | Q16698 | protein_coding | deleterious(0) | probably_damaging(0.992) | TCGA-AA-3814-01 | Colorectum | colon adenocarcinoma | Female | >=65 | I/II | Unknown | Unknown | SD | |
| DECR1 | SNV | Missense_Mutation | c.737N>C | p.Lys246Thr | p.K246T | Q16698 | protein_coding | deleterious(0.01) | benign(0.224) | TCGA-AA-A01D-01 | Colorectum | colon adenocarcinoma | Female | <65 | III/IV | Chemotherapy | capecitabine | PD | |
| DECR1 | SNV | Missense_Mutation | novel | c.776N>C | p.Glu259Ala | p.E259A | Q16698 | protein_coding | tolerated(0.07) | benign(0.043) | TCGA-CA-6717-01 | Colorectum | colon adenocarcinoma | Male | <65 | I/II | Chemotherapy | oxaliplatin | CR |
| DECR1 | SNV | Missense_Mutation | rs781613500 | c.53G>T | p.Gly18Val | p.G18V | Q16698 | protein_coding | tolerated_low_confidence(0.4) | benign(0) | TCGA-D5-6534-01 | Colorectum | colon adenocarcinoma | Female | <65 | I/II | Unknown | Unknown | SD |
| DECR1 | SNV | Missense_Mutation | c.205N>G | p.Thr69Ala | p.T69A | Q16698 | protein_coding | deleterious(0) | probably_damaging(0.912) | TCGA-D5-6929-01 | Colorectum | colon adenocarcinoma | Female | <65 | III/IV | Chemotherapy | oxaliplatinum+ | SD | |
| DECR1 | SNV | Missense_Mutation | novel | c.944N>T | p.Arg315Ile | p.R315I | Q16698 | protein_coding | tolerated(0.07) | benign(0.017) | TCGA-AG-A002-01 | Colorectum | rectum adenocarcinoma | Male | <65 | I/II | Unknown | Unknown | SD |
| DECR1 | SNV | Missense_Mutation | novel | c.568N>A | p.Ala190Thr | p.A190T | Q16698 | protein_coding | tolerated(0.07) | possibly_damaging(0.554) | TCGA-F5-6814-01 | Colorectum | rectum adenocarcinoma | Male | <65 | I/II | Unknown | Unknown | SD |
| Page: 1 2 3 |
Top |
Related drugs of malignant transformation related genes |
| Identification of chemicals and drugs interact with genes involved in malignant transfromation |
| (DGIdb 4.0) |
| Entrez ID | Symbol | Category | Interaction Types | Drug Claim Name | Drug Name | PMIDs |
| Page: 1 |

Copyright 2023-Present -The University of Texas Health Science Center at Houston |