| Tissue | Expression Dynamics | Abbreviation |
| Esophagus | 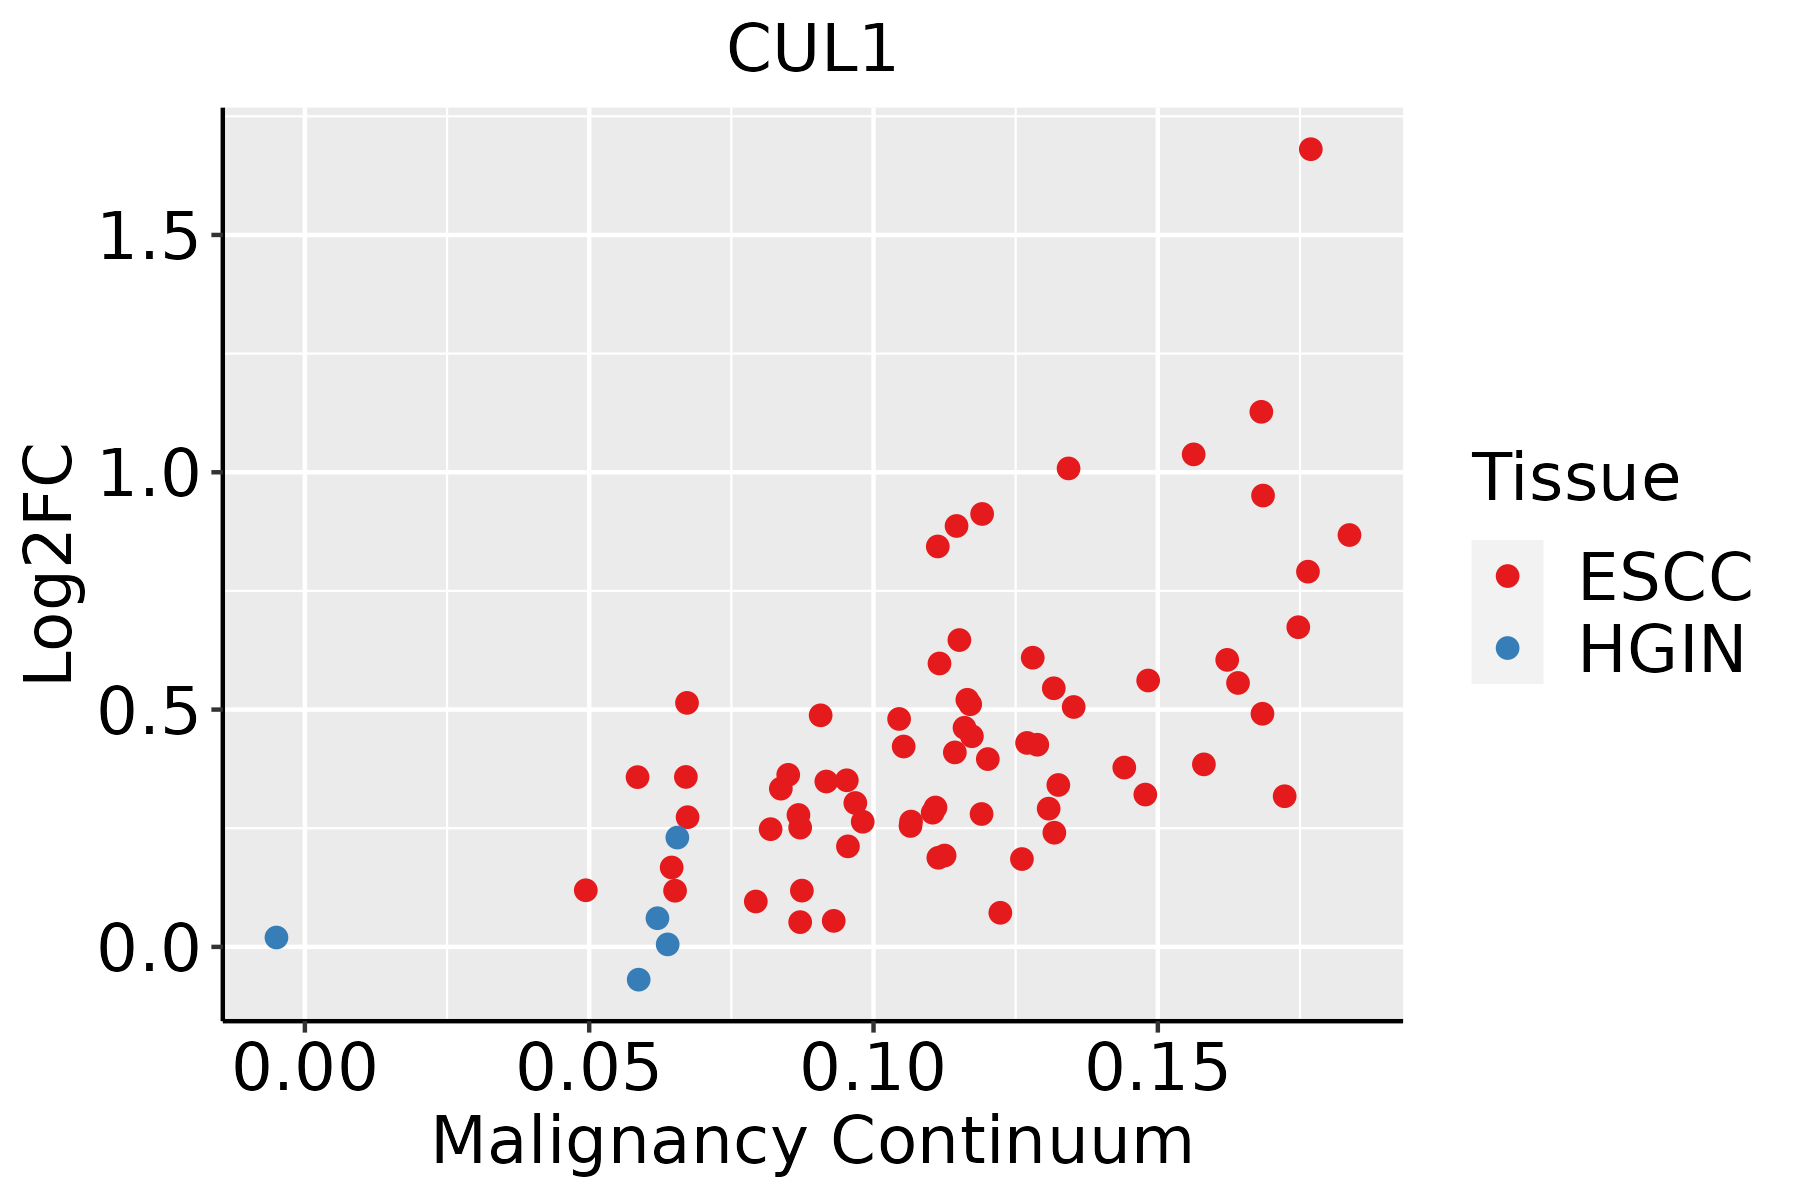 | ESCC: Esophageal squamous cell carcinoma |
| HGIN: High-grade intraepithelial neoplasias |
| LGIN: Low-grade intraepithelial neoplasias |
| Liver | 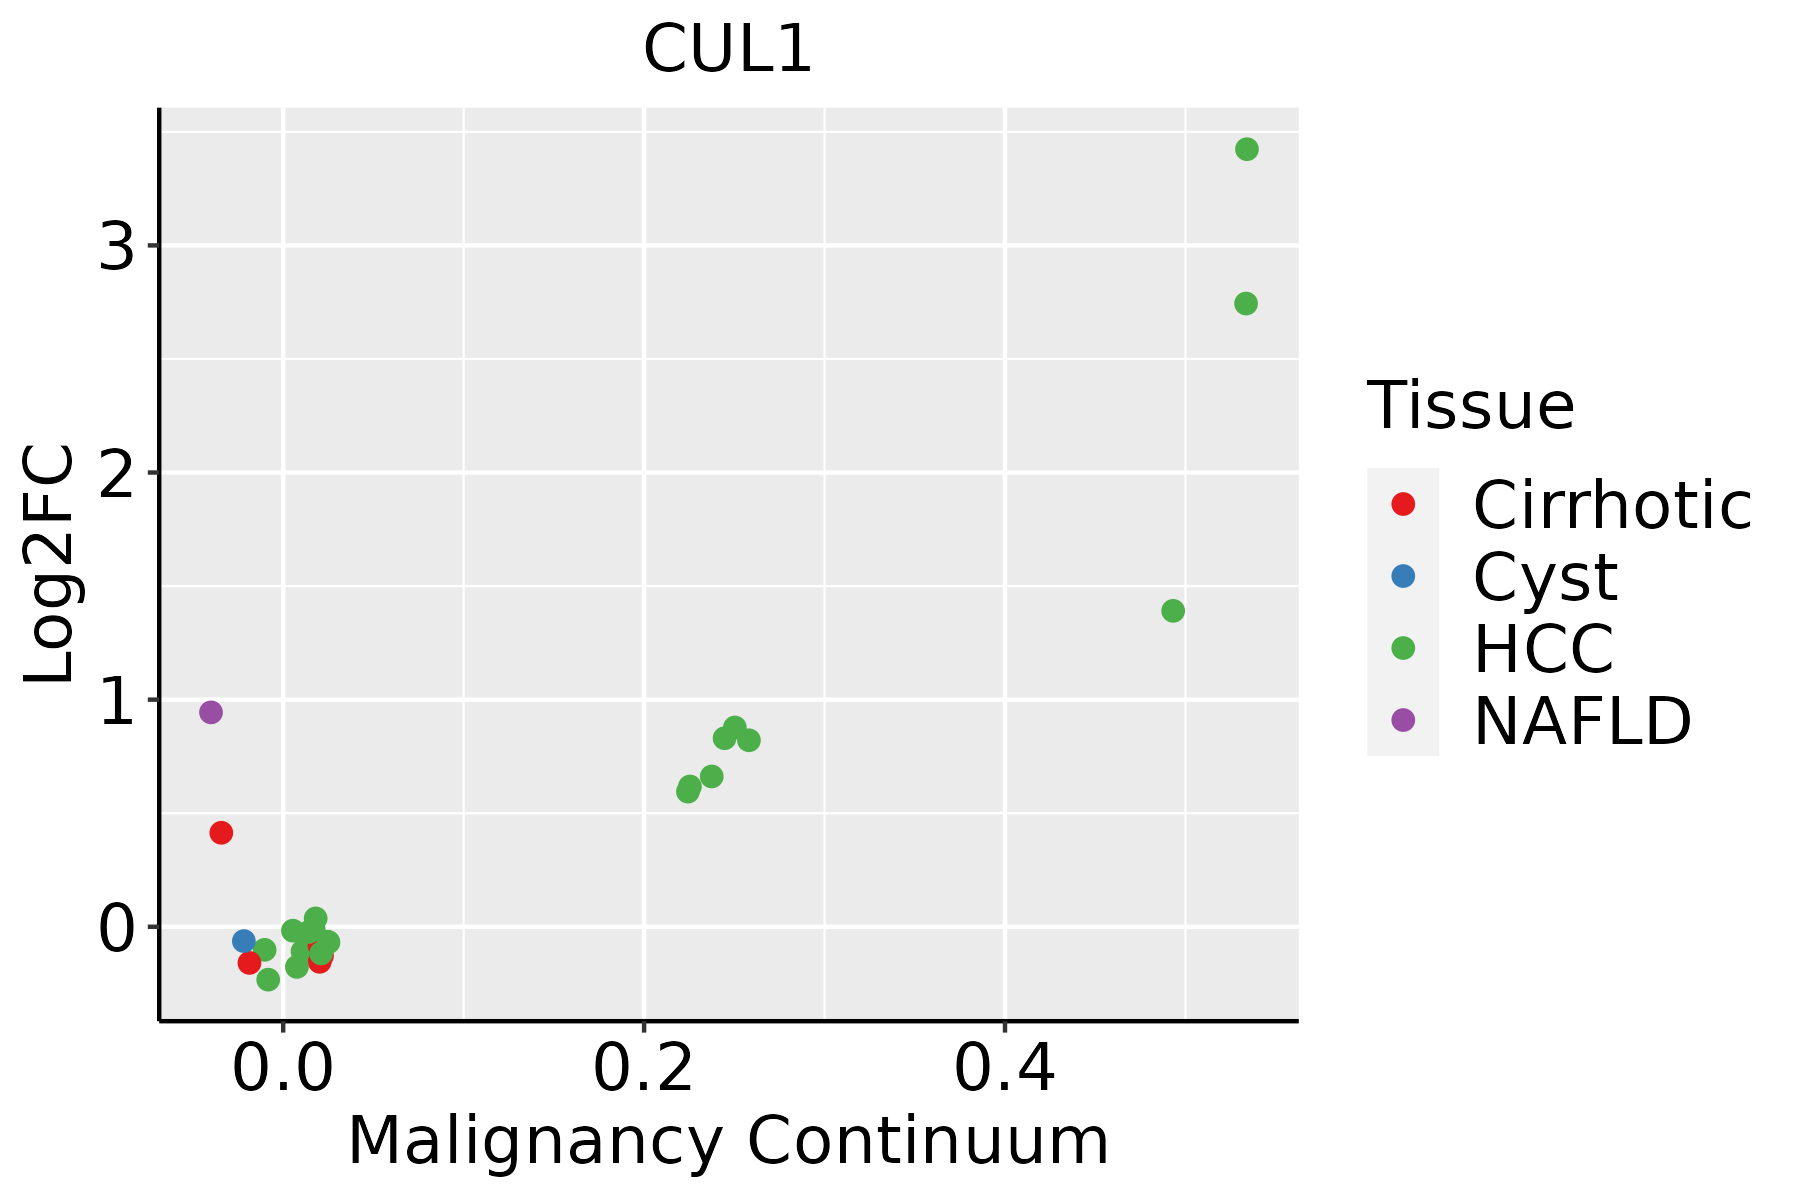 | HCC: Hepatocellular carcinoma |
| NAFLD: Non-alcoholic fatty liver disease |
| Lung | 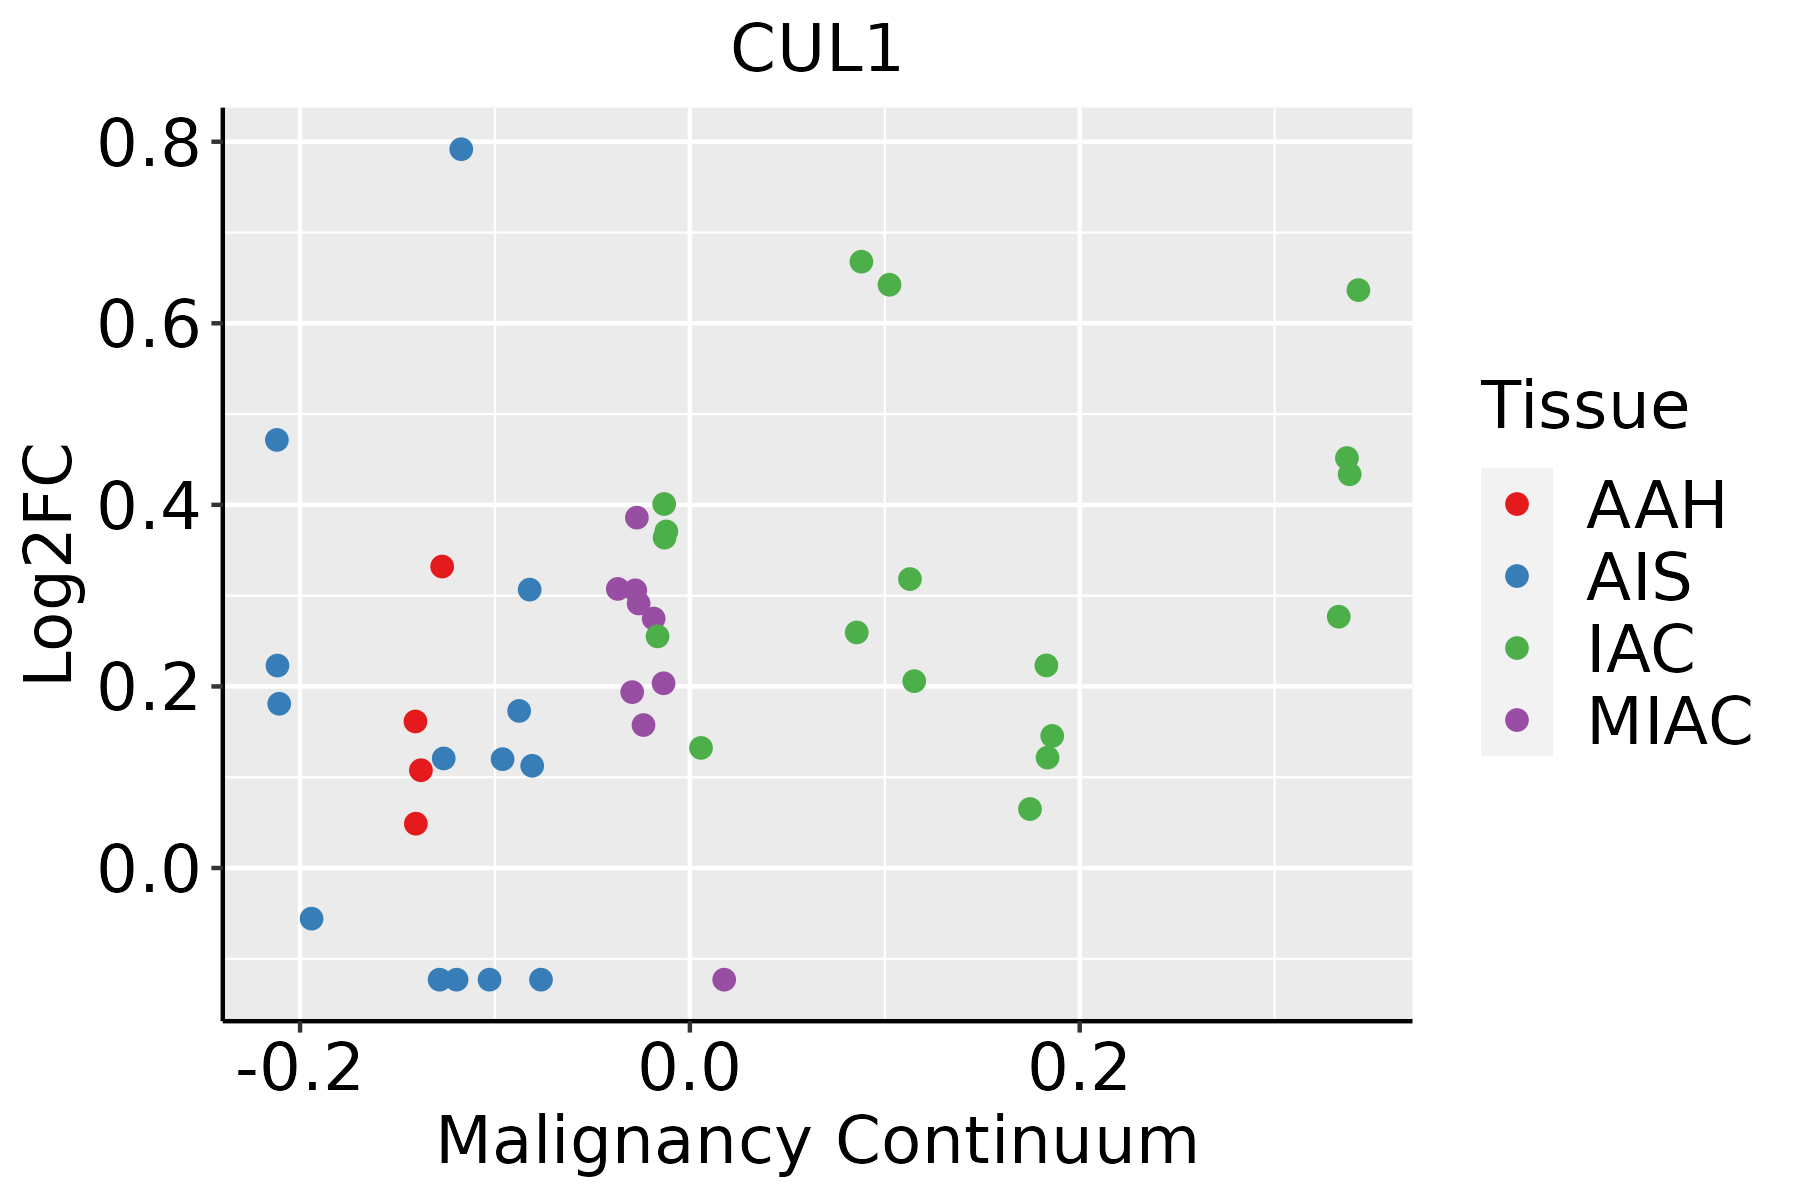 | AAH: Atypical adenomatous hyperplasia |
| AIS: Adenocarcinoma in situ |
| IAC: Invasive lung adenocarcinoma |
| MIA: Minimally invasive adenocarcinoma |
| Oral Cavity | 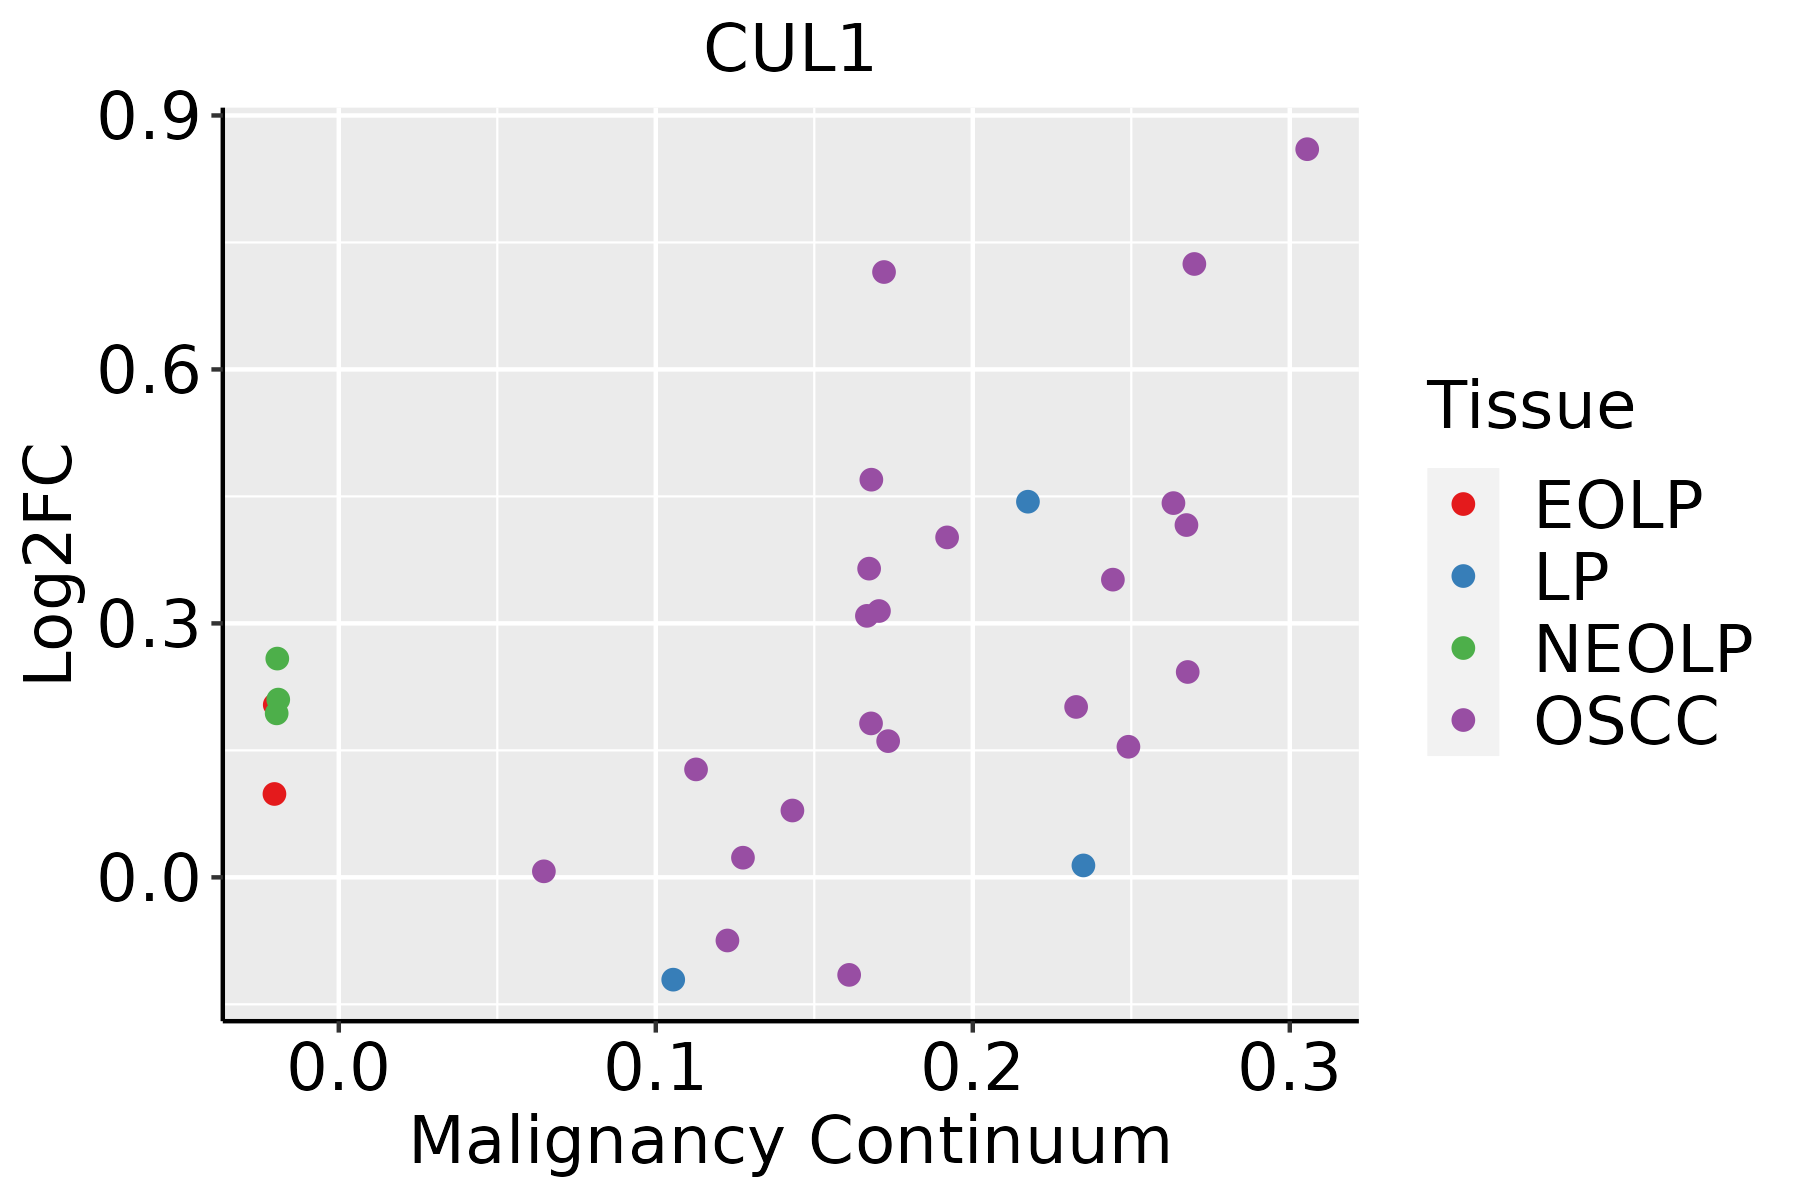 | EOLP: Erosive Oral lichen planus |
| LP: leukoplakia |
| NEOLP: Non-erosive oral lichen planus |
| OSCC: Oral squamous cell carcinoma |
| Prostate | 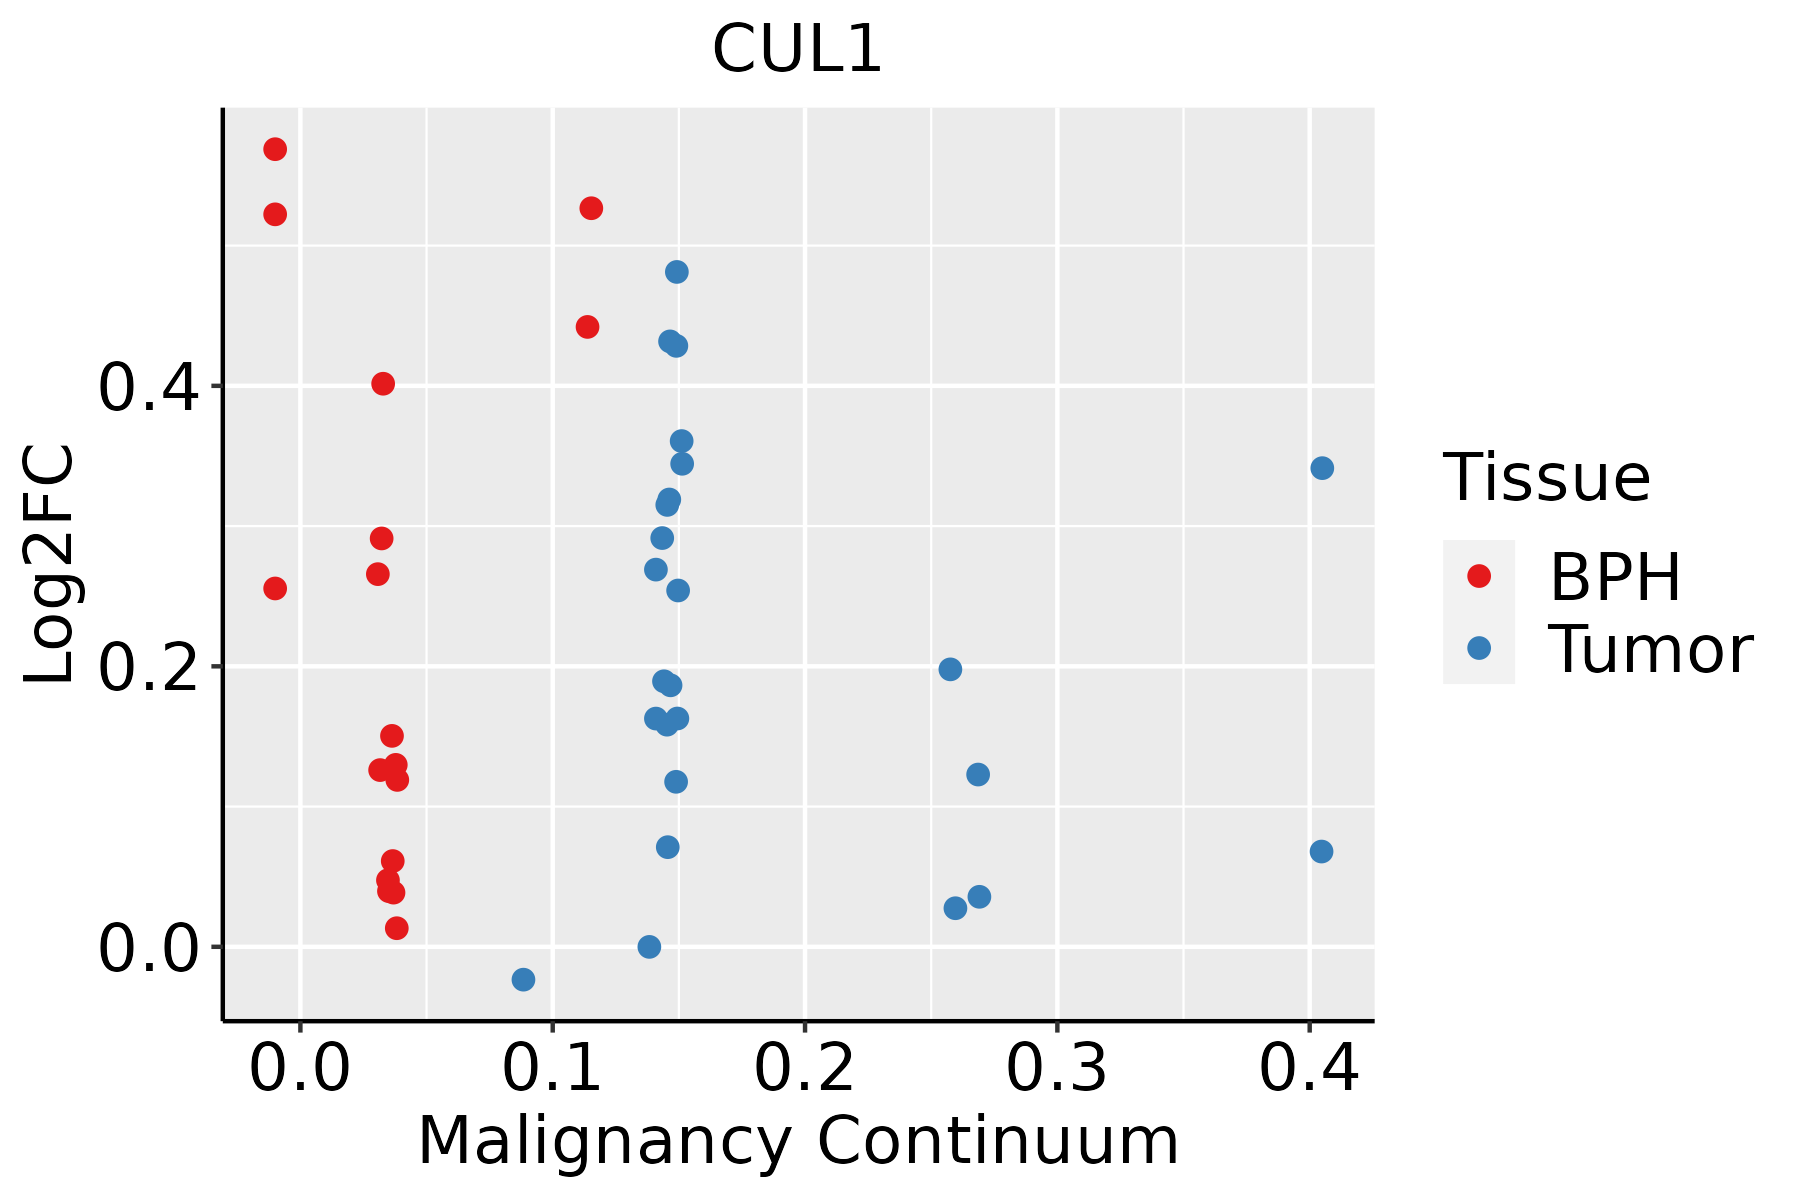 | BPH: Benign Prostatic Hyperplasia |
| Skin | 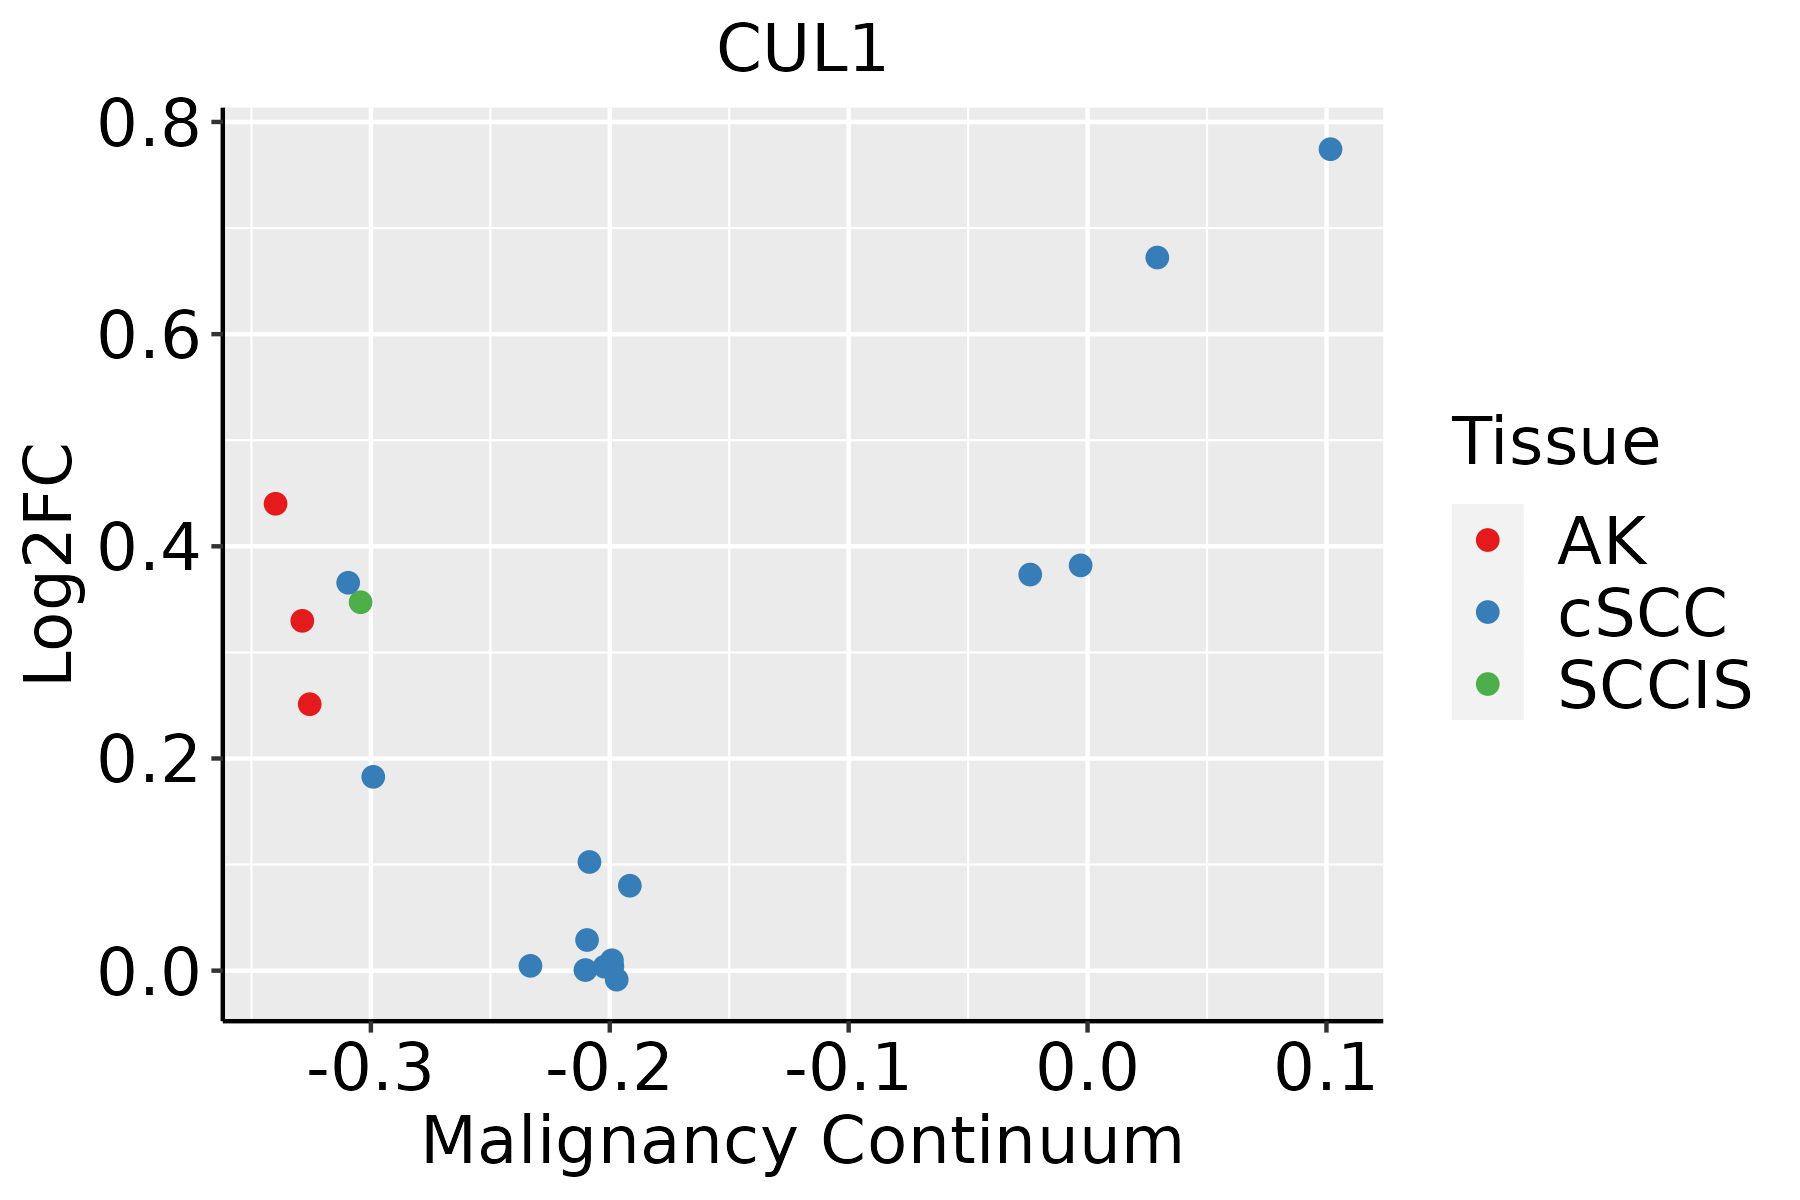 | AK: Actinic keratosis |
| cSCC: Cutaneous squamous cell carcinoma |
| SCCIS:squamous cell carcinoma in situ |
| Thyroid | 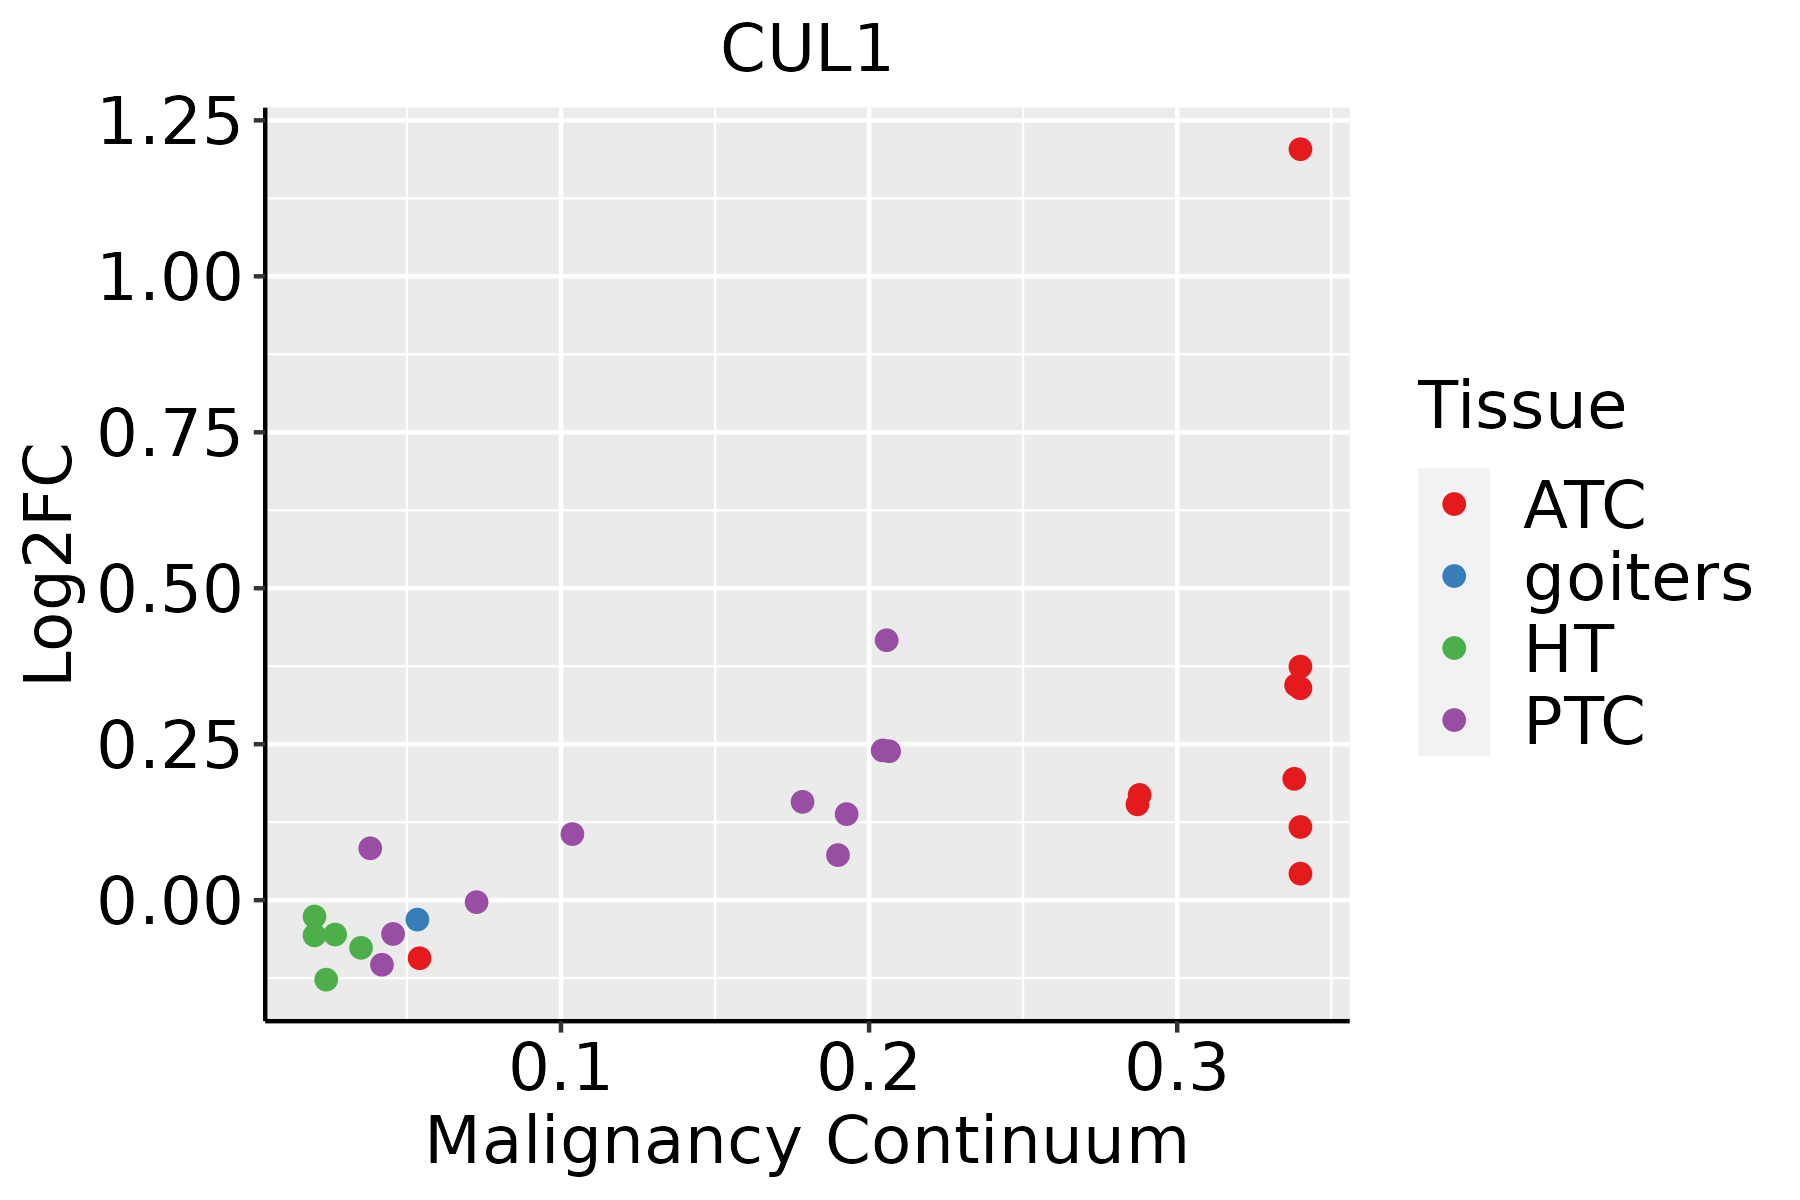 | ATC: Anaplastic thyroid cancer |
| HT: Hashimoto's thyroiditis |
| PTC: Papillary thyroid cancer |
| GO ID | Tissue | Disease Stage | Description | Gene Ratio | Bg Ratio | pvalue | p.adjust | Count |
| GO:00448435 | Prostate | BPH | cell cycle G1/S phase transition | 68/3107 | 241/18723 | 3.80e-06 | 5.83e-05 | 68 |
| GO:00000825 | Prostate | BPH | G1/S transition of mitotic cell cycle | 62/3107 | 214/18723 | 3.93e-06 | 5.97e-05 | 62 |
| GO:00709368 | Prostate | BPH | protein K48-linked ubiquitination | 26/3107 | 65/18723 | 5.90e-06 | 8.64e-05 | 26 |
| GO:00002099 | Prostate | BPH | protein polyubiquitination | 64/3107 | 236/18723 | 2.83e-05 | 3.31e-04 | 64 |
| GO:00065134 | Prostate | BPH | protein monoubiquitination | 20/3107 | 67/18723 | 4.93e-03 | 2.33e-02 | 20 |
| GO:009719319 | Prostate | Tumor | intrinsic apoptotic signaling pathway | 113/3246 | 288/18723 | 6.79e-19 | 2.64e-16 | 113 |
| GO:001049819 | Prostate | Tumor | proteasomal protein catabolic process | 158/3246 | 490/18723 | 3.05e-16 | 6.76e-14 | 158 |
| GO:004316119 | Prostate | Tumor | proteasome-mediated ubiquitin-dependent protein catabolic process | 130/3246 | 412/18723 | 7.97e-13 | 8.00e-11 | 130 |
| GO:003367417 | Prostate | Tumor | positive regulation of kinase activity | 123/3246 | 467/18723 | 5.36e-07 | 1.15e-05 | 123 |
| GO:004586015 | Prostate | Tumor | positive regulation of protein kinase activity | 105/3246 | 386/18723 | 7.09e-07 | 1.43e-05 | 105 |
| GO:007093615 | Prostate | Tumor | protein K48-linked ubiquitination | 26/3246 | 65/18723 | 1.33e-05 | 1.83e-04 | 26 |
| GO:000008212 | Prostate | Tumor | G1/S transition of mitotic cell cycle | 62/3246 | 214/18723 | 1.63e-05 | 2.18e-04 | 62 |
| GO:004484312 | Prostate | Tumor | cell cycle G1/S phase transition | 67/3246 | 241/18723 | 3.28e-05 | 3.88e-04 | 67 |
| GO:004477214 | Prostate | Tumor | mitotic cell cycle phase transition | 106/3246 | 424/18723 | 3.61e-05 | 4.21e-04 | 106 |
| GO:000020914 | Prostate | Tumor | protein polyubiquitination | 64/3246 | 236/18723 | 1.08e-04 | 1.03e-03 | 64 |
| GO:000651312 | Prostate | Tumor | protein monoubiquitination | 21/3246 | 67/18723 | 3.61e-03 | 1.86e-02 | 21 |
| GO:009719328 | Skin | AK | intrinsic apoptotic signaling pathway | 82/1910 | 288/18723 | 2.01e-18 | 2.97e-15 | 82 |
| GO:001049827 | Skin | AK | proteasomal protein catabolic process | 97/1910 | 490/18723 | 9.65e-11 | 1.54e-08 | 97 |
| GO:004316127 | Skin | AK | proteasome-mediated ubiquitin-dependent protein catabolic process | 84/1910 | 412/18723 | 3.96e-10 | 4.88e-08 | 84 |
| GO:004477210 | Skin | AK | mitotic cell cycle phase transition | 83/1910 | 424/18723 | 3.81e-09 | 3.05e-07 | 83 |
| Pathway ID | Tissue | Disease Stage | Description | Gene Ratio | Bg Ratio | pvalue | p.adjust | qvalue | Count |
| hsa04141211 | Esophagus | ESCC | Protein processing in endoplasmic reticulum | 147/4205 | 174/8465 | 3.29e-22 | 1.10e-19 | 5.64e-20 | 147 |
| hsa0412027 | Esophagus | ESCC | Ubiquitin mediated proteolysis | 122/4205 | 142/8465 | 6.53e-20 | 7.29e-18 | 3.74e-18 | 122 |
| hsa0411023 | Esophagus | ESCC | Cell cycle | 126/4205 | 157/8465 | 1.34e-15 | 5.60e-14 | 2.87e-14 | 126 |
| hsa05131211 | Esophagus | ESCC | Shigellosis | 176/4205 | 247/8465 | 2.27e-12 | 4.01e-11 | 2.05e-11 | 176 |
| hsa05170210 | Esophagus | ESCC | Human immunodeficiency virus 1 infection | 147/4205 | 212/8465 | 3.37e-09 | 3.53e-08 | 1.81e-08 | 147 |
| hsa043507 | Esophagus | ESCC | TGF-beta signaling pathway | 69/4205 | 108/8465 | 1.92e-03 | 5.54e-03 | 2.84e-03 | 69 |
| hsa047105 | Esophagus | ESCC | Circadian rhythm | 24/4205 | 34/8465 | 1.09e-02 | 2.51e-02 | 1.29e-02 | 24 |
| hsa041146 | Esophagus | ESCC | Oocyte meiosis | 77/4205 | 131/8465 | 2.19e-02 | 4.80e-02 | 2.46e-02 | 77 |
| hsa04141310 | Esophagus | ESCC | Protein processing in endoplasmic reticulum | 147/4205 | 174/8465 | 3.29e-22 | 1.10e-19 | 5.64e-20 | 147 |
| hsa0412036 | Esophagus | ESCC | Ubiquitin mediated proteolysis | 122/4205 | 142/8465 | 6.53e-20 | 7.29e-18 | 3.74e-18 | 122 |
| hsa0411033 | Esophagus | ESCC | Cell cycle | 126/4205 | 157/8465 | 1.34e-15 | 5.60e-14 | 2.87e-14 | 126 |
| hsa05131310 | Esophagus | ESCC | Shigellosis | 176/4205 | 247/8465 | 2.27e-12 | 4.01e-11 | 2.05e-11 | 176 |
| hsa0517038 | Esophagus | ESCC | Human immunodeficiency virus 1 infection | 147/4205 | 212/8465 | 3.37e-09 | 3.53e-08 | 1.81e-08 | 147 |
| hsa0435014 | Esophagus | ESCC | TGF-beta signaling pathway | 69/4205 | 108/8465 | 1.92e-03 | 5.54e-03 | 2.84e-03 | 69 |
| hsa0471012 | Esophagus | ESCC | Circadian rhythm | 24/4205 | 34/8465 | 1.09e-02 | 2.51e-02 | 1.29e-02 | 24 |
| hsa0411411 | Esophagus | ESCC | Oocyte meiosis | 77/4205 | 131/8465 | 2.19e-02 | 4.80e-02 | 2.46e-02 | 77 |
| hsa0412010 | Liver | NAFLD | Ubiquitin mediated proteolysis | 44/1043 | 142/8465 | 2.59e-09 | 1.70e-07 | 1.37e-07 | 44 |
| hsa0513114 | Liver | NAFLD | Shigellosis | 48/1043 | 247/8465 | 7.82e-04 | 1.17e-02 | 9.39e-03 | 48 |
| hsa0412011 | Liver | NAFLD | Ubiquitin mediated proteolysis | 44/1043 | 142/8465 | 2.59e-09 | 1.70e-07 | 1.37e-07 | 44 |
| hsa0513115 | Liver | NAFLD | Shigellosis | 48/1043 | 247/8465 | 7.82e-04 | 1.17e-02 | 9.39e-03 | 48 |
| Hugo Symbol | Variant Class | Variant Classification | dbSNP RS | HGVSc | HGVSp | HGVSp Short | SWISSPROT | BIOTYPE | SIFT | PolyPhen | Tumor Sample Barcode | Tissue | Histology | Sex | Age | Stage | Therapy Types | Drugs | Outcome |
| CUL1 | SNV | Missense_Mutation | novel | c.1711N>C | p.Ala571Pro | p.A571P | Q13616 | protein_coding | tolerated(0.27) | benign(0.39) | TCGA-A2-A0SV-01 | Breast | breast invasive carcinoma | Female | <65 | III/IV | Other, specify in notesBisphosphonate therapy | zometa | PD |
| CUL1 | SNV | Missense_Mutation | novel | c.1181N>G | p.Ala394Gly | p.A394G | Q13616 | protein_coding | deleterious(0.01) | probably_damaging(0.917) | TCGA-A2-A1G4-01 | Breast | breast invasive carcinoma | Female | >=65 | III/IV | Chemotherapy | adriamycin | SD |
| CUL1 | SNV | Missense_Mutation | novel | c.1555G>A | p.Glu519Lys | p.E519K | Q13616 | protein_coding | tolerated(0.24) | possibly_damaging(0.514) | TCGA-AN-A046-01 | Breast | breast invasive carcinoma | Female | >=65 | I/II | Unknown | Unknown | SD |
| CUL1 | SNV | Missense_Mutation | | c.721G>C | p.Glu241Gln | p.E241Q | Q13616 | protein_coding | deleterious(0.02) | possibly_damaging(0.762) | TCGA-AQ-A0Y5-01 | Breast | breast invasive carcinoma | Female | >=65 | III/IV | Chemotherapy | cytoxan | SD |
| CUL1 | SNV | Missense_Mutation | novel | c.1660N>T | p.Ala554Ser | p.A554S | Q13616 | protein_coding | tolerated(1) | benign(0.001) | TCGA-AR-A24Q-01 | Breast | breast invasive carcinoma | Female | <65 | I/II | Chemotherapy | doxorubicin | SD |
| CUL1 | SNV | Missense_Mutation | novel | c.1118N>C | p.Val373Ala | p.V373A | Q13616 | protein_coding | deleterious(0.03) | probably_damaging(0.942) | TCGA-BH-A0HA-01 | Breast | breast invasive carcinoma | Female | <65 | I/II | Unknown | Unknown | SD |
| CUL1 | SNV | Missense_Mutation | novel | c.1181C>G | p.Ala394Gly | p.A394G | Q13616 | protein_coding | deleterious(0.01) | probably_damaging(0.917) | TCGA-BH-A0HU-01 | Breast | breast invasive carcinoma | Female | <65 | I/II | Chemotherapy | docetaxel | SD |
| CUL1 | SNV | Missense_Mutation | | c.1549N>G | p.Leu517Val | p.L517V | Q13616 | protein_coding | deleterious(0) | probably_damaging(0.947) | TCGA-BH-A0RX-01 | Breast | breast invasive carcinoma | Female | <65 | I/II | Chemotherapy | fluorouracil | SD |
| CUL1 | SNV | Missense_Mutation | | c.436C>T | p.Arg146Cys | p.R146C | Q13616 | protein_coding | deleterious(0) | benign(0.063) | TCGA-E2-A1AZ-01 | Breast | breast invasive carcinoma | Female | <65 | I/II | Chemotherapy | adriamycin | SD |
| CUL1 | SNV | Missense_Mutation | novel | c.2110G>C | p.Glu704Gln | p.E704Q | Q13616 | protein_coding | deleterious(0) | probably_damaging(0.998) | TCGA-PL-A8LV-01 | Breast | breast invasive carcinoma | Female | <65 | III/IV | Unknown | Unknown | SD |


