
|
|||||
|
 | |
| |
| |
| |
| |
| |
|
Gene: CTDNEP1 |
Gene summary for CTDNEP1 |
| Gene information | Species | Human | Gene symbol | CTDNEP1 | Gene ID | 23399 |
| Gene name | CTD nuclear envelope phosphatase 1 | |
| Gene Alias | DULLARD | |
| Cytomap | 17p13.1 | |
| Gene Type | protein-coding | GO ID | GO:0000003 | UniProtAcc | O95476 |
Top |
Malignant transformation analysis |
| Identification of the aberrant gene expression in precancerous and cancerous lesions by comparing the gene expression of stem-like cells in diseased tissues with normal stem cells |
| Entrez ID | Symbol | Replicates | Species | Organ | Tissue | Adj P-value | Log2FC | Malignancy |
| 23399 | CTDNEP1 | LZE4T | Human | Esophagus | ESCC | 4.45e-05 | -4.31e-02 | 0.0811 |
| 23399 | CTDNEP1 | LZE5T | Human | Esophagus | ESCC | 3.54e-03 | 1.37e-01 | 0.0514 |
| 23399 | CTDNEP1 | LZE7T | Human | Esophagus | ESCC | 2.18e-02 | 5.81e-02 | 0.0667 |
| 23399 | CTDNEP1 | LZE8T | Human | Esophagus | ESCC | 2.24e-05 | -8.13e-02 | 0.067 |
| 23399 | CTDNEP1 | LZE20T | Human | Esophagus | ESCC | 4.68e-06 | -3.93e-02 | 0.0662 |
| 23399 | CTDNEP1 | LZE22D1 | Human | Esophagus | HGIN | 3.91e-02 | -8.24e-02 | 0.0595 |
| 23399 | CTDNEP1 | LZE22T | Human | Esophagus | ESCC | 1.61e-04 | 1.89e-01 | 0.068 |
| 23399 | CTDNEP1 | LZE24T | Human | Esophagus | ESCC | 9.40e-14 | 3.25e-01 | 0.0596 |
| 23399 | CTDNEP1 | LZE6T | Human | Esophagus | ESCC | 2.63e-06 | -5.95e-03 | 0.0845 |
| 23399 | CTDNEP1 | P1T-E | Human | Esophagus | ESCC | 5.22e-05 | 1.89e-01 | 0.0875 |
| 23399 | CTDNEP1 | P2T-E | Human | Esophagus | ESCC | 2.01e-15 | 2.56e-02 | 0.1177 |
| 23399 | CTDNEP1 | P4T-E | Human | Esophagus | ESCC | 2.67e-10 | 3.39e-01 | 0.1323 |
| 23399 | CTDNEP1 | P5T-E | Human | Esophagus | ESCC | 3.23e-11 | -1.93e-02 | 0.1327 |
| 23399 | CTDNEP1 | P8T-E | Human | Esophagus | ESCC | 1.55e-18 | 1.49e-01 | 0.0889 |
| 23399 | CTDNEP1 | P9T-E | Human | Esophagus | ESCC | 4.19e-09 | 1.71e-01 | 0.1131 |
| 23399 | CTDNEP1 | P10T-E | Human | Esophagus | ESCC | 3.91e-17 | 2.75e-02 | 0.116 |
| 23399 | CTDNEP1 | P11T-E | Human | Esophagus | ESCC | 2.49e-13 | 2.65e-01 | 0.1426 |
| 23399 | CTDNEP1 | P12T-E | Human | Esophagus | ESCC | 4.60e-13 | 6.53e-02 | 0.1122 |
| 23399 | CTDNEP1 | P15T-E | Human | Esophagus | ESCC | 5.05e-11 | -2.27e-02 | 0.1149 |
| 23399 | CTDNEP1 | P16T-E | Human | Esophagus | ESCC | 3.02e-13 | -2.04e-02 | 0.1153 |
| Page: 1 2 3 4 5 6 7 |
| Tissue | Expression Dynamics | Abbreviation |
| Esophagus |  | ESCC: Esophageal squamous cell carcinoma |
| HGIN: High-grade intraepithelial neoplasias | ||
| LGIN: Low-grade intraepithelial neoplasias | ||
| Liver | 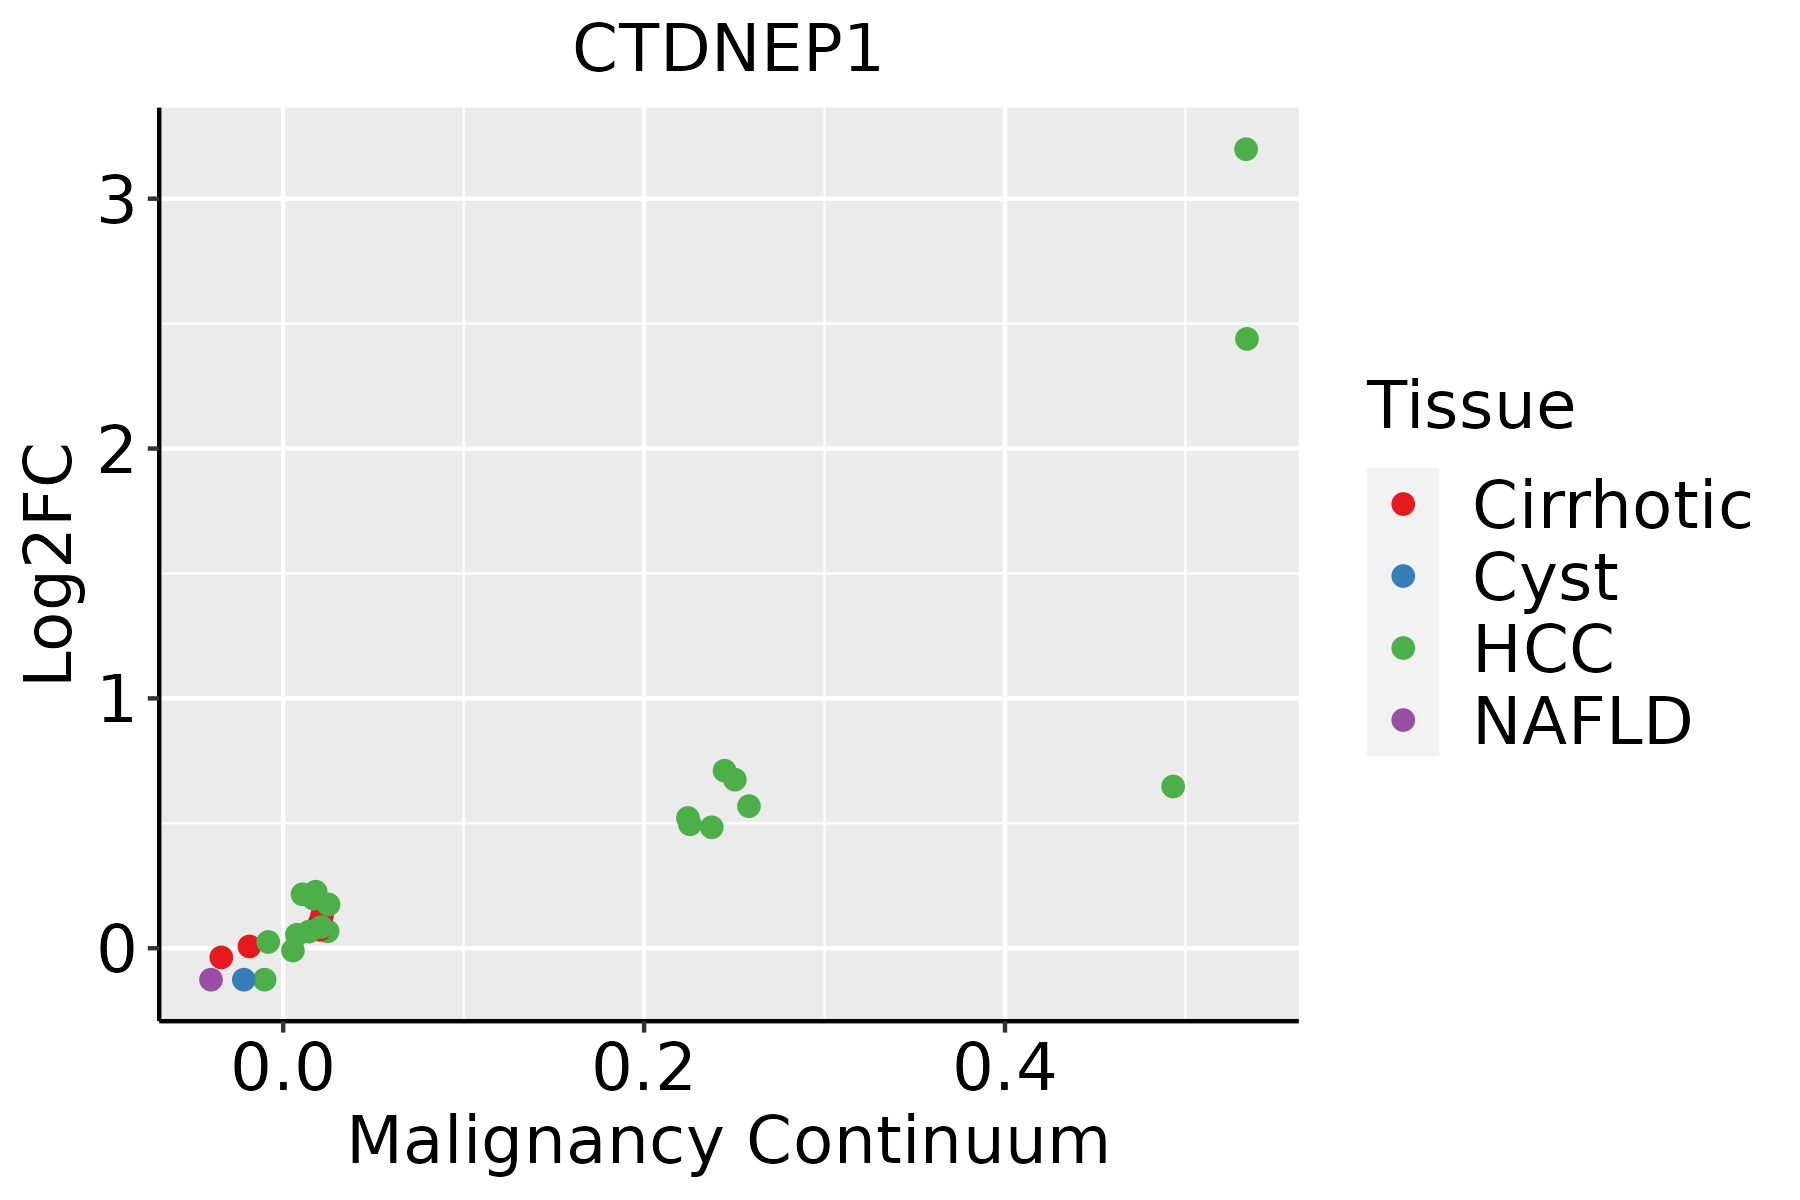 | HCC: Hepatocellular carcinoma |
| NAFLD: Non-alcoholic fatty liver disease | ||
| Oral Cavity |  | EOLP: Erosive Oral lichen planus |
| LP: leukoplakia | ||
| NEOLP: Non-erosive oral lichen planus | ||
| OSCC: Oral squamous cell carcinoma | ||
| Skin |  | AK: Actinic keratosis |
| cSCC: Cutaneous squamous cell carcinoma | ||
| SCCIS:squamous cell carcinoma in situ | ||
| Thyroid | 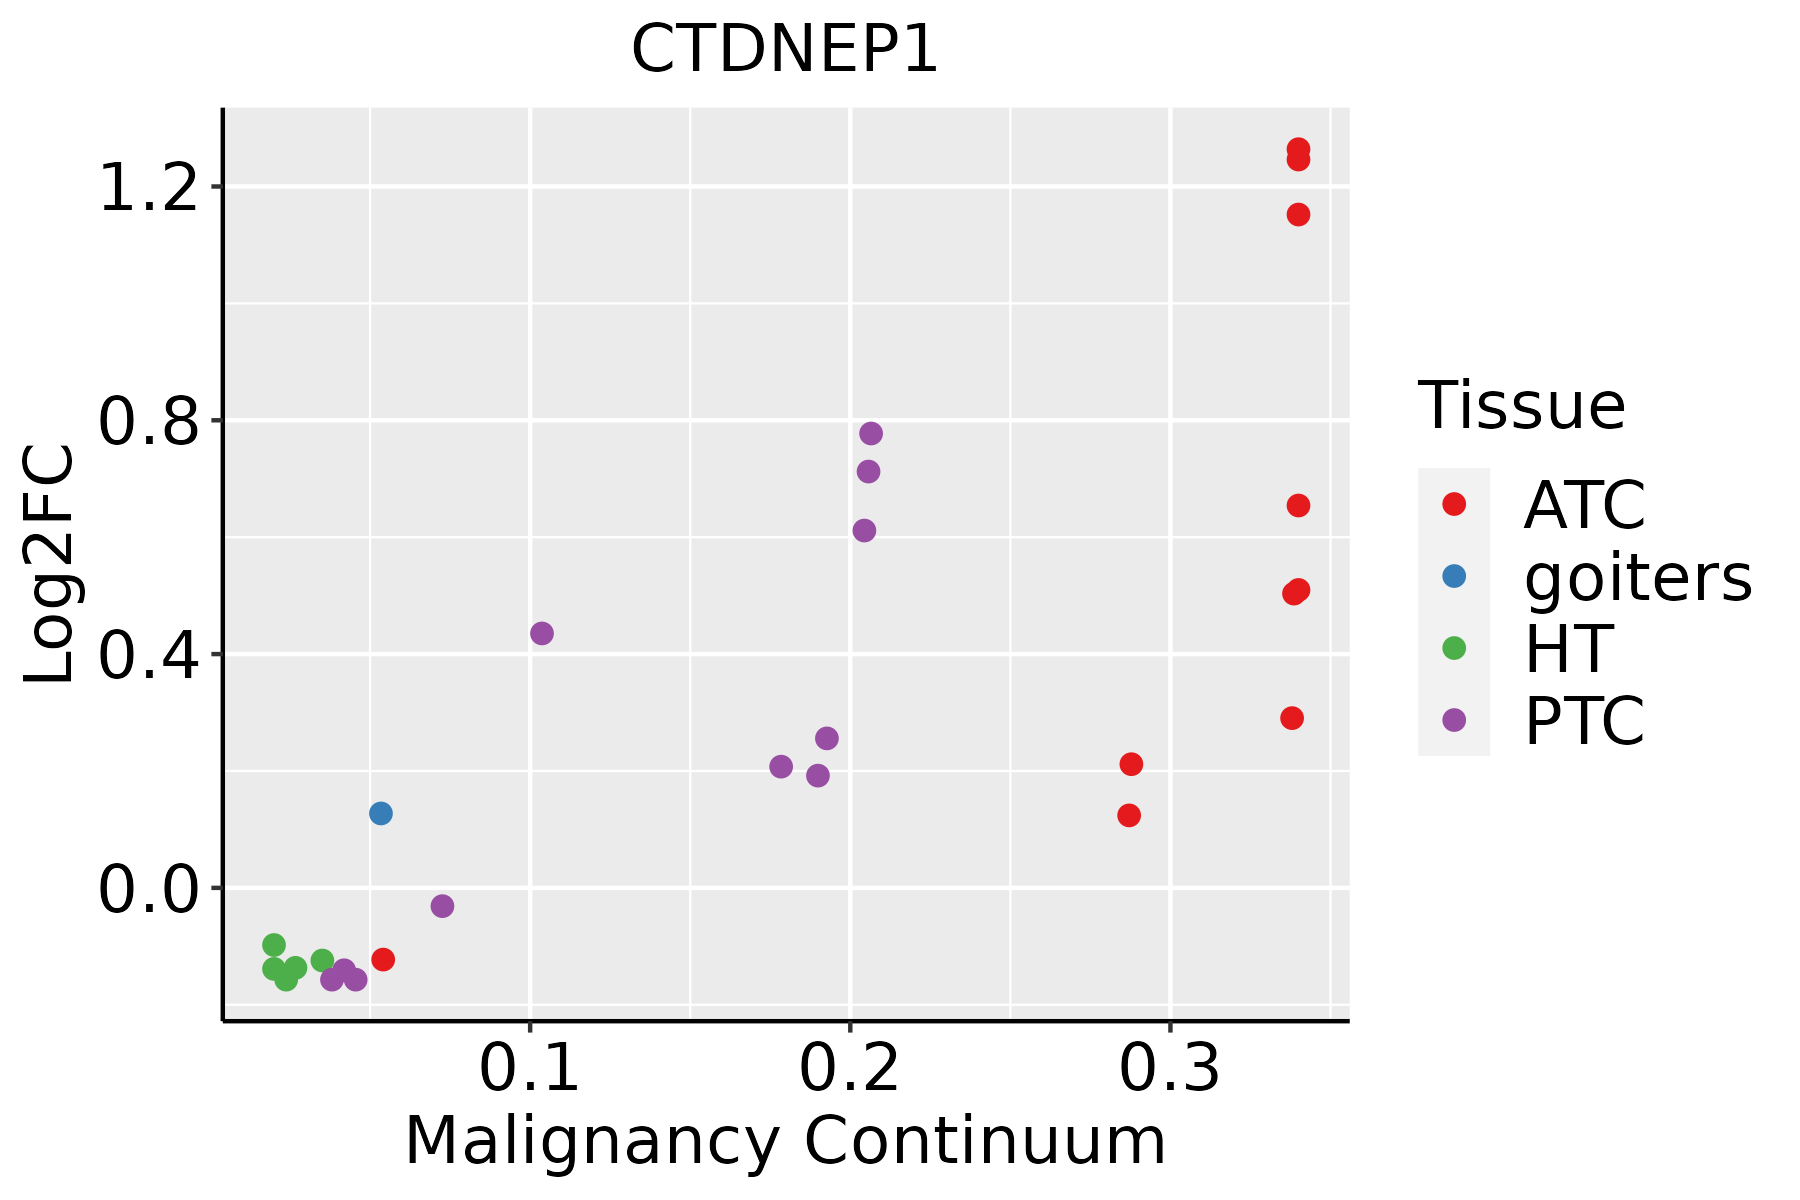 | ATC: Anaplastic thyroid cancer |
| HT: Hashimoto's thyroiditis | ||
| PTC: Papillary thyroid cancer |
| ∗log2FC in expression of this searched gene in stem-like cells from each diseased tissue sample relative to stem-like cells in normal samples in each tissue plotted against the malignancy continuum. Samples are colored based on if they are from different disease stage. |
Top |
Malignant transformation related pathway analysis |
| Find out the enriched GO biological processes and KEGG pathways involved in transition from healthy to precancer to cancer |
| Tissue | Disease Stage | Enriched GO biological Processes |
| Colorectum | AD |  |
| Colorectum | SER |  |
| Colorectum | MSS |  |
| Colorectum | MSI-H |  |
| Colorectum | FAP |  |
| ∗Top 15 enriched GO BP terms are showed in the bar plot of each disease state in each tissue. Each row represents a significant GO biological process which is colored according to the -log10(p.adjust). |
| Page: 1 2 3 4 5 6 7 8 9 |
| GO ID | Tissue | Disease Stage | Description | Gene Ratio | Bg Ratio | pvalue | p.adjust | Count |
| GO:000647024 | Skin | cSCC | protein dephosphorylation | 111/4864 | 281/18723 | 4.10e-07 | 7.96e-06 | 111 |
| GO:00717635 | Skin | cSCC | nuclear membrane organization | 22/4864 | 33/18723 | 1.09e-06 | 1.93e-05 | 22 |
| GO:00069984 | Skin | cSCC | nuclear envelope organization | 28/4864 | 47/18723 | 1.17e-06 | 2.03e-05 | 28 |
| GO:001605524 | Skin | cSCC | Wnt signaling pathway | 158/4864 | 444/18723 | 3.80e-06 | 5.70e-05 | 158 |
| GO:019873824 | Skin | cSCC | cell-cell signaling by wnt | 158/4864 | 446/18723 | 5.08e-06 | 7.38e-05 | 158 |
| GO:003011124 | Skin | cSCC | regulation of Wnt signaling pathway | 117/4864 | 328/18723 | 5.80e-05 | 5.75e-04 | 117 |
| GO:009026324 | Skin | cSCC | positive regulation of canonical Wnt signaling pathway | 45/4864 | 106/18723 | 1.61e-04 | 1.42e-03 | 45 |
| GO:003017724 | Skin | cSCC | positive regulation of Wnt signaling pathway | 55/4864 | 140/18723 | 3.72e-04 | 2.92e-03 | 55 |
| GO:006007024 | Skin | cSCC | canonical Wnt signaling pathway | 104/4864 | 303/18723 | 7.13e-04 | 5.03e-03 | 104 |
| GO:006082824 | Skin | cSCC | regulation of canonical Wnt signaling pathway | 87/4864 | 253/18723 | 1.74e-03 | 1.06e-02 | 87 |
| GO:001631115 | Skin | cSCC | dephosphorylation | 134/4864 | 417/18723 | 2.65e-03 | 1.50e-02 | 134 |
| GO:00510814 | Skin | cSCC | nuclear envelope disassembly | 7/4864 | 11/18723 | 9.45e-03 | 4.25e-02 | 7 |
| GO:0034504111 | Thyroid | PTC | protein localization to nucleus | 170/5968 | 290/18723 | 3.34e-21 | 6.38e-19 | 170 |
| GO:0022411113 | Thyroid | PTC | cellular component disassembly | 232/5968 | 443/18723 | 1.36e-19 | 1.75e-17 | 232 |
| GO:0016055110 | Thyroid | PTC | Wnt signaling pathway | 217/5968 | 444/18723 | 3.71e-14 | 2.30e-12 | 217 |
| GO:0198738110 | Thyroid | PTC | cell-cell signaling by wnt | 217/5968 | 446/18723 | 6.68e-14 | 3.73e-12 | 217 |
| GO:0030111110 | Thyroid | PTC | regulation of Wnt signaling pathway | 163/5968 | 328/18723 | 1.05e-11 | 4.29e-10 | 163 |
| GO:0060828110 | Thyroid | PTC | regulation of canonical Wnt signaling pathway | 123/5968 | 253/18723 | 1.83e-08 | 4.26e-07 | 123 |
| GO:0060070110 | Thyroid | PTC | canonical Wnt signaling pathway | 141/5968 | 303/18723 | 5.71e-08 | 1.21e-06 | 141 |
| GO:003017719 | Thyroid | PTC | positive regulation of Wnt signaling pathway | 72/5968 | 140/18723 | 1.16e-06 | 1.69e-05 | 72 |
| Page: 1 2 3 4 5 6 7 8 |
| Pathway ID | Tissue | Disease Stage | Description | Gene Ratio | Bg Ratio | pvalue | p.adjust | qvalue | Count |
| Page: 1 |
Top |
Cell-cell communication analysis |
| Identification of potential cell-cell interactions between two cell types and their ligand-receptor pairs for different disease states |
| Ligand | Receptor | LRpair | Pathway | Tissue | Disease Stage |
| Page: 1 |
Top |
Single-cell gene regulatory network inference analysis |
| Find out the significant the regulons (TFs) and the target genes of each regulon across cell types for different disease states |
| TF | Cell Type | Tissue | Disease Stage | Target Gene | RSS | Regulon Activity |
| ∗The dot plots of a searched regulon are shown for all cell subpopulations in each disease state of each tissue based on the regulon specific score inferred using pySCENIC and by calculating the average expression. |
| Page: 1 |
Top |
Somatic mutation of malignant transformation related genes |
| Annotation of somatic variants for genes involved in malignant transformation |
| Hugo Symbol | Variant Class | Variant Classification | dbSNP RS | HGVSc | HGVSp | HGVSp Short | SWISSPROT | BIOTYPE | SIFT | PolyPhen | Tumor Sample Barcode | Tissue | Histology | Sex | Age | Stage | Therapy Types | Drugs | Outcome |
| CTDNEP1 | insertion | Frame_Shift_Ins | novel | c.213_214insGGGAG | p.Leu72GlyfsTer12 | p.L72Gfs*12 | O95476 | protein_coding | TCGA-AN-A0FJ-01 | Breast | breast invasive carcinoma | Female | <65 | III/IV | Unknown | Unknown | SD | ||
| CTDNEP1 | insertion | Frame_Shift_Ins | novel | c.657_658insCCCA | p.Met220ProfsTer11 | p.M220Pfs*11 | O95476 | protein_coding | TCGA-EK-A2PG-01 | Cervix | cervical & endocervical cancer | Female | >=65 | I/II | Unknown | Unknown | SD | ||
| CTDNEP1 | SNV | Missense_Mutation | rs748108988 | c.158N>A | p.Arg53Gln | p.R53Q | O95476 | protein_coding | tolerated(0.18) | benign(0.042) | TCGA-AA-3672-01 | Colorectum | colon adenocarcinoma | Female | >=65 | III/IV | Unknown | Unknown | SD |
| CTDNEP1 | SNV | Missense_Mutation | rs759009701 | c.697G>A | p.Val233Met | p.V233M | O95476 | protein_coding | deleterious(0) | possibly_damaging(0.756) | TCGA-AA-3947-01 | Colorectum | colon adenocarcinoma | Female | <65 | I/II | Unknown | Unknown | SD |
| CTDNEP1 | SNV | Missense_Mutation | c.376G>A | p.Glu126Lys | p.E126K | O95476 | protein_coding | tolerated(0.1) | possibly_damaging(0.703) | TCGA-AA-A010-01 | Colorectum | colon adenocarcinoma | Female | <65 | I/II | Chemotherapy | folinic | CR | |
| CTDNEP1 | SNV | Missense_Mutation | c.431N>C | p.Lys144Thr | p.K144T | O95476 | protein_coding | tolerated(0.13) | possibly_damaging(0.568) | TCGA-CA-6717-01 | Colorectum | colon adenocarcinoma | Male | <65 | I/II | Chemotherapy | oxaliplatin | CR | |
| CTDNEP1 | SNV | Missense_Mutation | c.7C>T | p.Arg3Trp | p.R3W | O95476 | protein_coding | tolerated_low_confidence(0.12) | benign(0.232) | TCGA-CK-4951-01 | Colorectum | colon adenocarcinoma | Female | >=65 | I/II | Unknown | Unknown | PD | |
| CTDNEP1 | SNV | Missense_Mutation | c.376N>A | p.Glu126Lys | p.E126K | O95476 | protein_coding | tolerated(0.1) | possibly_damaging(0.703) | TCGA-AG-A002-01 | Colorectum | rectum adenocarcinoma | Male | <65 | I/II | Unknown | Unknown | SD | |
| CTDNEP1 | SNV | Missense_Mutation | novel | c.125G>A | p.Arg42Gln | p.R42Q | O95476 | protein_coding | tolerated(0.08) | benign(0.162) | TCGA-AX-A06F-01 | Endometrium | uterine corpus endometrioid carcinoma | Female | <65 | III/IV | Chemotherapy | carboplatin | SD |
| CTDNEP1 | SNV | Missense_Mutation | novel | c.609A>C | p.Lys203Asn | p.K203N | O95476 | protein_coding | deleterious(0.03) | probably_damaging(0.944) | TCGA-AX-A2HC-01 | Endometrium | uterine corpus endometrioid carcinoma | Female | <65 | III/IV | Chemotherapy | paclitaxel | PD |
| Page: 1 2 |
Top |
Related drugs of malignant transformation related genes |
| Identification of chemicals and drugs interact with genes involved in malignant transfromation |
| (DGIdb 4.0) |
| Entrez ID | Symbol | Category | Interaction Types | Drug Claim Name | Drug Name | PMIDs |
| Page: 1 |

Copyright 2023-Present -The University of Texas Health Science Center at Houston |