
|
|||||
|
 | |
| |
| |
| |
| |
| |
|
Gene: CLN3 |
Gene summary for CLN3 |
| Gene information | Species | Human | Gene symbol | CLN3 | Gene ID | 1201 |
| Gene name | CLN3 lysosomal/endosomal transmembrane protein, battenin | |
| Gene Alias | BTN1 | |
| Cytomap | 16p12.1 | |
| Gene Type | protein-coding | GO ID | GO:0000820 | UniProtAcc | A0A024QZB8 |
Top |
Malignant transformation analysis |
| Identification of the aberrant gene expression in precancerous and cancerous lesions by comparing the gene expression of stem-like cells in diseased tissues with normal stem cells |
| Entrez ID | Symbol | Replicates | Species | Organ | Tissue | Adj P-value | Log2FC | Malignancy |
| 1201 | CLN3 | LZE2T | Human | Esophagus | ESCC | 2.18e-04 | 4.66e-01 | 0.082 |
| 1201 | CLN3 | LZE4T | Human | Esophagus | ESCC | 1.55e-10 | 3.08e-01 | 0.0811 |
| 1201 | CLN3 | LZE5T | Human | Esophagus | ESCC | 1.40e-06 | 4.90e-01 | 0.0514 |
| 1201 | CLN3 | LZE7T | Human | Esophagus | ESCC | 2.07e-09 | 3.99e-01 | 0.0667 |
| 1201 | CLN3 | LZE8T | Human | Esophagus | ESCC | 1.08e-12 | 3.57e-01 | 0.067 |
| 1201 | CLN3 | LZE20T | Human | Esophagus | ESCC | 6.75e-22 | 5.34e-01 | 0.0662 |
| 1201 | CLN3 | LZE22D1 | Human | Esophagus | HGIN | 3.26e-02 | 1.82e-01 | 0.0595 |
| 1201 | CLN3 | LZE22T | Human | Esophagus | ESCC | 1.28e-07 | 4.66e-01 | 0.068 |
| 1201 | CLN3 | LZE24T | Human | Esophagus | ESCC | 1.36e-45 | 1.19e+00 | 0.0596 |
| 1201 | CLN3 | LZE22D3 | Human | Esophagus | HGIN | 1.73e-02 | 3.63e-01 | 0.0653 |
| 1201 | CLN3 | LZE21T | Human | Esophagus | ESCC | 1.37e-06 | 3.44e-01 | 0.0655 |
| 1201 | CLN3 | LZE6T | Human | Esophagus | ESCC | 2.96e-03 | 1.72e-01 | 0.0845 |
| 1201 | CLN3 | P1T-E | Human | Esophagus | ESCC | 1.94e-26 | 1.01e+00 | 0.0875 |
| 1201 | CLN3 | P2T-E | Human | Esophagus | ESCC | 1.67e-63 | 9.21e-01 | 0.1177 |
| 1201 | CLN3 | P4T-E | Human | Esophagus | ESCC | 3.07e-68 | 1.29e+00 | 0.1323 |
| 1201 | CLN3 | P5T-E | Human | Esophagus | ESCC | 2.86e-20 | 3.54e-01 | 0.1327 |
| 1201 | CLN3 | P8T-E | Human | Esophagus | ESCC | 6.89e-44 | 7.34e-01 | 0.0889 |
| 1201 | CLN3 | P9T-E | Human | Esophagus | ESCC | 5.74e-10 | 2.28e-01 | 0.1131 |
| 1201 | CLN3 | P10T-E | Human | Esophagus | ESCC | 6.56e-15 | 3.12e-01 | 0.116 |
| 1201 | CLN3 | P11T-E | Human | Esophagus | ESCC | 2.88e-23 | 6.84e-01 | 0.1426 |
| Page: 1 2 3 4 5 6 |
| Tissue | Expression Dynamics | Abbreviation |
| Esophagus |  | ESCC: Esophageal squamous cell carcinoma |
| HGIN: High-grade intraepithelial neoplasias | ||
| LGIN: Low-grade intraepithelial neoplasias | ||
| Liver |  | HCC: Hepatocellular carcinoma |
| NAFLD: Non-alcoholic fatty liver disease | ||
| Oral Cavity | 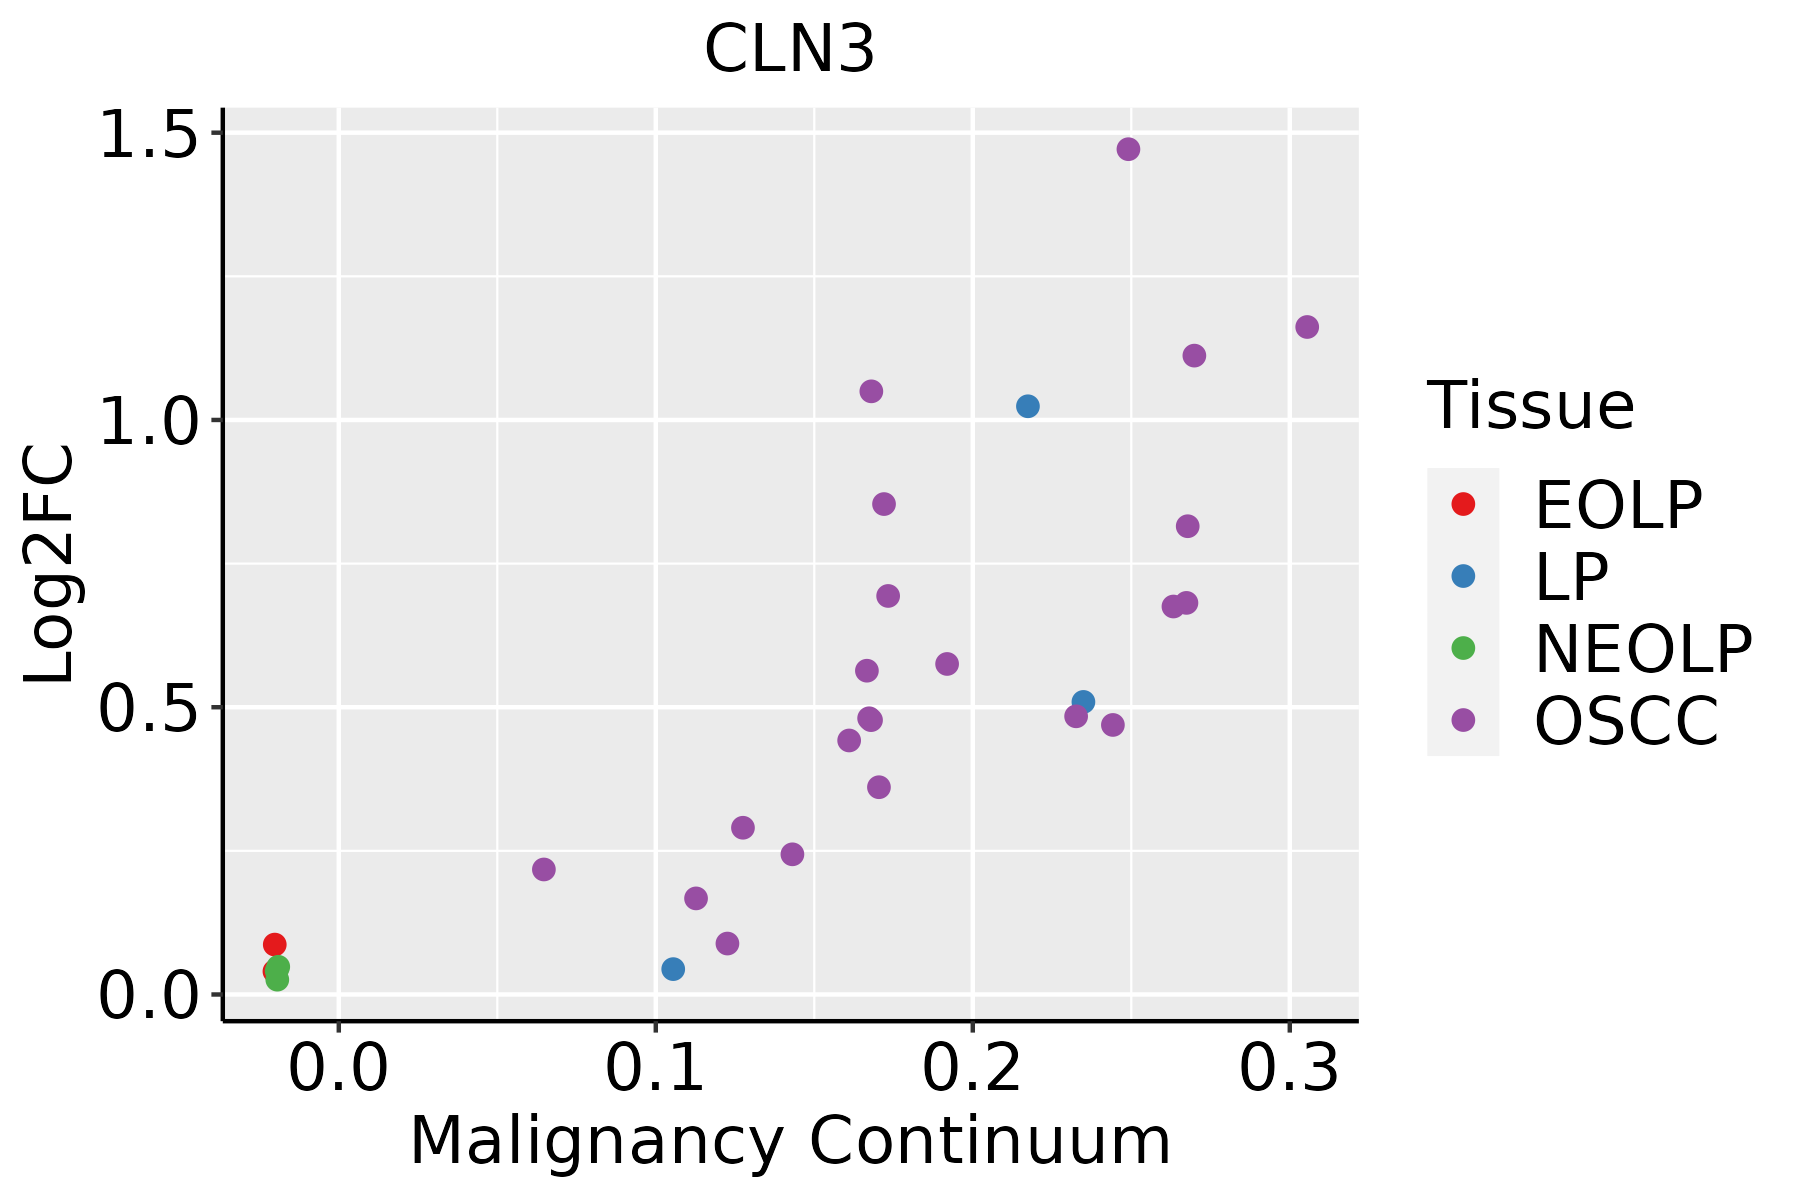 | EOLP: Erosive Oral lichen planus |
| LP: leukoplakia | ||
| NEOLP: Non-erosive oral lichen planus | ||
| OSCC: Oral squamous cell carcinoma |
| ∗log2FC in expression of this searched gene in stem-like cells from each diseased tissue sample relative to stem-like cells in normal samples in each tissue plotted against the malignancy continuum. Samples are colored based on if they are from different disease stage. |
Top |
Malignant transformation related pathway analysis |
| Find out the enriched GO biological processes and KEGG pathways involved in transition from healthy to precancer to cancer |
| Tissue | Disease Stage | Enriched GO biological Processes |
| Colorectum | AD |  |
| Colorectum | SER |  |
| Colorectum | MSS |  |
| Colorectum | MSI-H |  |
| Colorectum | FAP |  |
| ∗Top 15 enriched GO BP terms are showed in the bar plot of each disease state in each tissue. Each row represents a significant GO biological process which is colored according to the -log10(p.adjust). |
| Page: 1 2 3 4 5 6 7 8 9 |
| GO ID | Tissue | Disease Stage | Description | Gene Ratio | Bg Ratio | pvalue | p.adjust | Count |
| GO:00069707 | Esophagus | ESCC | response to osmotic stress | 57/8552 | 84/18723 | 3.26e-05 | 2.70e-04 | 57 |
| GO:01400567 | Esophagus | ESCC | organelle localization by membrane tethering | 53/8552 | 77/18723 | 3.33e-05 | 2.74e-04 | 53 |
| GO:00973523 | Esophagus | ESCC | autophagosome maturation | 31/8552 | 40/18723 | 4.04e-05 | 3.26e-04 | 31 |
| GO:00066505 | Esophagus | ESCC | glycerophospholipid metabolic process | 174/8552 | 306/18723 | 4.92e-05 | 3.85e-04 | 174 |
| GO:000689818 | Esophagus | ESCC | receptor-mediated endocytosis | 142/8552 | 244/18723 | 5.22e-05 | 4.05e-04 | 142 |
| GO:00995185 | Esophagus | ESCC | vesicle cytoskeletal trafficking | 50/8552 | 73/18723 | 6.75e-05 | 5.12e-04 | 50 |
| GO:00714707 | Esophagus | ESCC | cellular response to osmotic stress | 31/8552 | 41/18723 | 9.32e-05 | 6.68e-04 | 31 |
| GO:0045861111 | Esophagus | ESCC | negative regulation of proteolysis | 195/8552 | 351/18723 | 1.13e-04 | 7.85e-04 | 195 |
| GO:00086525 | Esophagus | ESCC | cellular amino acid biosynthetic process | 51/8552 | 76/18723 | 1.30e-04 | 8.88e-04 | 51 |
| GO:190437719 | Esophagus | ESCC | positive regulation of protein localization to cell periphery | 47/8552 | 69/18723 | 1.37e-04 | 9.27e-04 | 47 |
| GO:190307817 | Esophagus | ESCC | positive regulation of protein localization to plasma membrane | 43/8552 | 62/18723 | 1.38e-04 | 9.35e-04 | 43 |
| GO:00610254 | Esophagus | ESCC | membrane fusion | 98/8552 | 163/18723 | 1.39e-04 | 9.41e-04 | 98 |
| GO:00070353 | Esophagus | ESCC | vacuolar acidification | 20/8552 | 24/18723 | 1.69e-04 | 1.11e-03 | 20 |
| GO:00070423 | Esophagus | ESCC | lysosomal lumen acidification | 11/8552 | 11/18723 | 1.80e-04 | 1.16e-03 | 11 |
| GO:00083619 | Esophagus | ESCC | regulation of cell size | 107/8552 | 181/18723 | 1.81e-04 | 1.16e-03 | 107 |
| GO:00463948 | Esophagus | ESCC | carboxylic acid biosynthetic process | 175/8552 | 314/18723 | 1.98e-04 | 1.26e-03 | 175 |
| GO:00432446 | Esophagus | ESCC | regulation of protein-containing complex disassembly | 75/8552 | 121/18723 | 2.17e-04 | 1.36e-03 | 75 |
| GO:006049118 | Esophagus | ESCC | regulation of cell projection assembly | 110/8552 | 188/18723 | 2.60e-04 | 1.58e-03 | 110 |
| GO:00160538 | Esophagus | ESCC | organic acid biosynthetic process | 175/8552 | 316/18723 | 3.04e-04 | 1.82e-03 | 175 |
| GO:00620129 | Esophagus | ESCC | regulation of small molecule metabolic process | 184/8552 | 334/18723 | 3.11e-04 | 1.85e-03 | 184 |
| Page: 1 2 3 4 5 6 7 8 9 10 11 12 13 14 15 16 17 18 19 20 21 22 23 24 25 26 |
| Pathway ID | Tissue | Disease Stage | Description | Gene Ratio | Bg Ratio | pvalue | p.adjust | qvalue | Count |
| hsa041426 | Esophagus | HGIN | Lysosome | 33/1383 | 132/8465 | 6.65e-03 | 4.37e-02 | 3.47e-02 | 33 |
| hsa0414213 | Esophagus | HGIN | Lysosome | 33/1383 | 132/8465 | 6.65e-03 | 4.37e-02 | 3.47e-02 | 33 |
| hsa0414222 | Esophagus | ESCC | Lysosome | 102/4205 | 132/8465 | 5.11e-11 | 7.13e-10 | 3.65e-10 | 102 |
| hsa0414232 | Esophagus | ESCC | Lysosome | 102/4205 | 132/8465 | 5.11e-11 | 7.13e-10 | 3.65e-10 | 102 |
| hsa041424 | Liver | Cirrhotic | Lysosome | 68/2530 | 132/8465 | 1.34e-07 | 1.97e-06 | 1.21e-06 | 68 |
| hsa0414211 | Liver | Cirrhotic | Lysosome | 68/2530 | 132/8465 | 1.34e-07 | 1.97e-06 | 1.21e-06 | 68 |
| hsa041422 | Liver | HCC | Lysosome | 100/4020 | 132/8465 | 2.32e-11 | 4.31e-10 | 2.40e-10 | 100 |
| hsa041423 | Liver | HCC | Lysosome | 100/4020 | 132/8465 | 2.32e-11 | 4.31e-10 | 2.40e-10 | 100 |
| hsa041425 | Oral cavity | OSCC | Lysosome | 87/3704 | 132/8465 | 1.97e-07 | 1.35e-06 | 6.86e-07 | 87 |
| hsa0414212 | Oral cavity | OSCC | Lysosome | 87/3704 | 132/8465 | 1.97e-07 | 1.35e-06 | 6.86e-07 | 87 |
| hsa0414221 | Oral cavity | LP | Lysosome | 67/2418 | 132/8465 | 5.13e-08 | 7.77e-07 | 5.01e-07 | 67 |
| hsa0414231 | Oral cavity | LP | Lysosome | 67/2418 | 132/8465 | 5.13e-08 | 7.77e-07 | 5.01e-07 | 67 |
| Page: 1 |
Top |
Cell-cell communication analysis |
| Identification of potential cell-cell interactions between two cell types and their ligand-receptor pairs for different disease states |
| Ligand | Receptor | LRpair | Pathway | Tissue | Disease Stage |
| Page: 1 |
Top |
Single-cell gene regulatory network inference analysis |
| Find out the significant the regulons (TFs) and the target genes of each regulon across cell types for different disease states |
| TF | Cell Type | Tissue | Disease Stage | Target Gene | RSS | Regulon Activity |
| ∗The dot plots of a searched regulon are shown for all cell subpopulations in each disease state of each tissue based on the regulon specific score inferred using pySCENIC and by calculating the average expression. |
| Page: 1 |
Top |
Somatic mutation of malignant transformation related genes |
| Annotation of somatic variants for genes involved in malignant transformation |
| Hugo Symbol | Variant Class | Variant Classification | dbSNP RS | HGVSc | HGVSp | HGVSp Short | SWISSPROT | BIOTYPE | SIFT | PolyPhen | Tumor Sample Barcode | Tissue | Histology | Sex | Age | Stage | Therapy Types | Drugs | Outcome |
| CLN3 | SNV | Missense_Mutation | novel | c.825N>T | p.Trp275Cys | p.W275C | Q13286 | protein_coding | tolerated(0.12) | possibly_damaging(0.726) | TCGA-5L-AAT1-01 | Breast | breast invasive carcinoma | Female | <65 | III/IV | Hormone Therapy | letrozol | SD |
| CLN3 | SNV | Missense_Mutation | rs772851701 | c.181G>A | p.Asp61Asn | p.D61N | Q13286 | protein_coding | deleterious(0) | probably_damaging(1) | TCGA-A2-A0YD-01 | Breast | breast invasive carcinoma | Female | <65 | I/II | Chemotherapy | cytoxan | SD |
| CLN3 | SNV | Missense_Mutation | c.898N>G | p.Gln300Glu | p.Q300E | Q13286 | protein_coding | deleterious(0) | possibly_damaging(0.642) | TCGA-AN-A0XN-01 | Breast | breast invasive carcinoma | Female | >=65 | III/IV | Unknown | Unknown | SD | |
| CLN3 | SNV | Missense_Mutation | c.358N>T | p.His120Tyr | p.H120Y | Q13286 | protein_coding | tolerated(0.07) | probably_damaging(0.946) | TCGA-BH-A1F8-01 | Breast | breast invasive carcinoma | Female | >=65 | III/IV | Unknown | Unknown | PD | |
| CLN3 | SNV | Missense_Mutation | rs775999656 | c.239C>T | p.Thr80Met | p.T80M | Q13286 | protein_coding | tolerated(0.11) | possibly_damaging(0.596) | TCGA-D8-A27V-01 | Breast | breast invasive carcinoma | Female | <65 | I/II | Hormone Therapy | tamoxiphen | SD |
| CLN3 | insertion | Frame_Shift_Ins | novel | c.379dupC | p.Arg127ProfsTer33 | p.R127Pfs*33 | Q13286 | protein_coding | TCGA-BH-A0B8-01 | Breast | breast invasive carcinoma | Female | <65 | I/II | Hormone Therapy | arimidex | SD | ||
| CLN3 | SNV | Missense_Mutation | rs768614719 | c.1159G>A | p.Ala387Thr | p.A387T | Q13286 | protein_coding | deleterious(0) | probably_damaging(0.995) | TCGA-2W-A8YY-01 | Cervix | cervical & endocervical cancer | Female | <65 | I/II | Chemotherapy | cisplatin | CR |
| CLN3 | SNV | Missense_Mutation | c.14C>T | p.Ala5Val | p.A5V | Q13286 | protein_coding | deleterious_low_confidence(0.01) | benign(0.321) | TCGA-AZ-6601-01 | Colorectum | colon adenocarcinoma | Male | >=65 | I/II | Unknown | Unknown | PD | |
| CLN3 | SNV | Missense_Mutation | c.512C>T | p.Ser171Phe | p.S171F | Q13286 | protein_coding | deleterious(0) | probably_damaging(0.975) | TCGA-CK-4951-01 | Colorectum | colon adenocarcinoma | Female | >=65 | I/II | Unknown | Unknown | PD | |
| CLN3 | SNV | Missense_Mutation | rs369801432 | c.1229N>T | p.Ala410Val | p.A410V | Q13286 | protein_coding | deleterious(0.02) | possibly_damaging(0.623) | TCGA-CM-5861-01 | Colorectum | colon adenocarcinoma | Female | <65 | I/II | Unknown | Unknown | PD |
| Page: 1 2 3 4 5 |
Top |
Related drugs of malignant transformation related genes |
| Identification of chemicals and drugs interact with genes involved in malignant transfromation |
| (DGIdb 4.0) |
| Entrez ID | Symbol | Category | Interaction Types | Drug Claim Name | Drug Name | PMIDs |
| Page: 1 |

Copyright 2023-Present -The University of Texas Health Science Center at Houston |