
|
|||||
|
 | |
| |
| |
| |
| |
| |
|
Gene: CHD8 |
Gene summary for CHD8 |
| Gene information | Species | Human | Gene symbol | CHD8 | Gene ID | 57680 |
| Gene name | chromodomain helicase DNA binding protein 8 | |
| Gene Alias | AUTS18 | |
| Cytomap | 14q11.2 | |
| Gene Type | protein-coding | GO ID | GO:0000122 | UniProtAcc | Q9HCK8 |
Top |
Malignant transformation analysis |
| Identification of the aberrant gene expression in precancerous and cancerous lesions by comparing the gene expression of stem-like cells in diseased tissues with normal stem cells |
| Entrez ID | Symbol | Replicates | Species | Organ | Tissue | Adj P-value | Log2FC | Malignancy |
| 57680 | CHD8 | LZE2T | Human | Esophagus | ESCC | 4.99e-04 | 4.46e-01 | 0.082 |
| 57680 | CHD8 | LZE4T | Human | Esophagus | ESCC | 9.55e-18 | 4.46e-01 | 0.0811 |
| 57680 | CHD8 | LZE5T | Human | Esophagus | ESCC | 4.90e-04 | 3.75e-01 | 0.0514 |
| 57680 | CHD8 | LZE7T | Human | Esophagus | ESCC | 5.85e-10 | 3.91e-01 | 0.0667 |
| 57680 | CHD8 | LZE8T | Human | Esophagus | ESCC | 1.65e-03 | 8.52e-02 | 0.067 |
| 57680 | CHD8 | LZE20T | Human | Esophagus | ESCC | 1.97e-07 | 2.36e-01 | 0.0662 |
| 57680 | CHD8 | LZE24T | Human | Esophagus | ESCC | 2.96e-20 | 3.58e-01 | 0.0596 |
| 57680 | CHD8 | LZE21T | Human | Esophagus | ESCC | 7.63e-05 | 4.13e-01 | 0.0655 |
| 57680 | CHD8 | LZE6T | Human | Esophagus | ESCC | 3.43e-06 | 2.25e-01 | 0.0845 |
| 57680 | CHD8 | P1T-E | Human | Esophagus | ESCC | 5.02e-10 | 2.83e-01 | 0.0875 |
| 57680 | CHD8 | P2T-E | Human | Esophagus | ESCC | 9.46e-19 | 3.45e-01 | 0.1177 |
| 57680 | CHD8 | P4T-E | Human | Esophagus | ESCC | 6.27e-23 | 2.42e-01 | 0.1323 |
| 57680 | CHD8 | P5T-E | Human | Esophagus | ESCC | 3.12e-07 | 9.11e-02 | 0.1327 |
| 57680 | CHD8 | P8T-E | Human | Esophagus | ESCC | 1.87e-19 | 3.86e-01 | 0.0889 |
| 57680 | CHD8 | P9T-E | Human | Esophagus | ESCC | 9.66e-10 | 1.56e-01 | 0.1131 |
| 57680 | CHD8 | P10T-E | Human | Esophagus | ESCC | 3.97e-26 | 4.68e-01 | 0.116 |
| 57680 | CHD8 | P11T-E | Human | Esophagus | ESCC | 1.34e-10 | 3.38e-01 | 0.1426 |
| 57680 | CHD8 | P12T-E | Human | Esophagus | ESCC | 1.30e-30 | 6.39e-01 | 0.1122 |
| 57680 | CHD8 | P15T-E | Human | Esophagus | ESCC | 1.42e-33 | 7.75e-01 | 0.1149 |
| 57680 | CHD8 | P16T-E | Human | Esophagus | ESCC | 3.31e-22 | 2.35e-01 | 0.1153 |
| Page: 1 2 3 4 5 6 7 |
| Tissue | Expression Dynamics | Abbreviation |
| Esophagus | 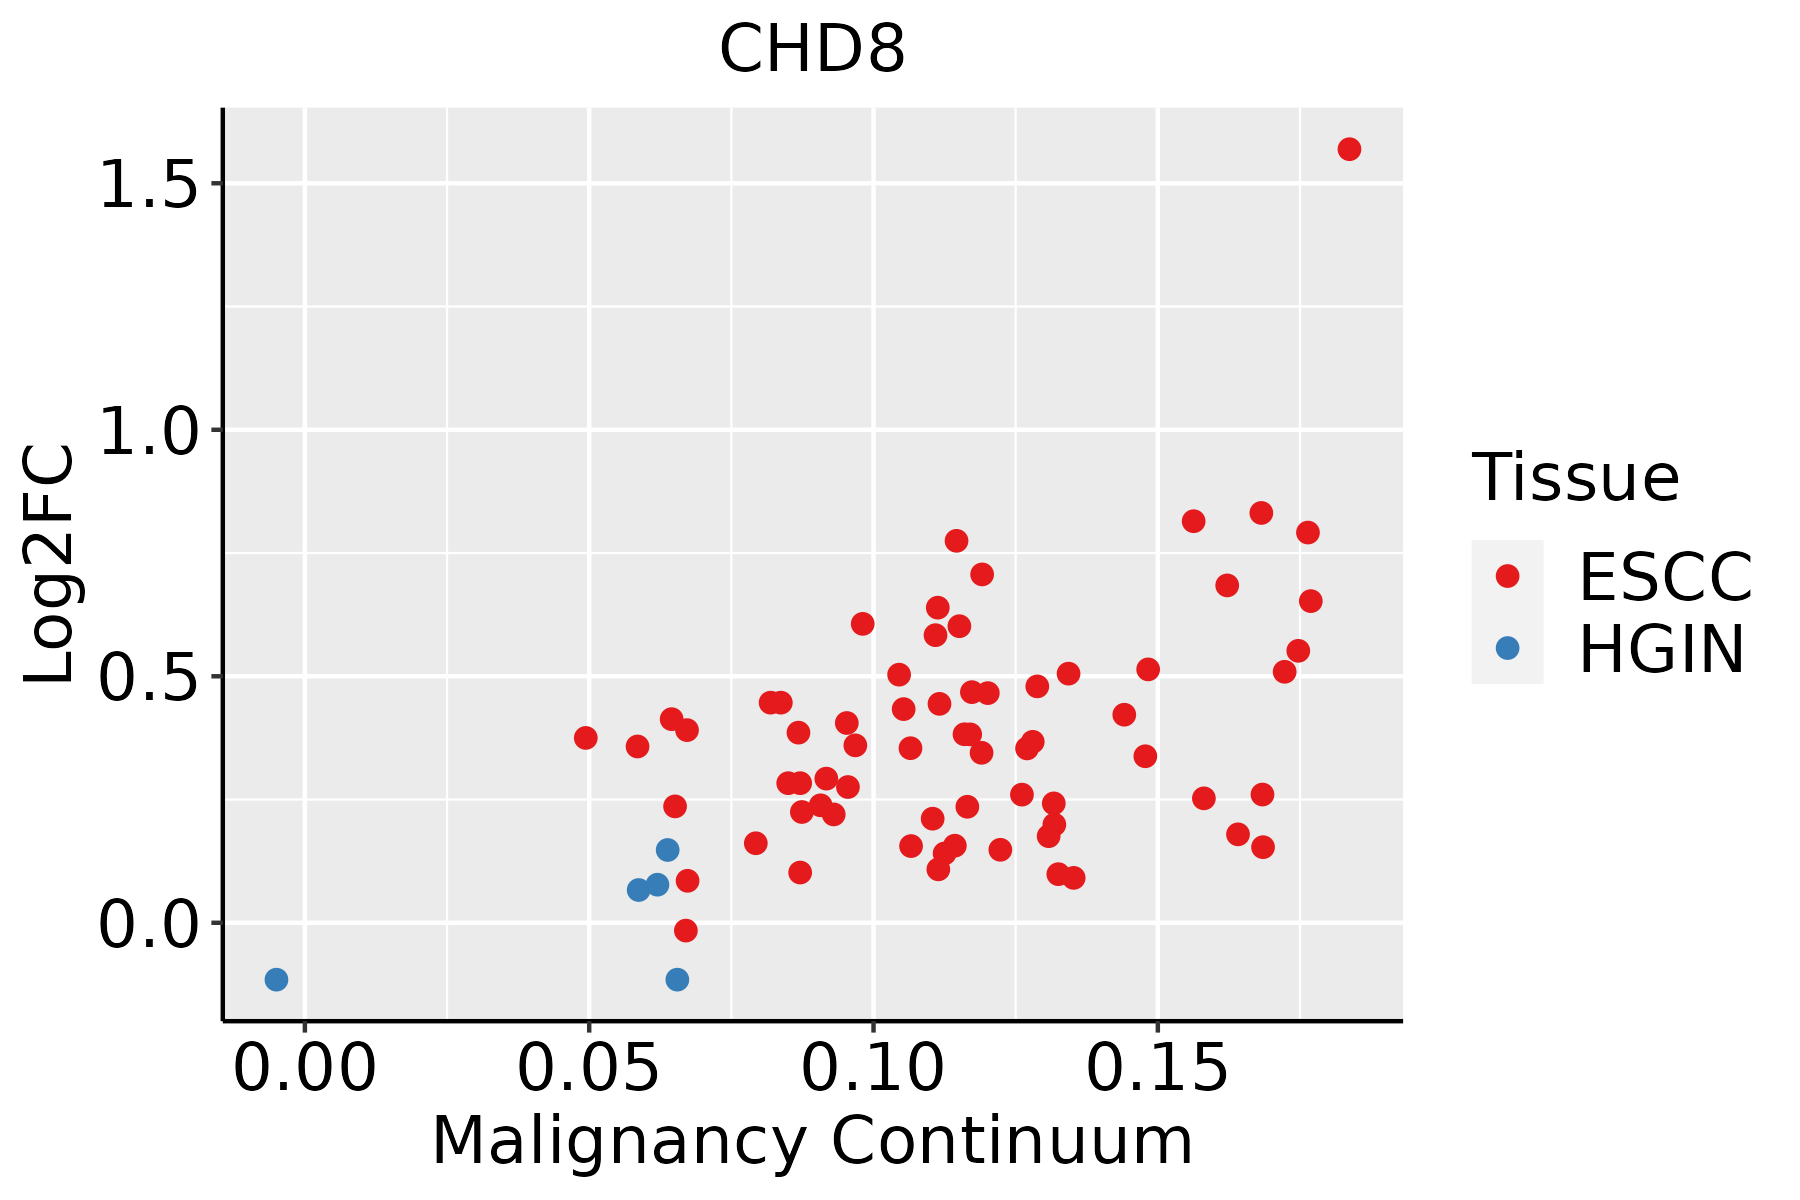 | ESCC: Esophageal squamous cell carcinoma |
| HGIN: High-grade intraepithelial neoplasias | ||
| LGIN: Low-grade intraepithelial neoplasias | ||
| Liver | 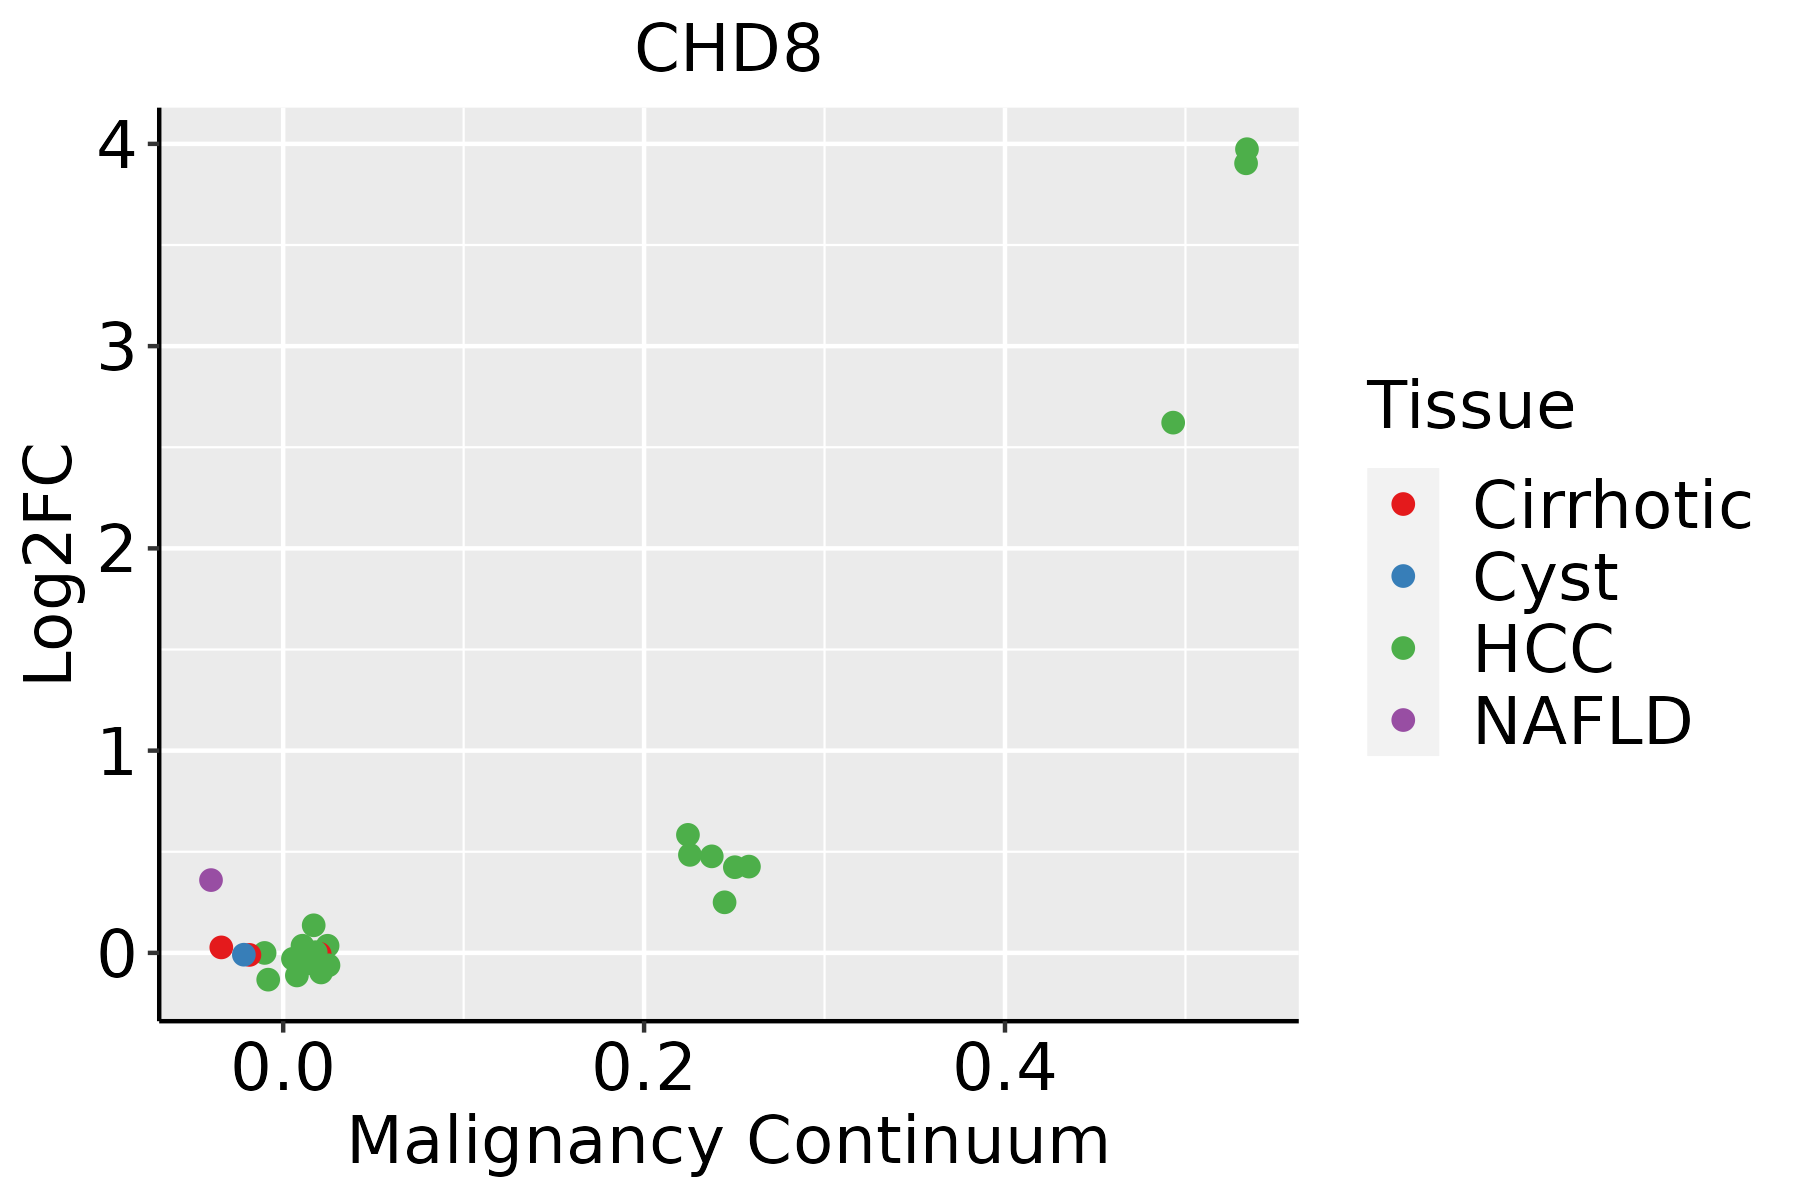 | HCC: Hepatocellular carcinoma |
| NAFLD: Non-alcoholic fatty liver disease | ||
| Oral Cavity | 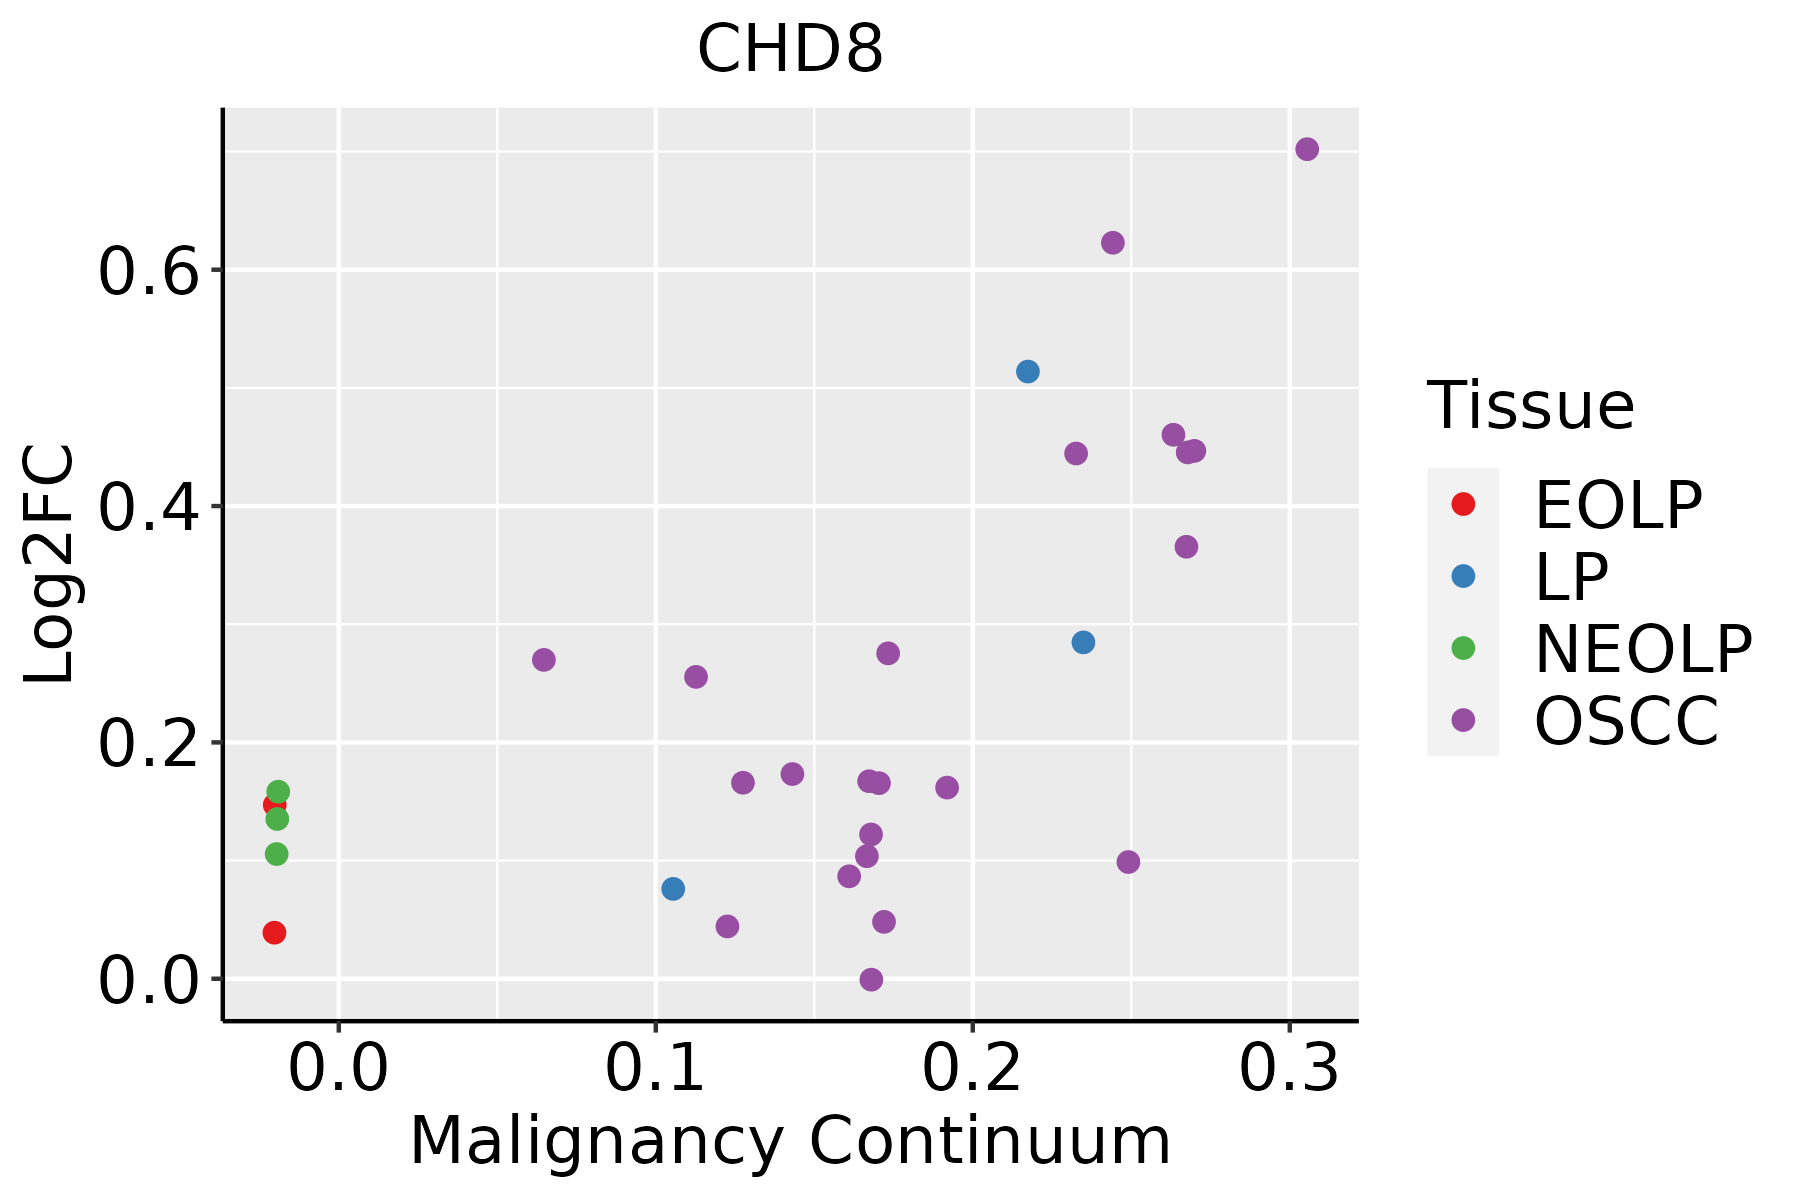 | EOLP: Erosive Oral lichen planus |
| LP: leukoplakia | ||
| NEOLP: Non-erosive oral lichen planus | ||
| OSCC: Oral squamous cell carcinoma | ||
| Prostate |  | BPH: Benign Prostatic Hyperplasia |
| Skin |  | AK: Actinic keratosis |
| cSCC: Cutaneous squamous cell carcinoma | ||
| SCCIS:squamous cell carcinoma in situ | ||
| Thyroid | 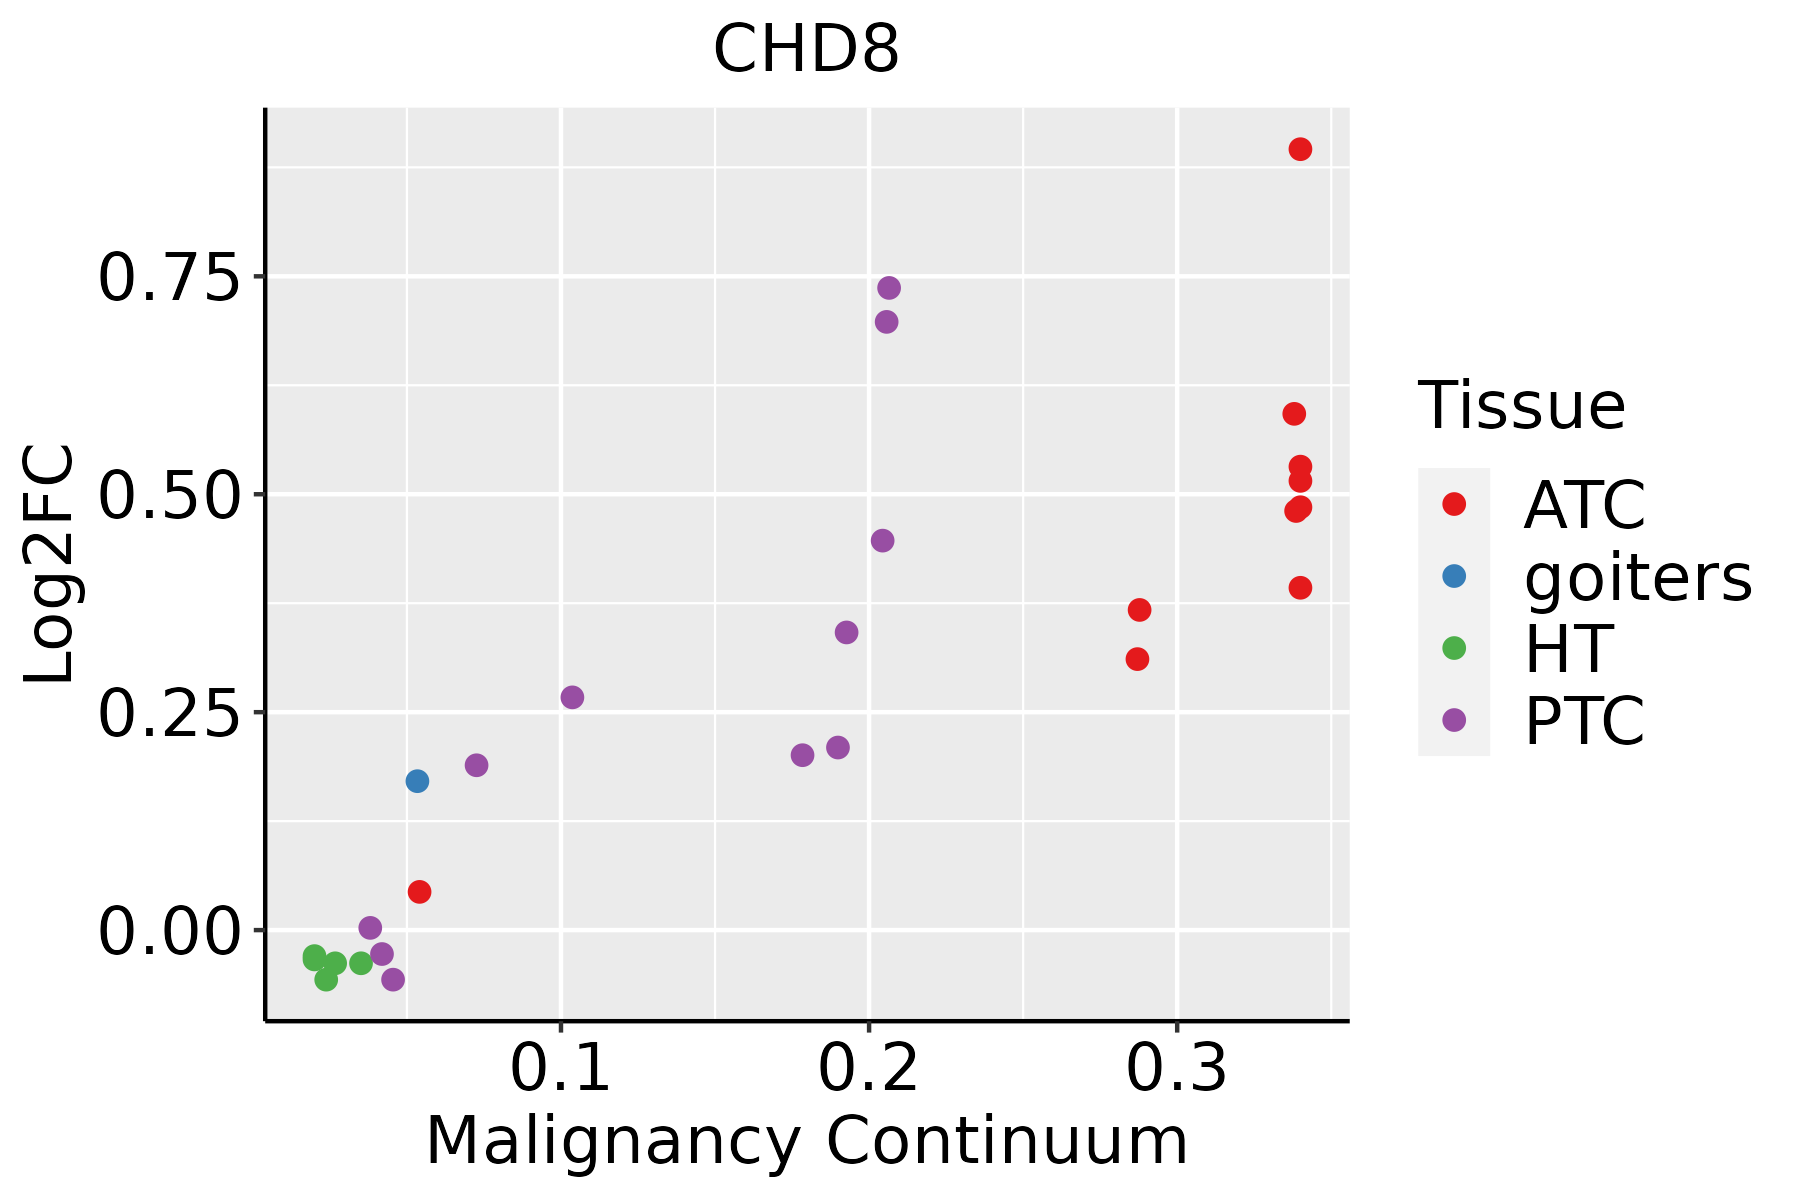 | ATC: Anaplastic thyroid cancer |
| HT: Hashimoto's thyroiditis | ||
| PTC: Papillary thyroid cancer |
| ∗log2FC in expression of this searched gene in stem-like cells from each diseased tissue sample relative to stem-like cells in normal samples in each tissue plotted against the malignancy continuum. Samples are colored based on if they are from different disease stage. |
Top |
Malignant transformation related pathway analysis |
| Find out the enriched GO biological processes and KEGG pathways involved in transition from healthy to precancer to cancer |
| Tissue | Disease Stage | Enriched GO biological Processes |
| Colorectum | AD |  |
| Colorectum | SER |  |
| Colorectum | MSS |  |
| Colorectum | MSI-H |  |
| Colorectum | FAP |  |
| ∗Top 15 enriched GO BP terms are showed in the bar plot of each disease state in each tissue. Each row represents a significant GO biological process which is colored according to the -log10(p.adjust). |
| Page: 1 2 3 4 5 6 7 8 9 |
| GO ID | Tissue | Disease Stage | Description | Gene Ratio | Bg Ratio | pvalue | p.adjust | Count |
| GO:004434611 | Skin | cSCC | fibroblast apoptotic process | 12/4864 | 22/18723 | 4.04e-03 | 2.15e-02 | 12 |
| GO:00063834 | Skin | cSCC | transcription by RNA polymerase III | 20/4864 | 46/18723 | 7.44e-03 | 3.50e-02 | 20 |
| GO:0016055110 | Thyroid | PTC | Wnt signaling pathway | 217/5968 | 444/18723 | 3.71e-14 | 2.30e-12 | 217 |
| GO:0198738110 | Thyroid | PTC | cell-cell signaling by wnt | 217/5968 | 446/18723 | 6.68e-14 | 3.73e-12 | 217 |
| GO:0030111110 | Thyroid | PTC | regulation of Wnt signaling pathway | 163/5968 | 328/18723 | 1.05e-11 | 4.29e-10 | 163 |
| GO:0001701111 | Thyroid | PTC | in utero embryonic development | 175/5968 | 367/18723 | 1.40e-10 | 4.73e-09 | 175 |
| GO:0060828110 | Thyroid | PTC | regulation of canonical Wnt signaling pathway | 123/5968 | 253/18723 | 1.83e-08 | 4.26e-07 | 123 |
| GO:000632520 | Thyroid | PTC | chromatin organization | 183/5968 | 409/18723 | 2.55e-08 | 5.70e-07 | 183 |
| GO:0060070110 | Thyroid | PTC | canonical Wnt signaling pathway | 141/5968 | 303/18723 | 5.71e-08 | 1.21e-06 | 141 |
| GO:00063385 | Thyroid | PTC | chromatin remodeling | 106/5968 | 255/18723 | 6.56e-04 | 4.13e-03 | 106 |
| GO:003017810 | Thyroid | PTC | negative regulation of Wnt signaling pathway | 74/5968 | 170/18723 | 8.99e-04 | 5.48e-03 | 74 |
| GO:00900907 | Thyroid | PTC | negative regulation of canonical Wnt signaling pathway | 59/5968 | 137/18723 | 3.76e-03 | 1.80e-02 | 59 |
| GO:00323928 | Thyroid | PTC | DNA geometric change | 41/5968 | 90/18723 | 4.47e-03 | 2.11e-02 | 41 |
| GO:00443465 | Thyroid | PTC | fibroblast apoptotic process | 13/5968 | 22/18723 | 7.65e-03 | 3.25e-02 | 13 |
| GO:00063835 | Thyroid | PTC | transcription by RNA polymerase III | 23/5968 | 46/18723 | 7.89e-03 | 3.33e-02 | 23 |
| GO:001605525 | Thyroid | ATC | Wnt signaling pathway | 234/6293 | 444/18723 | 4.64e-17 | 4.31e-15 | 234 |
| GO:019873825 | Thyroid | ATC | cell-cell signaling by wnt | 234/6293 | 446/18723 | 9.26e-17 | 8.25e-15 | 234 |
| GO:003011125 | Thyroid | ATC | regulation of Wnt signaling pathway | 177/6293 | 328/18723 | 1.83e-14 | 1.05e-12 | 177 |
| GO:000170126 | Thyroid | ATC | in utero embryonic development | 183/6293 | 367/18723 | 6.62e-11 | 2.11e-09 | 183 |
| GO:006082825 | Thyroid | ATC | regulation of canonical Wnt signaling pathway | 134/6293 | 253/18723 | 1.49e-10 | 4.56e-09 | 134 |
| Page: 1 2 3 4 5 6 7 |
| Pathway ID | Tissue | Disease Stage | Description | Gene Ratio | Bg Ratio | pvalue | p.adjust | qvalue | Count |
| hsa0431016 | Oral cavity | EOLP | Wnt signaling pathway | 37/1218 | 171/8465 | 6.23e-03 | 1.83e-02 | 1.08e-02 | 37 |
| hsa0431017 | Oral cavity | EOLP | Wnt signaling pathway | 37/1218 | 171/8465 | 6.23e-03 | 1.83e-02 | 1.08e-02 | 37 |
| hsa0431023 | Prostate | Tumor | Wnt signaling pathway | 50/1791 | 171/8465 | 7.32e-03 | 2.37e-02 | 1.47e-02 | 50 |
| hsa0431033 | Prostate | Tumor | Wnt signaling pathway | 50/1791 | 171/8465 | 7.32e-03 | 2.37e-02 | 1.47e-02 | 50 |
| Page: 1 |
Top |
Cell-cell communication analysis |
| Identification of potential cell-cell interactions between two cell types and their ligand-receptor pairs for different disease states |
| Ligand | Receptor | LRpair | Pathway | Tissue | Disease Stage |
| Page: 1 |
Top |
Single-cell gene regulatory network inference analysis |
| Find out the significant the regulons (TFs) and the target genes of each regulon across cell types for different disease states |
| TF | Cell Type | Tissue | Disease Stage | Target Gene | RSS | Regulon Activity |
| ∗The dot plots of a searched regulon are shown for all cell subpopulations in each disease state of each tissue based on the regulon specific score inferred using pySCENIC and by calculating the average expression. |
| Page: 1 |
Top |
Somatic mutation of malignant transformation related genes |
| Annotation of somatic variants for genes involved in malignant transformation |
| Hugo Symbol | Variant Class | Variant Classification | dbSNP RS | HGVSc | HGVSp | HGVSp Short | SWISSPROT | BIOTYPE | SIFT | PolyPhen | Tumor Sample Barcode | Tissue | Histology | Sex | Age | Stage | Therapy Types | Drugs | Outcome |
| CHD8 | SNV | Missense_Mutation | novel | c.3148N>C | p.Glu1050Gln | p.E1050Q | Q9HCK8 | protein_coding | deleterious(0) | probably_damaging(1) | TCGA-A8-A076-01 | Breast | breast invasive carcinoma | Female | >=65 | I/II | Hormone Therapy | anastrozole | SD |
| CHD8 | SNV | Missense_Mutation | c.5564G>A | p.Arg1855His | p.R1855H | Q9HCK8 | protein_coding | deleterious(0.02) | probably_damaging(0.962) | TCGA-A8-A09I-01 | Breast | breast invasive carcinoma | Female | >=65 | I/II | Hormone Therapy | anastrozole | SD | |
| CHD8 | SNV | Missense_Mutation | c.4483C>A | p.Arg1495Ser | p.R1495S | Q9HCK8 | protein_coding | deleterious(0) | benign(0.298) | TCGA-AC-A23G-01 | Breast | breast invasive carcinoma | Female | >=65 | I/II | Chemotherapy | cytoxan | CR | |
| CHD8 | SNV | Missense_Mutation | c.3095N>C | p.Arg1032Thr | p.R1032T | Q9HCK8 | protein_coding | deleterious(0) | probably_damaging(1) | TCGA-AC-A23H-01 | Breast | breast invasive carcinoma | Female | >=65 | I/II | Unknown | Unknown | PD | |
| CHD8 | SNV | Missense_Mutation | rs759526072 | c.4342N>T | p.Arg1448Trp | p.R1448W | Q9HCK8 | protein_coding | deleterious(0) | probably_damaging(0.952) | TCGA-AN-A046-01 | Breast | breast invasive carcinoma | Female | >=65 | I/II | Unknown | Unknown | SD |
| CHD8 | SNV | Missense_Mutation | novel | c.2019N>T | p.Lys673Asn | p.K673N | Q9HCK8 | protein_coding | deleterious(0) | probably_damaging(0.985) | TCGA-AN-A046-01 | Breast | breast invasive carcinoma | Female | >=65 | I/II | Unknown | Unknown | SD |
| CHD8 | SNV | Missense_Mutation | novel | c.4539N>G | p.Asn1513Lys | p.N1513K | Q9HCK8 | protein_coding | deleterious(0) | benign(0.306) | TCGA-AN-A0AK-01 | Breast | breast invasive carcinoma | Female | >=65 | I/II | Unknown | Unknown | SD |
| CHD8 | SNV | Missense_Mutation | c.281N>T | p.Asp94Val | p.D94V | Q9HCK8 | protein_coding | tolerated_low_confidence(0.4) | benign(0.038) | TCGA-AN-A0FJ-01 | Breast | breast invasive carcinoma | Female | <65 | III/IV | Unknown | Unknown | SD | |
| CHD8 | SNV | Missense_Mutation | c.5608G>T | p.Asp1870Tyr | p.D1870Y | Q9HCK8 | protein_coding | deleterious(0) | probably_damaging(0.914) | TCGA-B6-A0IA-01 | Breast | breast invasive carcinoma | Female | <65 | I/II | Unknown | Unknown | SD | |
| CHD8 | SNV | Missense_Mutation | c.6401A>C | p.Asp2134Ala | p.D2134A | Q9HCK8 | protein_coding | deleterious(0.02) | benign(0.258) | TCGA-B6-A0RI-01 | Breast | breast invasive carcinoma | Female | <65 | III/IV | Unknown | Unknown | PD |
| Page: 1 2 3 4 5 6 7 8 9 10 11 12 13 14 15 16 17 18 19 20 21 22 23 24 25 26 27 28 29 |
Top |
Related drugs of malignant transformation related genes |
| Identification of chemicals and drugs interact with genes involved in malignant transfromation |
| (DGIdb 4.0) |
| Entrez ID | Symbol | Category | Interaction Types | Drug Claim Name | Drug Name | PMIDs |
| Page: 1 |

Copyright 2023-Present -The University of Texas Health Science Center at Houston |