
|
|||||
|
 | |
| |
| |
| |
| |
| |
|
Gene: CGNL1 |
Gene summary for CGNL1 |
| Gene information | Species | Human | Gene symbol | CGNL1 | Gene ID | 84952 |
| Gene name | cingulin like 1 | |
| Gene Alias | JACOP | |
| Cytomap | 15q21.3 | |
| Gene Type | protein-coding | GO ID | GO:0006996 | UniProtAcc | Q0VF96 |
Top |
Malignant transformation analysis |
| Identification of the aberrant gene expression in precancerous and cancerous lesions by comparing the gene expression of stem-like cells in diseased tissues with normal stem cells |
| Entrez ID | Symbol | Replicates | Species | Organ | Tissue | Adj P-value | Log2FC | Malignancy |
| 84952 | CGNL1 | NAFLD1 | Human | Liver | NAFLD | 3.17e-09 | 8.77e-01 | -0.04 |
| 84952 | CGNL1 | S43 | Human | Liver | Cirrhotic | 3.82e-04 | -1.47e-01 | -0.0187 |
| 84952 | CGNL1 | HCC1_Meng | Human | Liver | HCC | 2.14e-37 | -1.29e-01 | 0.0246 |
| 84952 | CGNL1 | HCC2_Meng | Human | Liver | HCC | 1.42e-05 | -1.74e-01 | 0.0107 |
| 84952 | CGNL1 | HCC1 | Human | Liver | HCC | 4.88e-04 | 3.65e+00 | 0.5336 |
| 84952 | CGNL1 | HCC2 | Human | Liver | HCC | 3.37e-26 | 4.98e+00 | 0.5341 |
| 84952 | CGNL1 | HCC5 | Human | Liver | HCC | 2.34e-03 | 2.82e+00 | 0.4932 |
| 84952 | CGNL1 | Pt13.a | Human | Liver | HCC | 3.65e-02 | -1.71e-01 | 0.021 |
| 84952 | CGNL1 | S027 | Human | Liver | HCC | 2.94e-02 | 3.92e-01 | 0.2446 |
| 84952 | CGNL1 | S028 | Human | Liver | HCC | 9.12e-05 | 3.65e-01 | 0.2503 |
| 84952 | CGNL1 | S029 | Human | Liver | HCC | 4.07e-02 | 2.56e-01 | 0.2581 |
| 84952 | CGNL1 | RNA-P25T1-P25T1-1 | Human | Lung | AIS | 1.89e-09 | 5.26e-01 | -0.2116 |
| 84952 | CGNL1 | RNA-P25T1-P25T1-2 | Human | Lung | AIS | 3.71e-02 | 4.84e-01 | -0.1941 |
| 84952 | CGNL1 | RNA-P25T1-P25T1-3 | Human | Lung | AIS | 3.89e-06 | 6.01e-01 | -0.2107 |
| 84952 | CGNL1 | RNA-P25T1-P25T1-4 | Human | Lung | AIS | 4.19e-13 | 6.77e-01 | -0.2119 |
| 84952 | CGNL1 | RNA-P6T2-P6T2-3 | Human | Lung | IAC | 7.99e-05 | 1.06e-01 | -0.013 |
| 84952 | CGNL1 | RNA-P7T1-P7T1-1 | Human | Lung | AIS | 2.07e-05 | 6.38e-01 | -0.0961 |
| 84952 | CGNL1 | RNA-P7T1-P7T1-2 | Human | Lung | AIS | 6.71e-06 | 6.83e-01 | -0.0876 |
| 84952 | CGNL1 | RNA-P7T1-P7T1-3 | Human | Lung | AIS | 1.15e-07 | 7.14e-01 | -0.0822 |
| 84952 | CGNL1 | RNA-P7T1-P7T1-4 | Human | Lung | AIS | 1.56e-08 | 7.52e-01 | -0.0809 |
| Page: 1 2 |
| Tissue | Expression Dynamics | Abbreviation |
| Liver |  | HCC: Hepatocellular carcinoma |
| NAFLD: Non-alcoholic fatty liver disease | ||
| Lung | 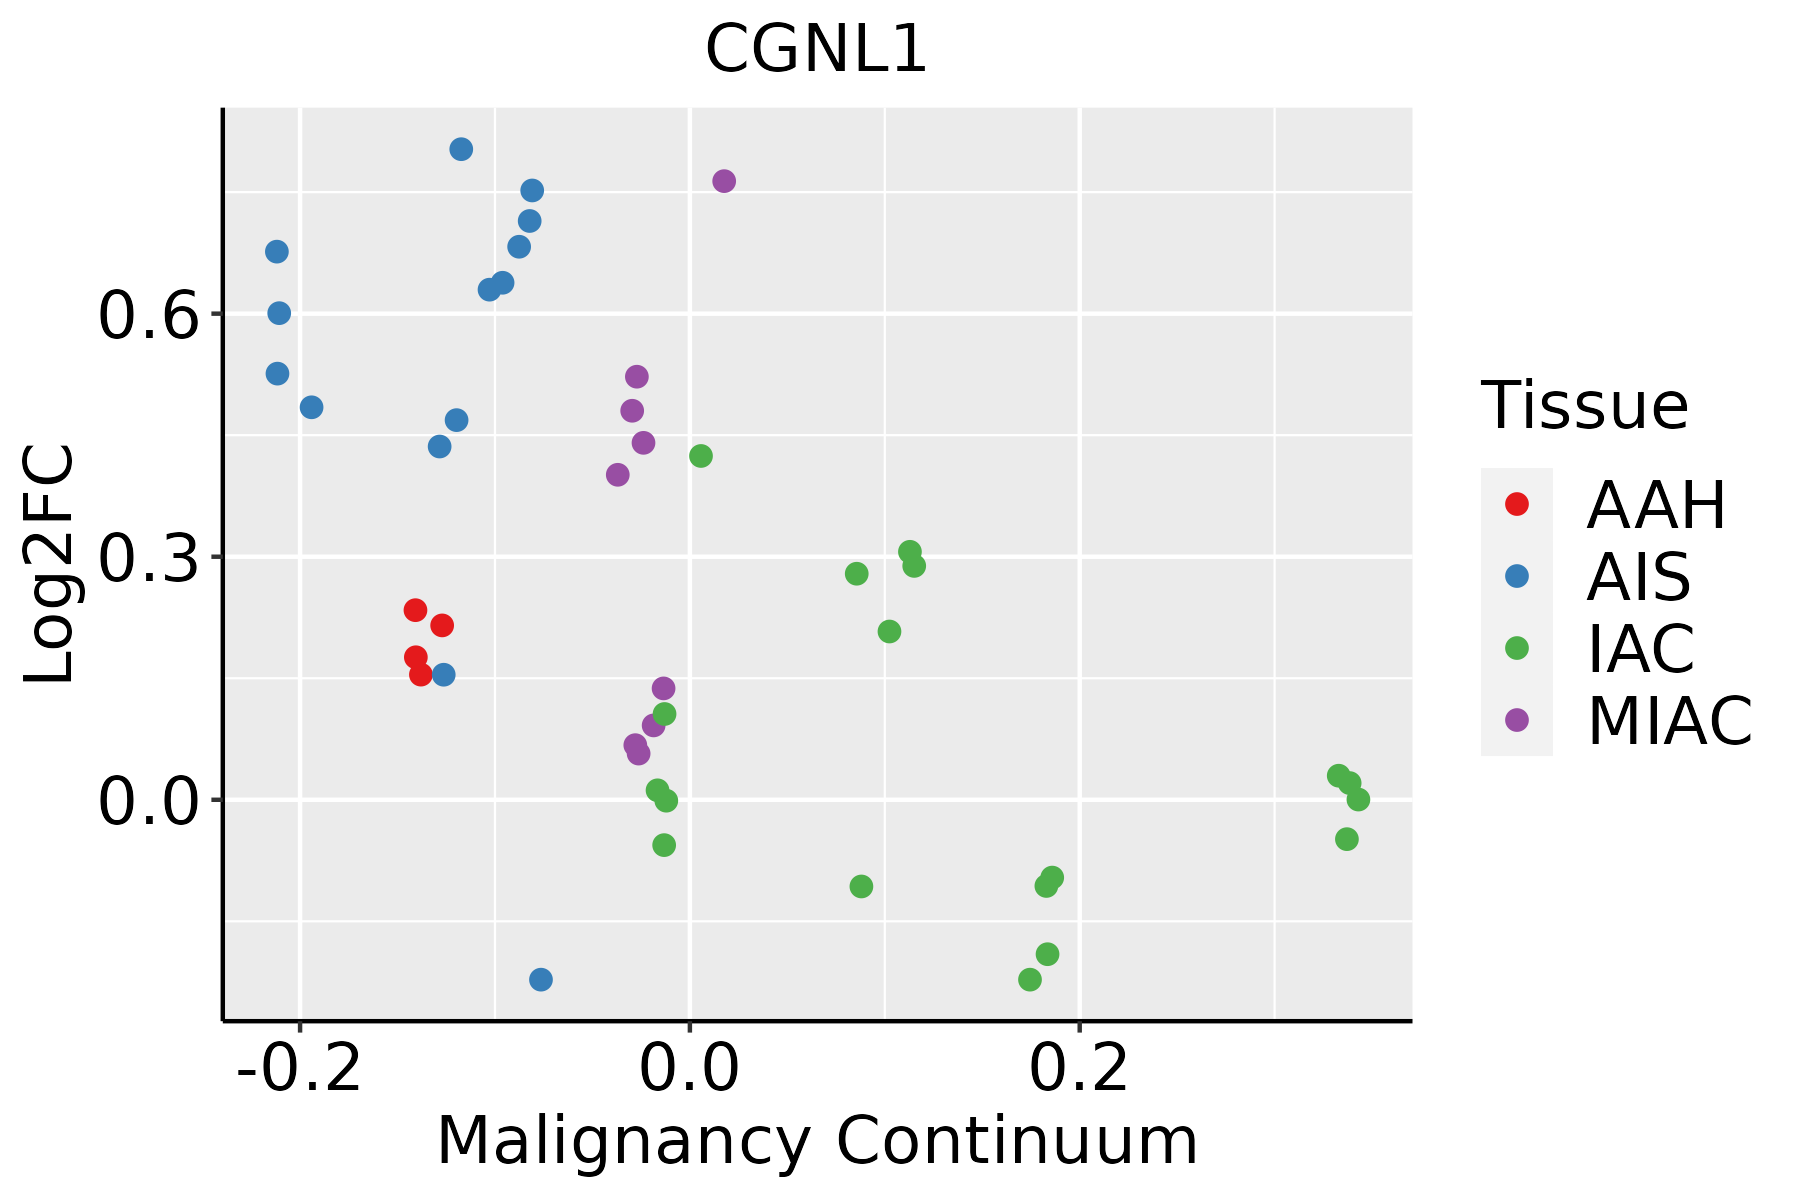 | AAH: Atypical adenomatous hyperplasia |
| AIS: Adenocarcinoma in situ | ||
| IAC: Invasive lung adenocarcinoma | ||
| MIA: Minimally invasive adenocarcinoma | ||
| Thyroid | 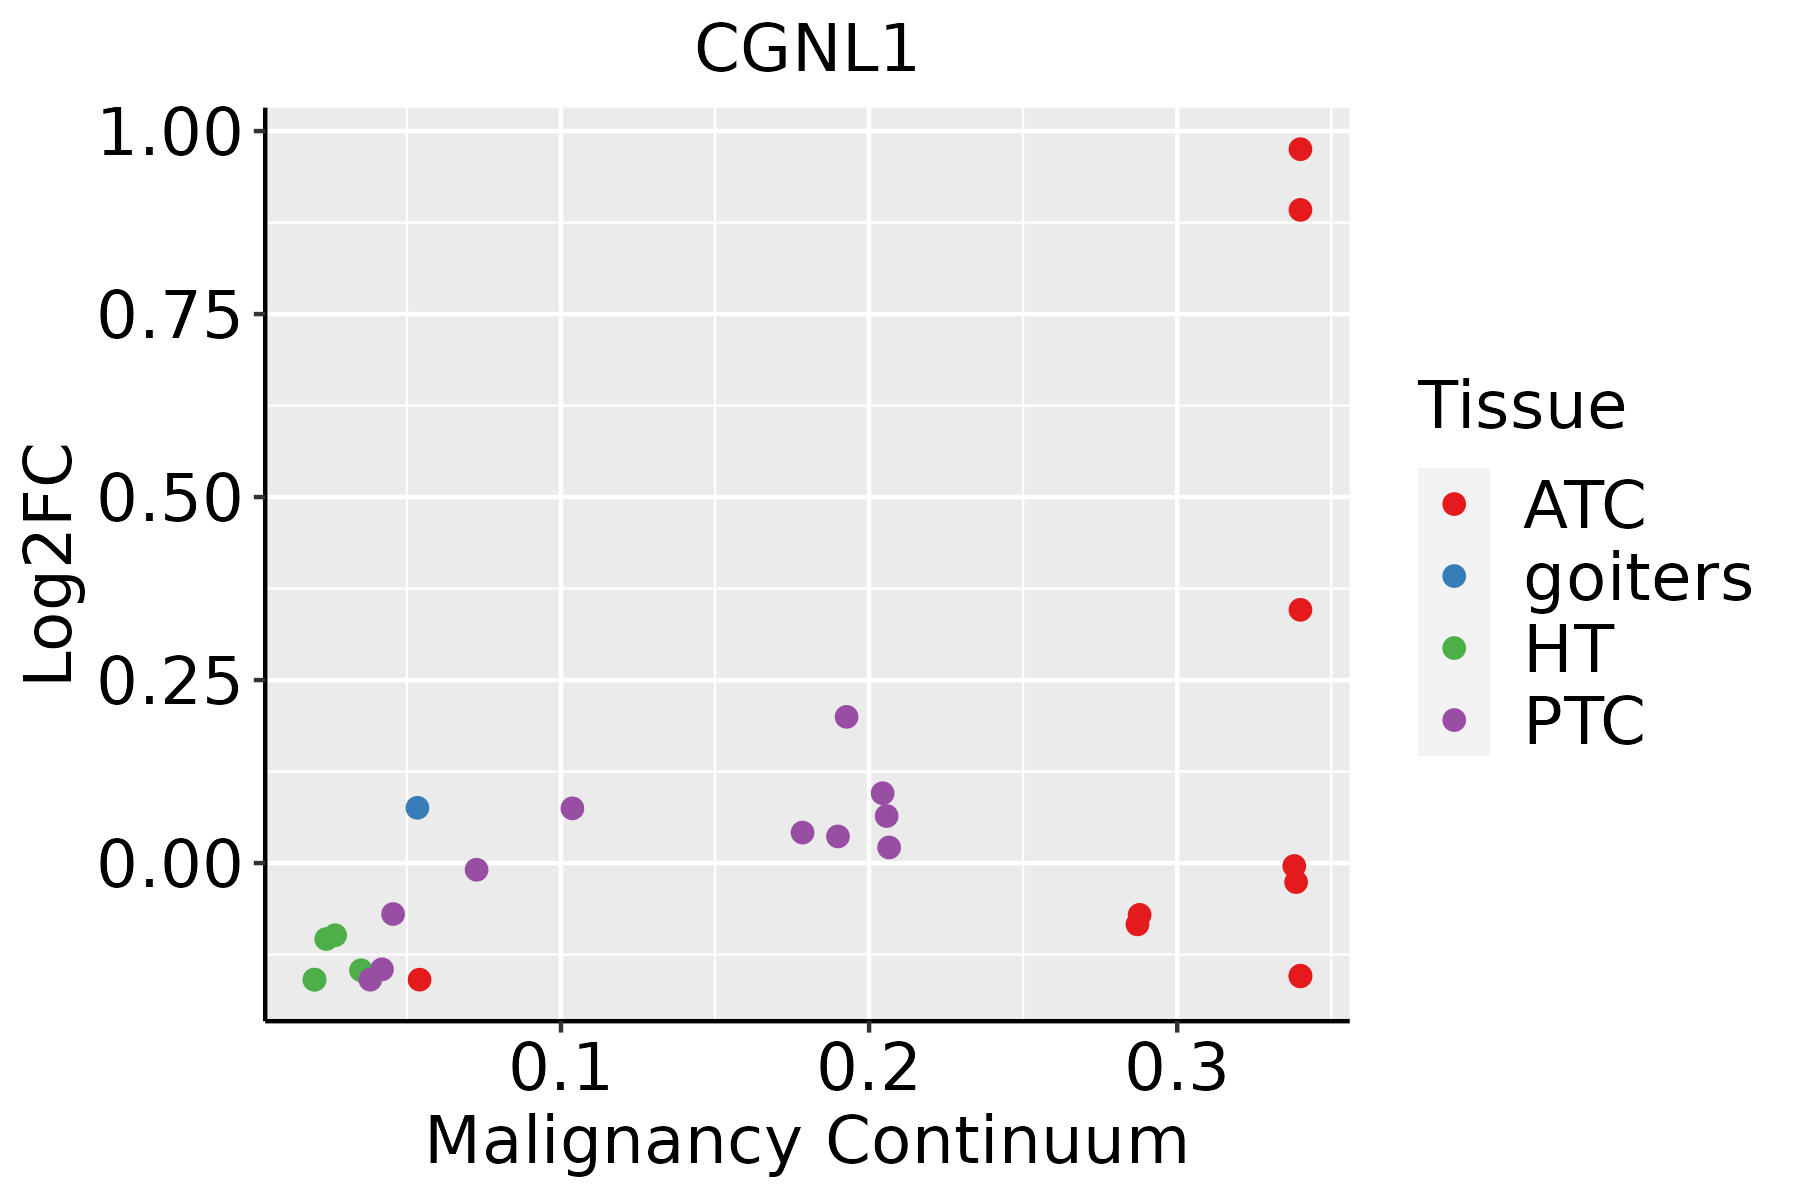 | ATC: Anaplastic thyroid cancer |
| HT: Hashimoto's thyroiditis | ||
| PTC: Papillary thyroid cancer |
| ∗log2FC in expression of this searched gene in stem-like cells from each diseased tissue sample relative to stem-like cells in normal samples in each tissue plotted against the malignancy continuum. Samples are colored based on if they are from different disease stage. |
Top |
Malignant transformation related pathway analysis |
| Find out the enriched GO biological processes and KEGG pathways involved in transition from healthy to precancer to cancer |
| Tissue | Disease Stage | Enriched GO biological Processes |
| Colorectum | AD |  |
| Colorectum | SER |  |
| Colorectum | MSS |  |
| Colorectum | MSI-H |  |
| Colorectum | FAP |  |
| ∗Top 15 enriched GO BP terms are showed in the bar plot of each disease state in each tissue. Each row represents a significant GO biological process which is colored according to the -log10(p.adjust). |
| Page: 1 2 3 4 5 6 7 8 9 |
| GO ID | Tissue | Disease Stage | Description | Gene Ratio | Bg Ratio | pvalue | p.adjust | Count |
| GO:0051492111 | Thyroid | PTC | regulation of stress fiber assembly | 50/5968 | 91/18723 | 4.33e-06 | 5.35e-05 | 50 |
| GO:003003827 | Thyroid | PTC | contractile actin filament bundle assembly | 56/5968 | 106/18723 | 6.01e-06 | 7.21e-05 | 56 |
| GO:004314927 | Thyroid | PTC | stress fiber assembly | 56/5968 | 106/18723 | 6.01e-06 | 7.21e-05 | 56 |
| GO:005105617 | Thyroid | PTC | regulation of small GTPase mediated signal transduction | 132/5968 | 302/18723 | 9.26e-06 | 1.04e-04 | 132 |
| GO:0110020111 | Thyroid | PTC | regulation of actomyosin structure organization | 53/5968 | 100/18723 | 9.35e-06 | 1.05e-04 | 53 |
| GO:0031032110 | Thyroid | PTC | actomyosin structure organization | 91/5968 | 196/18723 | 1.35e-05 | 1.45e-04 | 91 |
| GO:1902904111 | Thyroid | PTC | negative regulation of supramolecular fiber organization | 78/5968 | 167/18723 | 4.16e-05 | 3.80e-04 | 78 |
| GO:00510586 | Thyroid | PTC | negative regulation of small GTPase mediated signal transduction | 31/5968 | 56/18723 | 2.32e-04 | 1.68e-03 | 31 |
| GO:005149419 | Thyroid | PTC | negative regulation of cytoskeleton organization | 73/5968 | 163/18723 | 3.59e-04 | 2.44e-03 | 73 |
| GO:0150105110 | Thyroid | PTC | protein localization to cell-cell junction | 14/5968 | 21/18723 | 1.11e-03 | 6.51e-03 | 14 |
| GO:19024145 | Thyroid | PTC | protein localization to cell junction | 43/5968 | 94/18723 | 3.32e-03 | 1.62e-02 | 43 |
| GO:00514978 | Thyroid | PTC | negative regulation of stress fiber assembly | 17/5968 | 32/18723 | 1.02e-02 | 4.11e-02 | 17 |
| GO:1902903210 | Thyroid | ATC | regulation of supramolecular fiber organization | 210/6293 | 383/18723 | 6.20e-18 | 7.54e-16 | 210 |
| GO:0032970210 | Thyroid | ATC | regulation of actin filament-based process | 208/6293 | 397/18723 | 5.82e-15 | 3.80e-13 | 208 |
| GO:0007015210 | Thyroid | ATC | actin filament organization | 227/6293 | 442/18723 | 5.96e-15 | 3.85e-13 | 227 |
| GO:0032956210 | Thyroid | ATC | regulation of actin cytoskeleton organization | 190/6293 | 358/18723 | 1.73e-14 | 1.01e-12 | 190 |
| GO:0110053210 | Thyroid | ATC | regulation of actin filament organization | 150/6293 | 278/18723 | 1.82e-12 | 7.58e-11 | 150 |
| GO:001063926 | Thyroid | ATC | negative regulation of organelle organization | 179/6293 | 348/18723 | 3.74e-12 | 1.50e-10 | 179 |
| GO:0051017210 | Thyroid | ATC | actin filament bundle assembly | 85/6293 | 157/18723 | 8.99e-08 | 1.54e-06 | 85 |
| GO:0061572210 | Thyroid | ATC | actin filament bundle organization | 86/6293 | 161/18723 | 1.68e-07 | 2.69e-06 | 86 |
| Page: 1 2 3 4 5 6 7 |
| Pathway ID | Tissue | Disease Stage | Description | Gene Ratio | Bg Ratio | pvalue | p.adjust | qvalue | Count |
| hsa0453014 | Liver | NAFLD | Tight junction | 33/1043 | 169/8465 | 4.52e-03 | 4.12e-02 | 3.32e-02 | 33 |
| hsa0453015 | Liver | NAFLD | Tight junction | 33/1043 | 169/8465 | 4.52e-03 | 4.12e-02 | 3.32e-02 | 33 |
| hsa0453022 | Liver | Cirrhotic | Tight junction | 82/2530 | 169/8465 | 2.14e-07 | 2.85e-06 | 1.76e-06 | 82 |
| hsa0453032 | Liver | Cirrhotic | Tight junction | 82/2530 | 169/8465 | 2.14e-07 | 2.85e-06 | 1.76e-06 | 82 |
| hsa0453042 | Liver | HCC | Tight junction | 110/4020 | 169/8465 | 2.45e-06 | 2.28e-05 | 1.27e-05 | 110 |
| hsa0453052 | Liver | HCC | Tight junction | 110/4020 | 169/8465 | 2.45e-06 | 2.28e-05 | 1.27e-05 | 110 |
| hsa0453023 | Lung | AIS | Tight junction | 46/961 | 169/8465 | 7.79e-09 | 4.33e-07 | 2.77e-07 | 46 |
| hsa0453033 | Lung | AIS | Tight junction | 46/961 | 169/8465 | 7.79e-09 | 4.33e-07 | 2.77e-07 | 46 |
| Page: 1 |
Top |
Cell-cell communication analysis |
| Identification of potential cell-cell interactions between two cell types and their ligand-receptor pairs for different disease states |
| Ligand | Receptor | LRpair | Pathway | Tissue | Disease Stage |
| Page: 1 |
Top |
Single-cell gene regulatory network inference analysis |
| Find out the significant the regulons (TFs) and the target genes of each regulon across cell types for different disease states |
| TF | Cell Type | Tissue | Disease Stage | Target Gene | RSS | Regulon Activity |
| ∗The dot plots of a searched regulon are shown for all cell subpopulations in each disease state of each tissue based on the regulon specific score inferred using pySCENIC and by calculating the average expression. |
| Page: 1 |
Top |
Somatic mutation of malignant transformation related genes |
| Annotation of somatic variants for genes involved in malignant transformation |
| Hugo Symbol | Variant Class | Variant Classification | dbSNP RS | HGVSc | HGVSp | HGVSp Short | SWISSPROT | BIOTYPE | SIFT | PolyPhen | Tumor Sample Barcode | Tissue | Histology | Sex | Age | Stage | Therapy Types | Drugs | Outcome |
| CGNL1 | SNV | Missense_Mutation | c.746N>T | p.Ala249Val | p.A249V | Q0VF96 | protein_coding | tolerated(0.19) | benign(0.015) | TCGA-A2-A0CP-01 | Breast | breast invasive carcinoma | Female | <65 | I/II | Chemotherapy | cytoxan | SD | |
| CGNL1 | SNV | Missense_Mutation | novel | c.2311N>T | p.Val771Phe | p.V771F | Q0VF96 | protein_coding | deleterious(0) | possibly_damaging(0.897) | TCGA-A2-A0CS-01 | Breast | breast invasive carcinoma | Female | >=65 | III/IV | Hormone Therapy | anastrozole | SD |
| CGNL1 | SNV | Missense_Mutation | c.1538N>T | p.Thr513Ile | p.T513I | Q0VF96 | protein_coding | tolerated(0.2) | benign(0.003) | TCGA-A8-A06X-01 | Breast | breast invasive carcinoma | Female | >=65 | I/II | Unknown | Unknown | SD | |
| CGNL1 | SNV | Missense_Mutation | novel | c.739G>C | p.Glu247Gln | p.E247Q | Q0VF96 | protein_coding | tolerated(0.33) | benign(0.003) | TCGA-A8-A08F-01 | Breast | breast invasive carcinoma | Female | <65 | III/IV | Chemotherapy | 5-fluorouracil | CR |
| CGNL1 | SNV | Missense_Mutation | c.511G>C | p.Glu171Gln | p.E171Q | Q0VF96 | protein_coding | tolerated(0.48) | benign(0.007) | TCGA-AC-A23H-01 | Breast | breast invasive carcinoma | Female | >=65 | I/II | Unknown | Unknown | PD | |
| CGNL1 | SNV | Missense_Mutation | novel | c.1130G>T | p.Arg377Ile | p.R377I | Q0VF96 | protein_coding | deleterious(0) | probably_damaging(0.997) | TCGA-AN-A046-01 | Breast | breast invasive carcinoma | Female | >=65 | I/II | Unknown | Unknown | SD |
| CGNL1 | SNV | Missense_Mutation | c.72N>A | p.Asp24Glu | p.D24E | Q0VF96 | protein_coding | tolerated_low_confidence(0.32) | benign(0) | TCGA-D8-A1XK-01 | Breast | breast invasive carcinoma | Female | <65 | I/II | Chemotherapy | doxorubicine+cyclophosphamide | SD | |
| CGNL1 | insertion | Nonsense_Mutation | novel | c.1208_1209insGCTCGGTCCCGGAGGTCCTCCTCGTCATCCACAACTC | p.Tyr403Ter | p.Y403* | Q0VF96 | protein_coding | TCGA-A7-A0CJ-01 | Breast | breast invasive carcinoma | Female | <65 | I/II | Chemotherapy | cytoxan | SD | ||
| CGNL1 | deletion | Frame_Shift_Del | novel | c.738delA | p.Glu247ArgfsTer11 | p.E247Rfs*11 | Q0VF96 | protein_coding | TCGA-A8-A08F-01 | Breast | breast invasive carcinoma | Female | <65 | III/IV | Chemotherapy | 5-fluorouracil | CR | ||
| CGNL1 | insertion | Nonsense_Mutation | novel | c.694_695insAAATAATATTTTC | p.Ser232Ter | p.S232* | Q0VF96 | protein_coding | TCGA-AN-A0FN-01 | Breast | breast invasive carcinoma | Female | <65 | I/II | Unknown | Unknown | SD |
| Page: 1 2 3 4 5 6 7 8 9 10 11 12 13 14 |
Top |
Related drugs of malignant transformation related genes |
| Identification of chemicals and drugs interact with genes involved in malignant transfromation |
| (DGIdb 4.0) |
| Entrez ID | Symbol | Category | Interaction Types | Drug Claim Name | Drug Name | PMIDs |
| Page: 1 |

Copyright 2023-Present -The University of Texas Health Science Center at Houston |