
|
|||||
|
 | |
| |
| |
| |
| |
| |
|
Gene: CGN |
Gene summary for CGN |
| Gene information | Species | Human | Gene symbol | CGN | Gene ID | 57530 |
| Gene name | cingulin | |
| Gene Alias | CGN | |
| Cytomap | 1q21.3 | |
| Gene Type | protein-coding | GO ID | GO:0008150 | UniProtAcc | Q9P2M7 |
Top |
Malignant transformation analysis |
| Identification of the aberrant gene expression in precancerous and cancerous lesions by comparing the gene expression of stem-like cells in diseased tissues with normal stem cells |
| Entrez ID | Symbol | Replicates | Species | Organ | Tissue | Adj P-value | Log2FC | Malignancy |
| 57530 | CGN | HTA11_2487_2000001011 | Human | Colorectum | SER | 1.56e-06 | 6.72e-01 | -0.1808 |
| 57530 | CGN | HTA11_1938_2000001011 | Human | Colorectum | AD | 1.39e-02 | 3.36e-01 | -0.0811 |
| 57530 | CGN | HTA11_347_2000001011 | Human | Colorectum | AD | 7.93e-20 | 7.34e-01 | -0.1954 |
| 57530 | CGN | HTA11_411_2000001011 | Human | Colorectum | SER | 1.20e-03 | 9.71e-01 | -0.2602 |
| 57530 | CGN | HTA11_3361_2000001011 | Human | Colorectum | AD | 6.17e-04 | 4.66e-01 | -0.1207 |
| 57530 | CGN | HTA11_83_2000001011 | Human | Colorectum | SER | 3.37e-03 | 5.89e-01 | -0.1526 |
| 57530 | CGN | HTA11_696_2000001011 | Human | Colorectum | AD | 1.00e-23 | 6.83e-01 | -0.1464 |
| 57530 | CGN | HTA11_866_2000001011 | Human | Colorectum | AD | 1.11e-10 | 4.04e-01 | -0.1001 |
| 57530 | CGN | HTA11_1391_2000001011 | Human | Colorectum | AD | 1.72e-06 | 5.68e-01 | -0.059 |
| 57530 | CGN | HTA11_5212_2000001011 | Human | Colorectum | AD | 2.53e-03 | 4.56e-01 | -0.2061 |
| 57530 | CGN | HTA11_7696_3000711011 | Human | Colorectum | AD | 1.16e-05 | 2.38e-01 | 0.0674 |
| 57530 | CGN | HTA11_99999971662_82457 | Human | Colorectum | MSS | 3.94e-13 | 4.64e-01 | 0.3859 |
| 57530 | CGN | HTA11_99999974143_84620 | Human | Colorectum | MSS | 1.80e-03 | 2.18e-01 | 0.3005 |
| 57530 | CGN | A002-C-205 | Human | Colorectum | FAP | 7.59e-03 | -6.12e-02 | -0.1236 |
| 57530 | CGN | A015-C-002 | Human | Colorectum | FAP | 5.14e-03 | -2.25e-01 | -0.0763 |
| 57530 | CGN | LZE24T | Human | Esophagus | ESCC | 8.06e-06 | 1.11e-01 | 0.0596 |
| 57530 | CGN | P1T-E | Human | Esophagus | ESCC | 1.62e-03 | 2.92e-01 | 0.0875 |
| 57530 | CGN | P2T-E | Human | Esophagus | ESCC | 4.11e-19 | 2.02e-01 | 0.1177 |
| 57530 | CGN | P8T-E | Human | Esophagus | ESCC | 3.67e-22 | 4.47e-01 | 0.0889 |
| 57530 | CGN | P10T-E | Human | Esophagus | ESCC | 4.70e-07 | 1.08e-01 | 0.116 |
| Page: 1 2 3 |
| Tissue | Expression Dynamics | Abbreviation |
| Colorectum (GSE201348) |  | FAP: Familial adenomatous polyposis |
| CRC: Colorectal cancer | ||
| Colorectum (HTA11) |  | AD: Adenomas |
| SER: Sessile serrated lesions | ||
| MSI-H: Microsatellite-high colorectal cancer | ||
| MSS: Microsatellite stable colorectal cancer | ||
| Esophagus | 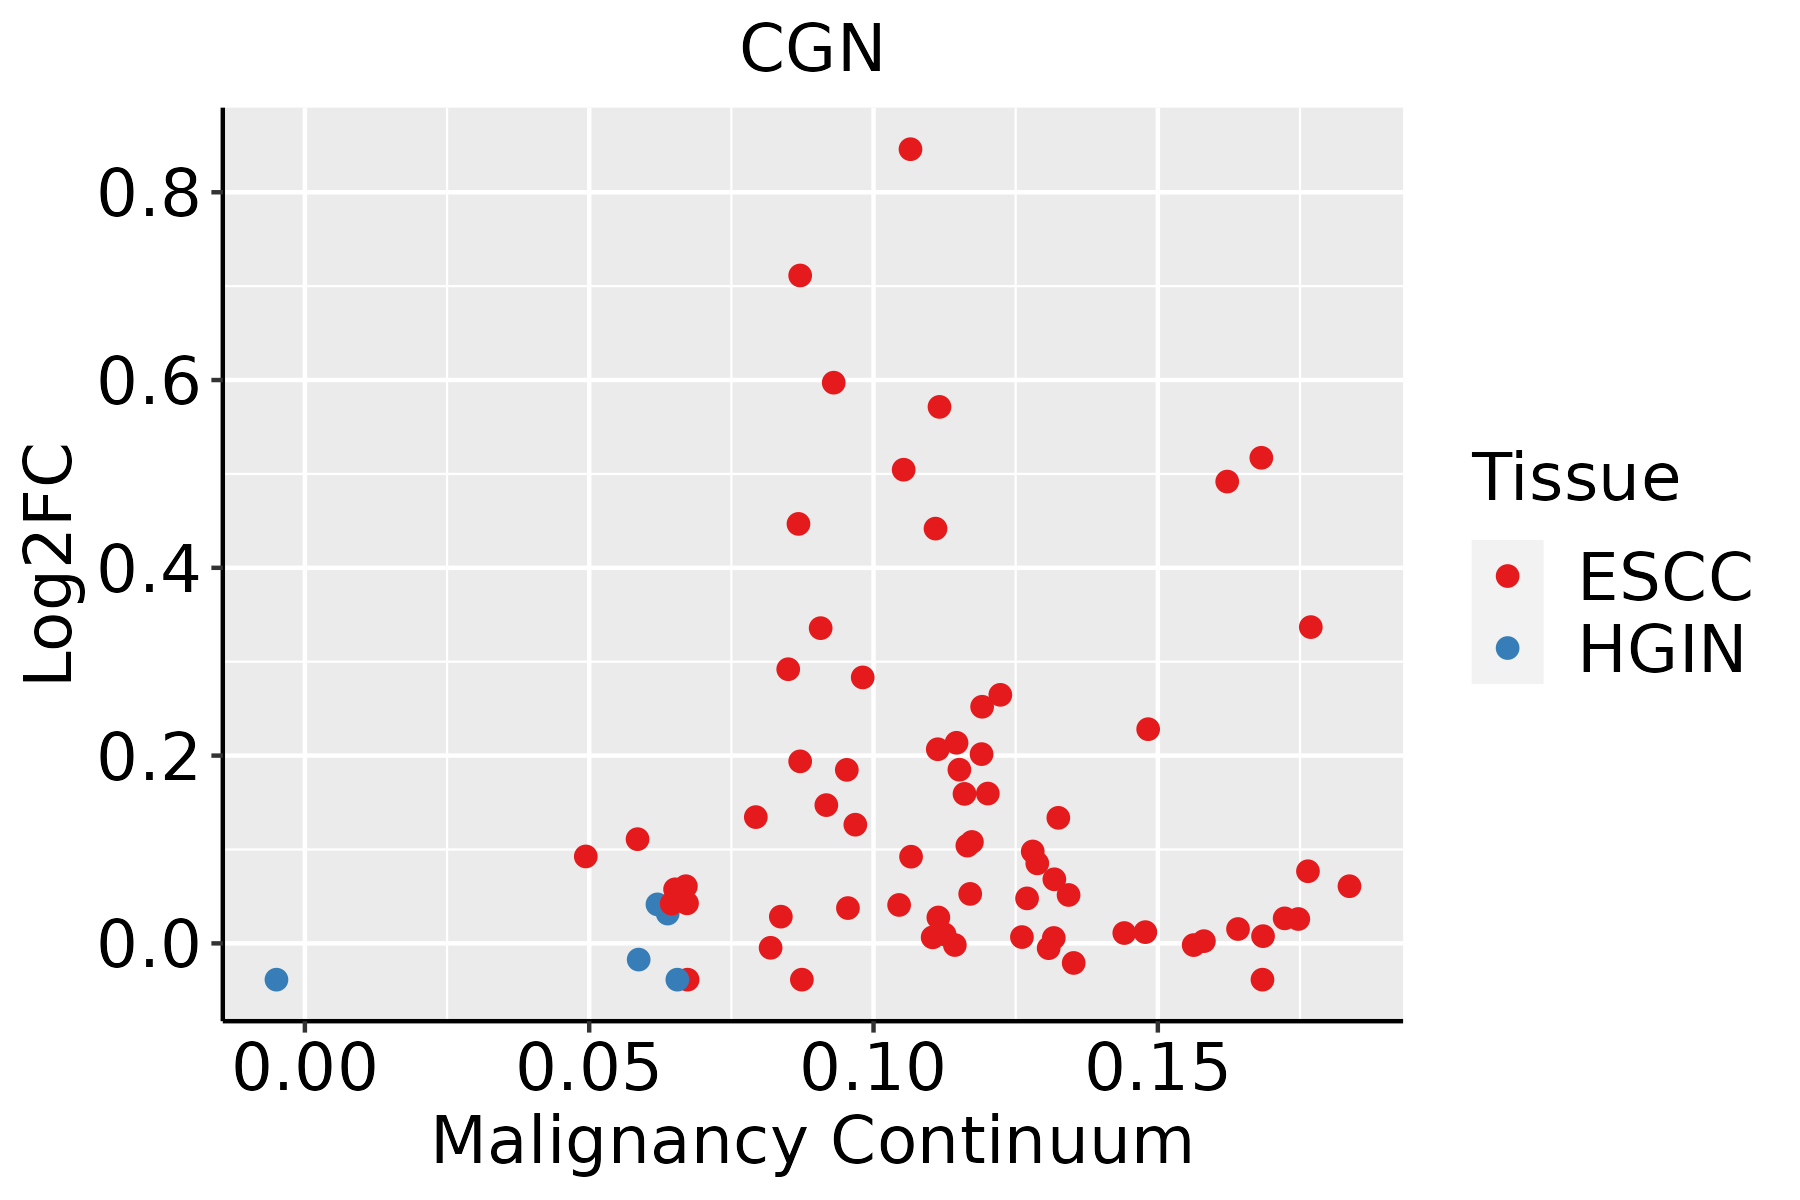 | ESCC: Esophageal squamous cell carcinoma |
| HGIN: High-grade intraepithelial neoplasias | ||
| LGIN: Low-grade intraepithelial neoplasias | ||
| Liver |  | HCC: Hepatocellular carcinoma |
| NAFLD: Non-alcoholic fatty liver disease |
| ∗log2FC in expression of this searched gene in stem-like cells from each diseased tissue sample relative to stem-like cells in normal samples in each tissue plotted against the malignancy continuum. Samples are colored based on if they are from different disease stage. |
Top |
Malignant transformation related pathway analysis |
| Find out the enriched GO biological processes and KEGG pathways involved in transition from healthy to precancer to cancer |
| Tissue | Disease Stage | Enriched GO biological Processes |
| Colorectum | AD |  |
| Colorectum | SER |  |
| Colorectum | MSS |  |
| Colorectum | MSI-H |  |
| Colorectum | FAP |  |
| ∗Top 15 enriched GO BP terms are showed in the bar plot of each disease state in each tissue. Each row represents a significant GO biological process which is colored according to the -log10(p.adjust). |
| Page: 1 2 3 4 5 6 7 8 9 |
| GO ID | Tissue | Disease Stage | Description | Gene Ratio | Bg Ratio | pvalue | p.adjust | Count |
| GO:0051492111 | Thyroid | PTC | regulation of stress fiber assembly | 50/5968 | 91/18723 | 4.33e-06 | 5.35e-05 | 50 |
| GO:003003827 | Thyroid | PTC | contractile actin filament bundle assembly | 56/5968 | 106/18723 | 6.01e-06 | 7.21e-05 | 56 |
| GO:004314927 | Thyroid | PTC | stress fiber assembly | 56/5968 | 106/18723 | 6.01e-06 | 7.21e-05 | 56 |
| GO:005105617 | Thyroid | PTC | regulation of small GTPase mediated signal transduction | 132/5968 | 302/18723 | 9.26e-06 | 1.04e-04 | 132 |
| GO:0110020111 | Thyroid | PTC | regulation of actomyosin structure organization | 53/5968 | 100/18723 | 9.35e-06 | 1.05e-04 | 53 |
| GO:0031032110 | Thyroid | PTC | actomyosin structure organization | 91/5968 | 196/18723 | 1.35e-05 | 1.45e-04 | 91 |
| GO:1902904111 | Thyroid | PTC | negative regulation of supramolecular fiber organization | 78/5968 | 167/18723 | 4.16e-05 | 3.80e-04 | 78 |
| GO:00510586 | Thyroid | PTC | negative regulation of small GTPase mediated signal transduction | 31/5968 | 56/18723 | 2.32e-04 | 1.68e-03 | 31 |
| GO:005149419 | Thyroid | PTC | negative regulation of cytoskeleton organization | 73/5968 | 163/18723 | 3.59e-04 | 2.44e-03 | 73 |
| GO:0150105110 | Thyroid | PTC | protein localization to cell-cell junction | 14/5968 | 21/18723 | 1.11e-03 | 6.51e-03 | 14 |
| GO:19024145 | Thyroid | PTC | protein localization to cell junction | 43/5968 | 94/18723 | 3.32e-03 | 1.62e-02 | 43 |
| GO:00514978 | Thyroid | PTC | negative regulation of stress fiber assembly | 17/5968 | 32/18723 | 1.02e-02 | 4.11e-02 | 17 |
| GO:1902903210 | Thyroid | ATC | regulation of supramolecular fiber organization | 210/6293 | 383/18723 | 6.20e-18 | 7.54e-16 | 210 |
| GO:0032970210 | Thyroid | ATC | regulation of actin filament-based process | 208/6293 | 397/18723 | 5.82e-15 | 3.80e-13 | 208 |
| GO:0007015210 | Thyroid | ATC | actin filament organization | 227/6293 | 442/18723 | 5.96e-15 | 3.85e-13 | 227 |
| GO:0032956210 | Thyroid | ATC | regulation of actin cytoskeleton organization | 190/6293 | 358/18723 | 1.73e-14 | 1.01e-12 | 190 |
| GO:0110053210 | Thyroid | ATC | regulation of actin filament organization | 150/6293 | 278/18723 | 1.82e-12 | 7.58e-11 | 150 |
| GO:001063926 | Thyroid | ATC | negative regulation of organelle organization | 179/6293 | 348/18723 | 3.74e-12 | 1.50e-10 | 179 |
| GO:0051017210 | Thyroid | ATC | actin filament bundle assembly | 85/6293 | 157/18723 | 8.99e-08 | 1.54e-06 | 85 |
| GO:0061572210 | Thyroid | ATC | actin filament bundle organization | 86/6293 | 161/18723 | 1.68e-07 | 2.69e-06 | 86 |
| Page: 1 2 3 4 5 6 7 |
| Pathway ID | Tissue | Disease Stage | Description | Gene Ratio | Bg Ratio | pvalue | p.adjust | qvalue | Count |
| hsa04530 | Colorectum | AD | Tight junction | 76/2092 | 169/8465 | 5.49e-09 | 9.69e-08 | 6.18e-08 | 76 |
| hsa045301 | Colorectum | AD | Tight junction | 76/2092 | 169/8465 | 5.49e-09 | 9.69e-08 | 6.18e-08 | 76 |
| hsa045302 | Colorectum | SER | Tight junction | 59/1580 | 169/8465 | 3.24e-07 | 5.98e-06 | 4.34e-06 | 59 |
| hsa045303 | Colorectum | SER | Tight junction | 59/1580 | 169/8465 | 3.24e-07 | 5.98e-06 | 4.34e-06 | 59 |
| hsa045304 | Colorectum | MSS | Tight junction | 66/1875 | 169/8465 | 4.10e-07 | 6.25e-06 | 3.83e-06 | 66 |
| hsa045305 | Colorectum | MSS | Tight junction | 66/1875 | 169/8465 | 4.10e-07 | 6.25e-06 | 3.83e-06 | 66 |
| hsa045308 | Colorectum | FAP | Tight junction | 60/1404 | 169/8465 | 1.40e-09 | 9.33e-08 | 5.67e-08 | 60 |
| hsa045309 | Colorectum | FAP | Tight junction | 60/1404 | 169/8465 | 1.40e-09 | 9.33e-08 | 5.67e-08 | 60 |
| hsa04530211 | Esophagus | ESCC | Tight junction | 105/4205 | 169/8465 | 6.73e-04 | 2.23e-03 | 1.14e-03 | 105 |
| hsa04530310 | Esophagus | ESCC | Tight junction | 105/4205 | 169/8465 | 6.73e-04 | 2.23e-03 | 1.14e-03 | 105 |
| hsa0453022 | Liver | Cirrhotic | Tight junction | 82/2530 | 169/8465 | 2.14e-07 | 2.85e-06 | 1.76e-06 | 82 |
| hsa0453032 | Liver | Cirrhotic | Tight junction | 82/2530 | 169/8465 | 2.14e-07 | 2.85e-06 | 1.76e-06 | 82 |
| hsa0453042 | Liver | HCC | Tight junction | 110/4020 | 169/8465 | 2.45e-06 | 2.28e-05 | 1.27e-05 | 110 |
| hsa0453052 | Liver | HCC | Tight junction | 110/4020 | 169/8465 | 2.45e-06 | 2.28e-05 | 1.27e-05 | 110 |
| Page: 1 |
Top |
Cell-cell communication analysis |
| Identification of potential cell-cell interactions between two cell types and their ligand-receptor pairs for different disease states |
| Ligand | Receptor | LRpair | Pathway | Tissue | Disease Stage |
| Page: 1 |
Top |
Single-cell gene regulatory network inference analysis |
| Find out the significant the regulons (TFs) and the target genes of each regulon across cell types for different disease states |
| TF | Cell Type | Tissue | Disease Stage | Target Gene | RSS | Regulon Activity |
| ∗The dot plots of a searched regulon are shown for all cell subpopulations in each disease state of each tissue based on the regulon specific score inferred using pySCENIC and by calculating the average expression. |
| Page: 1 |
Top |
Somatic mutation of malignant transformation related genes |
| Annotation of somatic variants for genes involved in malignant transformation |
| Hugo Symbol | Variant Class | Variant Classification | dbSNP RS | HGVSc | HGVSp | HGVSp Short | SWISSPROT | BIOTYPE | SIFT | PolyPhen | Tumor Sample Barcode | Tissue | Histology | Sex | Age | Stage | Therapy Types | Drugs | Outcome |
| CGN | SNV | Missense_Mutation | c.3427G>C | p.Glu1143Gln | p.E1143Q | Q9P2M7 | protein_coding | deleterious(0) | possibly_damaging(0.781) | TCGA-AC-A23H-01 | Breast | breast invasive carcinoma | Female | >=65 | I/II | Unknown | Unknown | PD | |
| CGN | SNV | Missense_Mutation | novel | c.2770N>C | p.Ala924Pro | p.A924P | Q9P2M7 | protein_coding | tolerated(0.17) | possibly_damaging(0.625) | TCGA-AC-A8OP-01 | Breast | breast invasive carcinoma | Female | >=65 | I/II | Unknown | Unknown | SD |
| CGN | SNV | Missense_Mutation | novel | c.306G>T | p.Glu102Asp | p.E102D | Q9P2M7 | protein_coding | tolerated(0.07) | benign(0.015) | TCGA-AN-A046-01 | Breast | breast invasive carcinoma | Female | >=65 | I/II | Unknown | Unknown | SD |
| CGN | SNV | Missense_Mutation | novel | c.1016N>C | p.Leu339Ser | p.L339S | Q9P2M7 | protein_coding | deleterious(0) | probably_damaging(1) | TCGA-AQ-A7U7-01 | Breast | breast invasive carcinoma | Female | <65 | III/IV | Targeted Molecular therapy | rituximab | CR |
| CGN | SNV | Missense_Mutation | novel | c.1103T>C | p.Val368Ala | p.V368A | Q9P2M7 | protein_coding | deleterious(0) | benign(0.253) | TCGA-BH-A18G-01 | Breast | breast invasive carcinoma | Female | >=65 | I/II | Unknown | Unknown | SD |
| CGN | SNV | Missense_Mutation | rs778510582 | c.1144C>T | p.Arg382Trp | p.R382W | Q9P2M7 | protein_coding | deleterious(0) | benign(0.039) | TCGA-BH-A18G-01 | Breast | breast invasive carcinoma | Female | >=65 | I/II | Unknown | Unknown | SD |
| CGN | SNV | Missense_Mutation | rs750576628 | c.2698G>A | p.Glu900Lys | p.E900K | Q9P2M7 | protein_coding | deleterious(0) | probably_damaging(0.998) | TCGA-D8-A27W-01 | Breast | breast invasive carcinoma | Female | <65 | III/IV | Chemotherapy | doxorubicine+cyclophosphamide | SD |
| CGN | SNV | Missense_Mutation | rs199924639 | c.3398N>A | p.Arg1133His | p.R1133H | Q9P2M7 | protein_coding | deleterious(0) | probably_damaging(0.999) | TCGA-E2-A1IN-01 | Breast | breast invasive carcinoma | Female | <65 | I/II | Hormone Therapy | arimidex | SD |
| CGN | SNV | Missense_Mutation | c.3426T>A | p.Asn1142Lys | p.N1142K | Q9P2M7 | protein_coding | tolerated(0.18) | possibly_damaging(0.662) | TCGA-GM-A2DD-01 | Breast | breast invasive carcinoma | Female | <65 | I/II | Chemotherapy | fluorouracil | CR | |
| CGN | insertion | Nonsense_Mutation | novel | c.3437_3438insAATGGTGGAGCTCATGGCTGAGAGGAGTCCTTGGGGACAGTAG | p.Ala1147MetfsTer14 | p.A1147Mfs*14 | Q9P2M7 | protein_coding | TCGA-A8-A08R-01 | Breast | breast invasive carcinoma | Female | <65 | I/II | Unknown | Unknown | SD |
| Page: 1 2 3 4 5 6 7 8 9 10 11 12 13 |
Top |
Related drugs of malignant transformation related genes |
| Identification of chemicals and drugs interact with genes involved in malignant transfromation |
| (DGIdb 4.0) |
| Entrez ID | Symbol | Category | Interaction Types | Drug Claim Name | Drug Name | PMIDs |
| Page: 1 |

Copyright 2023-Present -The University of Texas Health Science Center at Houston |