
|
|||||
|
 | |
| |
| |
| |
| |
| |
|
Gene: CA1 |
Gene summary for CA1 |
| Gene information | Species | Human | Gene symbol | CA1 | Gene ID | 759 |
| Gene name | carbonic anhydrase 1 | |
| Gene Alias | CA-I | |
| Cytomap | 8q21.2 | |
| Gene Type | protein-coding | GO ID | GO:0006730 | UniProtAcc | P00915 |
Top |
Malignant transformation analysis |
| Identification of the aberrant gene expression in precancerous and cancerous lesions by comparing the gene expression of stem-like cells in diseased tissues with normal stem cells |
| Entrez ID | Symbol | Replicates | Species | Organ | Tissue | Adj P-value | Log2FC | Malignancy |
| 759 | CA1 | HTA11_3410_2000001011 | Human | Colorectum | AD | 4.47e-04 | -2.33e-01 | 0.0155 |
| 759 | CA1 | HTA11_347_2000001011 | Human | Colorectum | AD | 5.04e-27 | 2.26e+00 | -0.1954 |
| 759 | CA1 | HTA11_411_2000001011 | Human | Colorectum | SER | 1.31e-02 | 2.07e+00 | -0.2602 |
| 759 | CA1 | HTA11_696_2000001011 | Human | Colorectum | AD | 8.28e-14 | 1.10e+00 | -0.1464 |
| 759 | CA1 | HTA11_866_2000001011 | Human | Colorectum | AD | 3.61e-02 | 6.63e-01 | -0.1001 |
| 759 | CA1 | HTA11_2992_2000001011 | Human | Colorectum | SER | 1.28e-09 | 3.25e+00 | -0.1706 |
| 759 | CA1 | HTA11_5212_2000001011 | Human | Colorectum | AD | 2.56e-25 | 3.91e+00 | -0.2061 |
| 759 | CA1 | HTA11_5216_2000001011 | Human | Colorectum | SER | 1.01e-06 | 2.38e+00 | -0.1462 |
| 759 | CA1 | HTA11_866_3004761011 | Human | Colorectum | AD | 1.76e-04 | -2.43e-01 | 0.096 |
| 759 | CA1 | HTA11_7696_3000711011 | Human | Colorectum | AD | 9.06e-05 | -2.30e-01 | 0.0674 |
| 759 | CA1 | HTA11_99999970781_79442 | Human | Colorectum | MSS | 6.27e-03 | -2.40e-01 | 0.294 |
| 759 | CA1 | HTA11_99999971662_82457 | Human | Colorectum | MSS | 1.49e-05 | -2.46e-01 | 0.3859 |
| 759 | CA1 | HTA11_99999974143_84620 | Human | Colorectum | MSS | 5.76e-05 | -2.45e-01 | 0.3005 |
| 759 | CA1 | A001-C-207 | Human | Colorectum | FAP | 6.53e-06 | -2.50e-01 | 0.1278 |
| 759 | CA1 | A002-C-201 | Human | Colorectum | FAP | 4.40e-09 | -2.50e-01 | 0.0324 |
| 759 | CA1 | A002-C-203 | Human | Colorectum | FAP | 9.63e-08 | -2.47e-01 | 0.2786 |
| 759 | CA1 | A001-C-119 | Human | Colorectum | FAP | 1.41e-04 | -2.50e-01 | -0.1557 |
| 759 | CA1 | A001-C-108 | Human | Colorectum | FAP | 2.16e-03 | -2.07e-01 | -0.0272 |
| 759 | CA1 | A002-C-205 | Human | Colorectum | FAP | 1.28e-05 | -2.21e-01 | -0.1236 |
| 759 | CA1 | A014-C-108 | Human | Colorectum | FAP | 2.37e-02 | -2.31e-01 | -0.124 |
| Page: 1 2 3 |
| Tissue | Expression Dynamics | Abbreviation |
| Colorectum (GSE201348) |  | FAP: Familial adenomatous polyposis |
| CRC: Colorectal cancer | ||
| Colorectum (HTA11) |  | AD: Adenomas |
| SER: Sessile serrated lesions | ||
| MSI-H: Microsatellite-high colorectal cancer | ||
| MSS: Microsatellite stable colorectal cancer | ||
| GC | 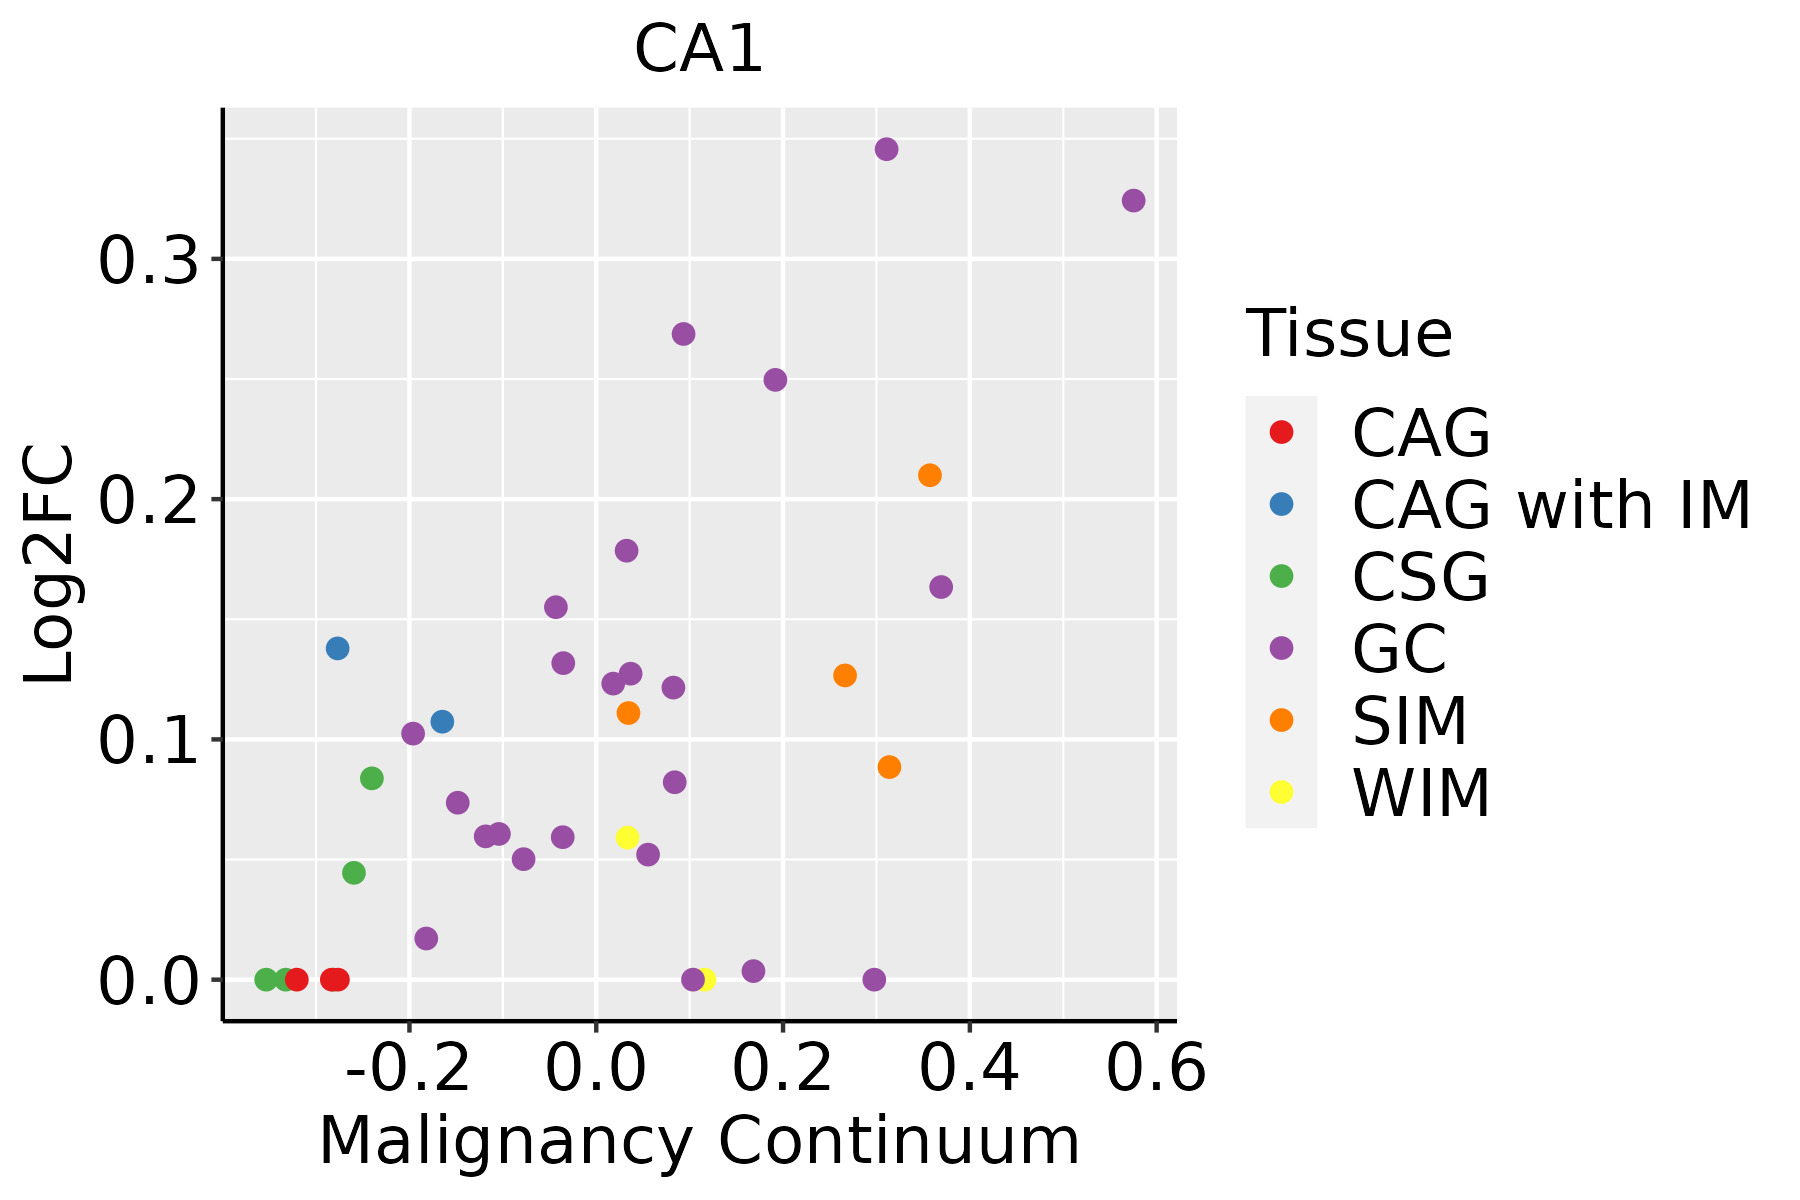 | CAG: Chronic atrophic gastritis |
| CAG with IM: Chronic atrophic gastritis with intestinal metaplasia | ||
| CSG: Chronic superficial gastritis | ||
| GC: Gastric cancer | ||
| SIM: Severe intestinal metaplasia | ||
| WIM: Wild intestinal metaplasia |
| ∗log2FC in expression of this searched gene in stem-like cells from each diseased tissue sample relative to stem-like cells in normal samples in each tissue plotted against the malignancy continuum. Samples are colored based on if they are from different disease stage. |
Top |
Malignant transformation related pathway analysis |
| Find out the enriched GO biological processes and KEGG pathways involved in transition from healthy to precancer to cancer |
| Tissue | Disease Stage | Enriched GO biological Processes |
| Colorectum | AD |  |
| Colorectum | SER |  |
| Colorectum | MSS |  |
| Colorectum | MSI-H |  |
| Colorectum | FAP |  |
| ∗Top 15 enriched GO BP terms are showed in the bar plot of each disease state in each tissue. Each row represents a significant GO biological process which is colored according to the -log10(p.adjust). |
| Page: 1 2 3 4 5 6 7 8 9 |
| GO ID | Tissue | Disease Stage | Description | Gene Ratio | Bg Ratio | pvalue | p.adjust | Count |
| GO:00160421 | Colorectum | SER | lipid catabolic process | 77/2897 | 320/18723 | 3.52e-05 | 9.18e-04 | 77 |
| GO:00725931 | Colorectum | SER | reactive oxygen species metabolic process | 61/2897 | 239/18723 | 3.63e-05 | 9.39e-04 | 61 |
| GO:00510541 | Colorectum | SER | positive regulation of DNA metabolic process | 53/2897 | 201/18723 | 4.51e-05 | 1.13e-03 | 53 |
| GO:00485451 | Colorectum | SER | response to steroid hormone | 80/2897 | 339/18723 | 5.15e-05 | 1.25e-03 | 80 |
| GO:00510521 | Colorectum | SER | regulation of DNA metabolic process | 83/2897 | 359/18723 | 8.03e-05 | 1.77e-03 | 83 |
| GO:00434011 | Colorectum | SER | steroid hormone mediated signaling pathway | 38/2897 | 136/18723 | 1.42e-04 | 2.82e-03 | 38 |
| GO:00097551 | Colorectum | SER | hormone-mediated signaling pathway | 49/2897 | 190/18723 | 1.54e-04 | 3.00e-03 | 49 |
| GO:00002091 | Colorectum | SER | protein polyubiquitination | 58/2897 | 236/18723 | 1.69e-04 | 3.18e-03 | 58 |
| GO:00704821 | Colorectum | SER | response to oxygen levels | 79/2897 | 347/18723 | 1.99e-04 | 3.64e-03 | 79 |
| GO:00305221 | Colorectum | SER | intracellular receptor signaling pathway | 63/2897 | 265/18723 | 2.47e-04 | 4.20e-03 | 63 |
| GO:20003771 | Colorectum | SER | regulation of reactive oxygen species metabolic process | 41/2897 | 157/18723 | 3.86e-04 | 5.86e-03 | 41 |
| GO:00067301 | Colorectum | SER | one-carbon metabolic process | 15/2897 | 40/18723 | 5.71e-04 | 7.86e-03 | 15 |
| GO:00193181 | Colorectum | SER | hexose metabolic process | 56/2897 | 237/18723 | 6.19e-04 | 8.42e-03 | 56 |
| GO:2001236 | Colorectum | SER | regulation of extrinsic apoptotic signaling pathway | 39/2897 | 151/18723 | 6.67e-04 | 8.94e-03 | 39 |
| GO:00016661 | Colorectum | SER | response to hypoxia | 69/2897 | 307/18723 | 7.07e-04 | 9.39e-03 | 69 |
| GO:00466051 | Colorectum | SER | regulation of centrosome cycle | 17/2897 | 49/18723 | 7.17e-04 | 9.44e-03 | 17 |
| GO:00442421 | Colorectum | SER | cellular lipid catabolic process | 51/2897 | 214/18723 | 8.60e-04 | 1.05e-02 | 51 |
| GO:00059961 | Colorectum | SER | monosaccharide metabolic process | 59/2897 | 257/18723 | 9.65e-04 | 1.15e-02 | 59 |
| GO:00362931 | Colorectum | SER | response to decreased oxygen levels | 71/2897 | 322/18723 | 1.04e-03 | 1.22e-02 | 71 |
| GO:00305181 | Colorectum | SER | intracellular steroid hormone receptor signaling pathway | 31/2897 | 116/18723 | 1.25e-03 | 1.41e-02 | 31 |
| Page: 1 2 3 4 5 6 7 8 9 10 11 12 13 14 15 16 17 18 19 20 21 22 23 24 25 26 27 28 29 30 31 32 33 34 35 36 37 38 39 40 41 42 43 44 45 46 47 48 49 50 51 52 53 54 55 56 57 58 59 60 61 62 63 64 |
| Pathway ID | Tissue | Disease Stage | Description | Gene Ratio | Bg Ratio | pvalue | p.adjust | qvalue | Count |
| Page: 1 |
Top |
Cell-cell communication analysis |
| Identification of potential cell-cell interactions between two cell types and their ligand-receptor pairs for different disease states |
| Ligand | Receptor | LRpair | Pathway | Tissue | Disease Stage |
| Page: 1 |
Top |
Single-cell gene regulatory network inference analysis |
| Find out the significant the regulons (TFs) and the target genes of each regulon across cell types for different disease states |
| TF | Cell Type | Tissue | Disease Stage | Target Gene | RSS | Regulon Activity |
| ∗The dot plots of a searched regulon are shown for all cell subpopulations in each disease state of each tissue based on the regulon specific score inferred using pySCENIC and by calculating the average expression. |
| Page: 1 |
Top |
Somatic mutation of malignant transformation related genes |
| Annotation of somatic variants for genes involved in malignant transformation |
| Hugo Symbol | Variant Class | Variant Classification | dbSNP RS | HGVSc | HGVSp | HGVSp Short | SWISSPROT | BIOTYPE | SIFT | PolyPhen | Tumor Sample Barcode | Tissue | Histology | Sex | Age | Stage | Therapy Types | Drugs | Outcome |
| CA1 | SNV | Missense_Mutation | c.539T>G | p.Phe180Cys | p.F180C | P00915 | protein_coding | deleterious(0) | probably_damaging(1) | TCGA-BH-A1FJ-01 | Breast | breast invasive carcinoma | Female | >=65 | III/IV | Unknown | Unknown | SD | |
| CA1 | SNV | Missense_Mutation | novel | c.83N>G | p.Asn28Ser | p.N28S | P00915 | protein_coding | deleterious(0.02) | benign(0.007) | TCGA-2W-A8YY-01 | Cervix | cervical & endocervical cancer | Female | <65 | I/II | Chemotherapy | cisplatin | CR |
| CA1 | SNV | Missense_Mutation | novel | c.13G>A | p.Asp5Asn | p.D5N | P00915 | protein_coding | tolerated(0.97) | benign(0) | TCGA-EA-A97N-01 | Cervix | cervical & endocervical cancer | Female | <65 | I/II | Unknown | Unknown | SD |
| CA1 | SNV | Missense_Mutation | rs141945543 | c.715G>A | p.Ala239Thr | p.A239T | P00915 | protein_coding | tolerated(0.3) | benign(0.333) | TCGA-AZ-4615-01 | Colorectum | colon adenocarcinoma | Male | >=65 | III/IV | Chemotherapy | xeloda | PD |
| CA1 | SNV | Missense_Mutation | c.208N>C | p.Asn70His | p.N70H | P00915 | protein_coding | deleterious(0.02) | possibly_damaging(0.733) | TCGA-CA-6718-01 | Colorectum | colon adenocarcinoma | Male | <65 | I/II | Unknown | Unknown | PD | |
| CA1 | insertion | Frame_Shift_Ins | novel | c.192_193insG | p.His65AlafsTer8 | p.H65Afs*8 | P00915 | protein_coding | TCGA-A6-5665-01 | Colorectum | colon adenocarcinoma | Female | >=65 | I/II | Unknown | Unknown | PD | ||
| CA1 | SNV | Missense_Mutation | c.40C>A | p.Pro14Thr | p.P14T | P00915 | protein_coding | deleterious(0) | probably_damaging(1) | TCGA-A5-A0G2-01 | Endometrium | uterine corpus endometrioid carcinoma | Female | <65 | III/IV | Unknown | Unknown | SD | |
| CA1 | SNV | Missense_Mutation | c.358N>A | p.His120Asn | p.H120N | P00915 | protein_coding | deleterious(0.01) | probably_damaging(1) | TCGA-AX-A05Z-01 | Endometrium | uterine corpus endometrioid carcinoma | Female | <65 | III/IV | Chemotherapy | adriamycin | SD | |
| CA1 | SNV | Missense_Mutation | rs121909578 | c.740N>A | p.Arg247His | p.R247H | P00915 | protein_coding | deleterious(0) | probably_damaging(1) | TCGA-AX-A1CE-01 | Endometrium | uterine corpus endometrioid carcinoma | Female | <65 | I/II | Unspecific | Paclitaxel | SD |
| CA1 | SNV | Missense_Mutation | novel | c.344N>G | p.Tyr115Cys | p.Y115C | P00915 | protein_coding | deleterious(0) | probably_damaging(0.972) | TCGA-AX-A1CE-01 | Endometrium | uterine corpus endometrioid carcinoma | Female | <65 | I/II | Unspecific | Paclitaxel | SD |
| Page: 1 2 3 4 |
Top |
Related drugs of malignant transformation related genes |
| Identification of chemicals and drugs interact with genes involved in malignant transfromation |
| (DGIdb 4.0) |
| Entrez ID | Symbol | Category | Interaction Types | Drug Claim Name | Drug Name | PMIDs |
| 759 | CA1 | DRUGGABLE GENOME, ENZYME | DICHLORPHENAMIDE | DICHLORPHENAMIDE | ||
| 759 | CA1 | DRUGGABLE GENOME, ENZYME | inhibitor | CHEMBL1200814 | ACETAZOLAMIDE SODIUM | |
| 759 | CA1 | DRUGGABLE GENOME, ENZYME | ZONISAMIDE | ZONISAMIDE | ||
| 759 | CA1 | DRUGGABLE GENOME, ENZYME | inhibitor | CHEMBL166863 | POLMACOXIB | |
| 759 | CA1 | DRUGGABLE GENOME, ENZYME | inhibitor | 178103435 | METHOCARBAMOL | |
| 759 | CA1 | DRUGGABLE GENOME, ENZYME | inhibitor | 178102191 | ||
| 759 | CA1 | DRUGGABLE GENOME, ENZYME | inhibitor | 381118859 | ||
| 759 | CA1 | DRUGGABLE GENOME, ENZYME | Ethoxzolamide | ETHOXZOLAMIDE | ||
| 759 | CA1 | DRUGGABLE GENOME, ENZYME | inhibitor | 178103398 | ACETAZOLAMIDE | |
| 759 | CA1 | DRUGGABLE GENOME, ENZYME | activator | 178100344 | HISTIDINE |
| Page: 1 2 3 4 5 6 |

Copyright 2023-Present -The University of Texas Health Science Center at Houston |