
|
|||||
|
 | |
| |
| |
| |
| |
| |
|
Gene: BICD2 |
Gene summary for BICD2 |
| Gene information | Species | Human | Gene symbol | BICD2 | Gene ID | 23299 |
| Gene name | BICD cargo adaptor 2 | |
| Gene Alias | SMALED2 | |
| Cytomap | 9q22.31 | |
| Gene Type | protein-coding | GO ID | GO:0000226 | UniProtAcc | Q8TD16 |
Top |
Malignant transformation analysis |
| Identification of the aberrant gene expression in precancerous and cancerous lesions by comparing the gene expression of stem-like cells in diseased tissues with normal stem cells |
| Entrez ID | Symbol | Replicates | Species | Organ | Tissue | Adj P-value | Log2FC | Malignancy |
| 23299 | BICD2 | LZE4T | Human | Esophagus | ESCC | 4.71e-10 | 2.29e-01 | 0.0811 |
| 23299 | BICD2 | LZE8T | Human | Esophagus | ESCC | 3.11e-08 | -1.83e-01 | 0.067 |
| 23299 | BICD2 | LZE20T | Human | Esophagus | ESCC | 3.21e-04 | -3.19e-01 | 0.0662 |
| 23299 | BICD2 | LZE22T | Human | Esophagus | ESCC | 2.61e-06 | -2.29e-02 | 0.068 |
| 23299 | BICD2 | LZE24T | Human | Esophagus | ESCC | 4.54e-06 | -3.47e-02 | 0.0596 |
| 23299 | BICD2 | P1T-E | Human | Esophagus | ESCC | 1.18e-08 | -9.00e-02 | 0.0875 |
| 23299 | BICD2 | P2T-E | Human | Esophagus | ESCC | 4.62e-22 | 2.18e-01 | 0.1177 |
| 23299 | BICD2 | P4T-E | Human | Esophagus | ESCC | 1.36e-17 | 2.70e-02 | 0.1323 |
| 23299 | BICD2 | P5T-E | Human | Esophagus | ESCC | 1.67e-13 | 5.72e-02 | 0.1327 |
| 23299 | BICD2 | P8T-E | Human | Esophagus | ESCC | 3.01e-09 | -1.67e-01 | 0.0889 |
| 23299 | BICD2 | P9T-E | Human | Esophagus | ESCC | 8.00e-17 | 1.98e-01 | 0.1131 |
| 23299 | BICD2 | P10T-E | Human | Esophagus | ESCC | 7.57e-22 | 5.00e-01 | 0.116 |
| 23299 | BICD2 | P11T-E | Human | Esophagus | ESCC | 1.43e-07 | 2.25e-01 | 0.1426 |
| 23299 | BICD2 | P12T-E | Human | Esophagus | ESCC | 6.55e-21 | 4.08e-01 | 0.1122 |
| 23299 | BICD2 | P15T-E | Human | Esophagus | ESCC | 4.43e-21 | 3.63e-01 | 0.1149 |
| 23299 | BICD2 | P16T-E | Human | Esophagus | ESCC | 1.46e-13 | -2.47e-01 | 0.1153 |
| 23299 | BICD2 | P17T-E | Human | Esophagus | ESCC | 1.41e-05 | -6.51e-02 | 0.1278 |
| 23299 | BICD2 | P19T-E | Human | Esophagus | ESCC | 1.17e-02 | 2.60e-01 | 0.1662 |
| 23299 | BICD2 | P20T-E | Human | Esophagus | ESCC | 5.35e-19 | 2.24e-01 | 0.1124 |
| 23299 | BICD2 | P21T-E | Human | Esophagus | ESCC | 4.02e-22 | 6.46e-01 | 0.1617 |
| Page: 1 2 3 4 5 6 |
| Tissue | Expression Dynamics | Abbreviation |
| Esophagus |  | ESCC: Esophageal squamous cell carcinoma |
| HGIN: High-grade intraepithelial neoplasias | ||
| LGIN: Low-grade intraepithelial neoplasias | ||
| Oral Cavity |  | EOLP: Erosive Oral lichen planus |
| LP: leukoplakia | ||
| NEOLP: Non-erosive oral lichen planus | ||
| OSCC: Oral squamous cell carcinoma | ||
| Prostate | 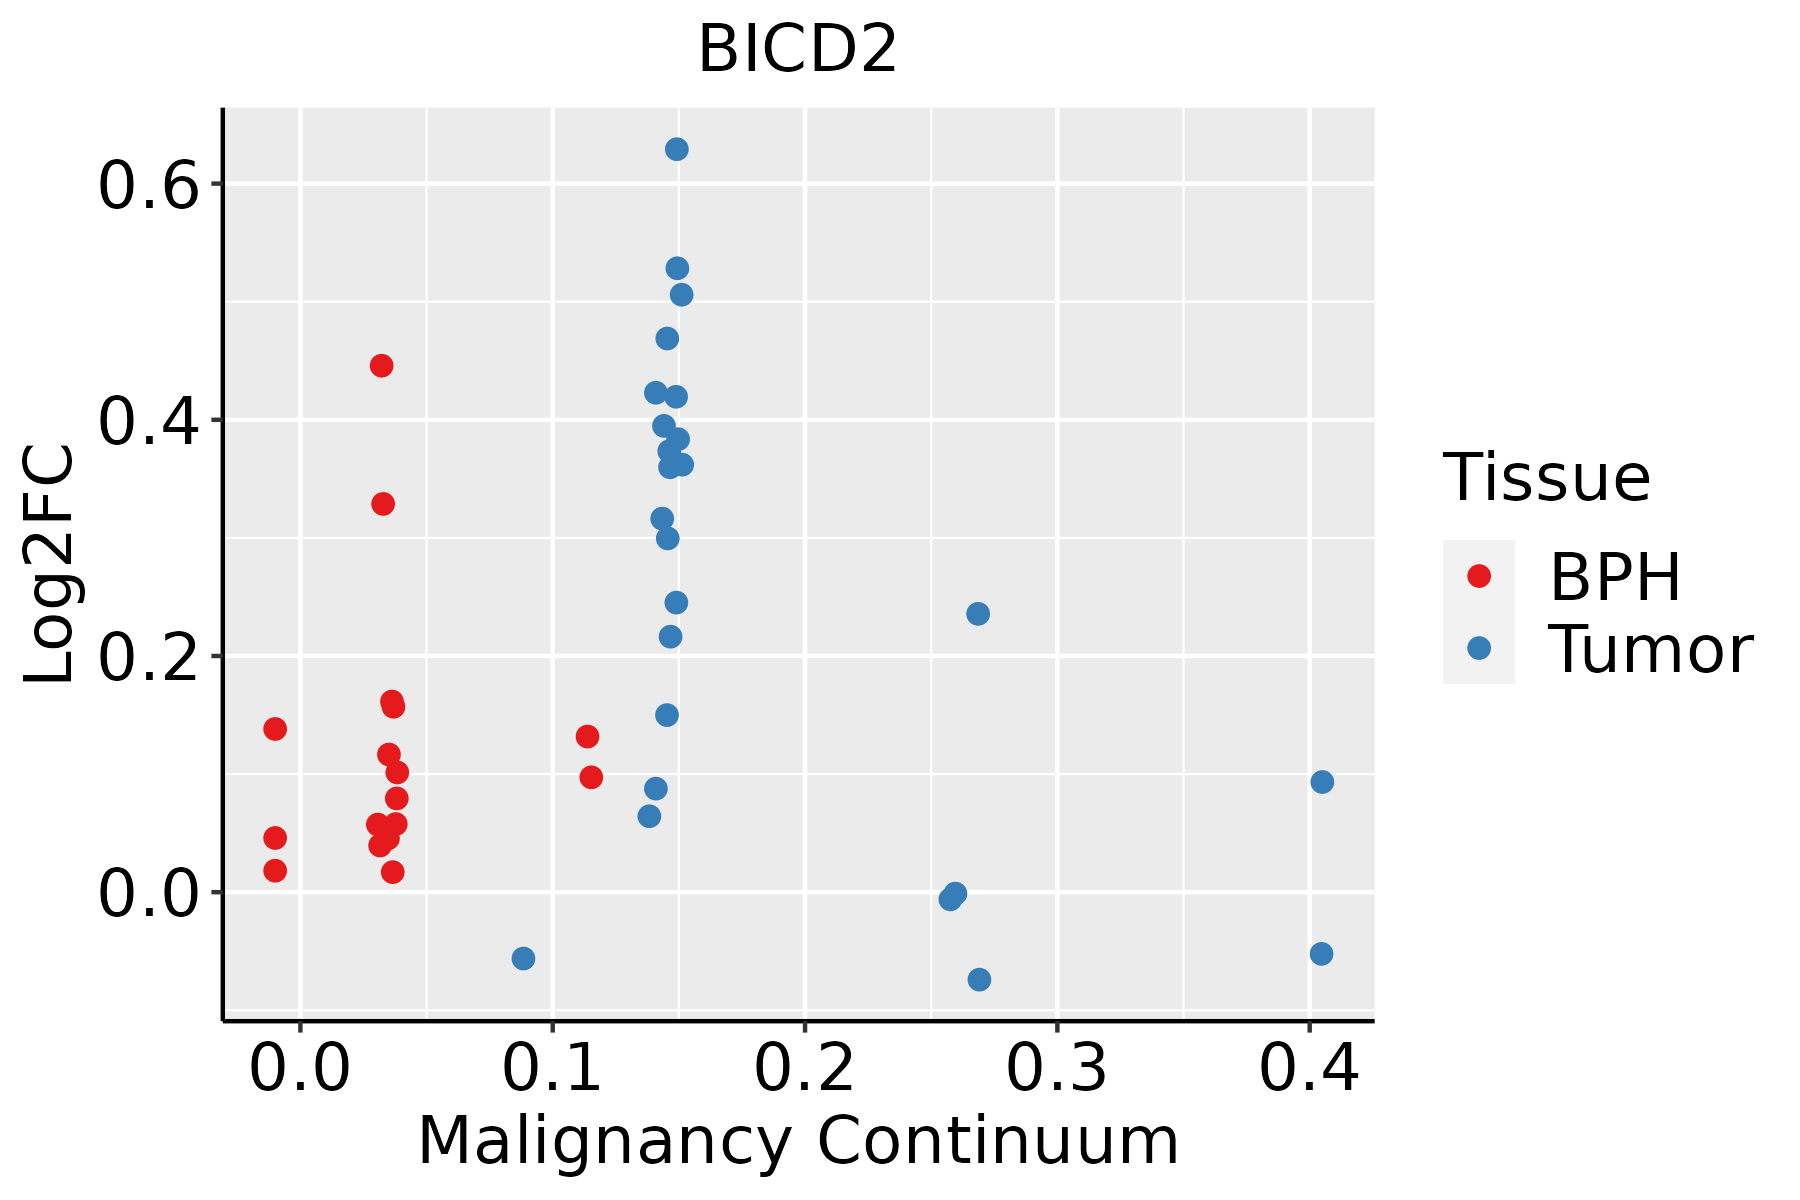 | BPH: Benign Prostatic Hyperplasia |
| Skin |  | AK: Actinic keratosis |
| cSCC: Cutaneous squamous cell carcinoma | ||
| SCCIS:squamous cell carcinoma in situ | ||
| Thyroid | 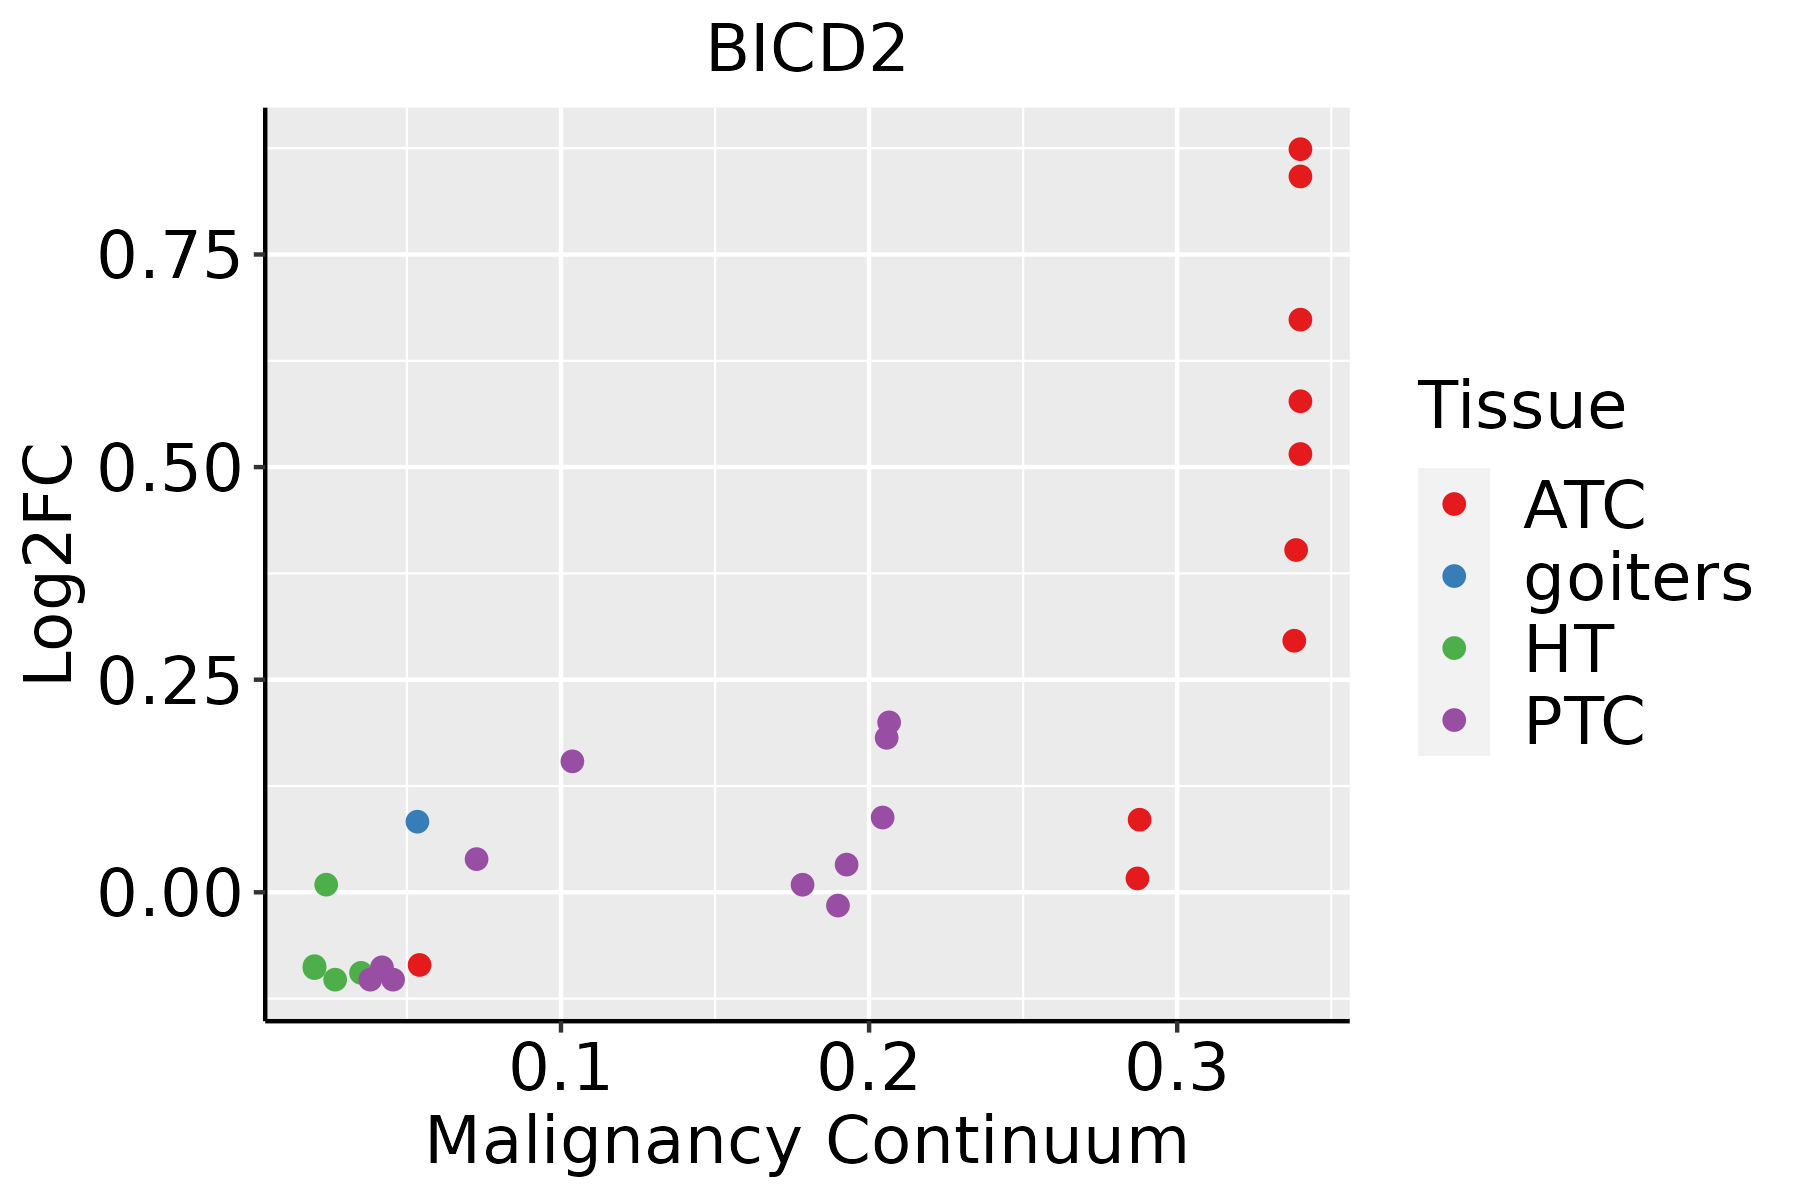 | ATC: Anaplastic thyroid cancer |
| HT: Hashimoto's thyroiditis | ||
| PTC: Papillary thyroid cancer |
| ∗log2FC in expression of this searched gene in stem-like cells from each diseased tissue sample relative to stem-like cells in normal samples in each tissue plotted against the malignancy continuum. Samples are colored based on if they are from different disease stage. |
Top |
Malignant transformation related pathway analysis |
| Find out the enriched GO biological processes and KEGG pathways involved in transition from healthy to precancer to cancer |
| Tissue | Disease Stage | Enriched GO biological Processes |
| Colorectum | AD |  |
| Colorectum | SER |  |
| Colorectum | MSS |  |
| Colorectum | MSI-H |  |
| Colorectum | FAP |  |
| ∗Top 15 enriched GO BP terms are showed in the bar plot of each disease state in each tissue. Each row represents a significant GO biological process which is colored according to the -log10(p.adjust). |
| Page: 1 2 3 4 5 6 7 8 9 |
| GO ID | Tissue | Disease Stage | Description | Gene Ratio | Bg Ratio | pvalue | p.adjust | Count |
| GO:001097014 | Skin | cSCC | transport along microtubule | 58/4864 | 155/18723 | 1.09e-03 | 7.24e-03 | 58 |
| GO:003288612 | Skin | cSCC | regulation of microtubule-based process | 82/4864 | 240/18723 | 2.82e-03 | 1.58e-02 | 82 |
| GO:00723847 | Skin | cSCC | organelle transport along microtubule | 34/4864 | 85/18723 | 3.22e-03 | 1.76e-02 | 34 |
| GO:004819320 | Thyroid | PTC | Golgi vesicle transport | 186/5968 | 296/18723 | 3.09e-28 | 1.22e-25 | 186 |
| GO:0006403112 | Thyroid | PTC | RNA localization | 130/5968 | 201/18723 | 9.23e-22 | 1.94e-19 | 130 |
| GO:0051236110 | Thyroid | PTC | establishment of RNA localization | 100/5968 | 166/18723 | 4.26e-14 | 2.58e-12 | 100 |
| GO:0050657110 | Thyroid | PTC | nucleic acid transport | 98/5968 | 163/18723 | 9.08e-14 | 4.90e-12 | 98 |
| GO:0050658110 | Thyroid | PTC | RNA transport | 98/5968 | 163/18723 | 9.08e-14 | 4.90e-12 | 98 |
| GO:005165620 | Thyroid | PTC | establishment of organelle localization | 193/5968 | 390/18723 | 2.21e-13 | 1.15e-11 | 193 |
| GO:0015931110 | Thyroid | PTC | nucleobase-containing compound transport | 120/5968 | 222/18723 | 5.45e-12 | 2.35e-10 | 120 |
| GO:005102817 | Thyroid | PTC | mRNA transport | 78/5968 | 130/18723 | 3.44e-11 | 1.26e-09 | 78 |
| GO:0030705111 | Thyroid | PTC | cytoskeleton-dependent intracellular transport | 104/5968 | 195/18723 | 3.87e-10 | 1.24e-08 | 104 |
| GO:000689019 | Thyroid | PTC | retrograde vesicle-mediated transport, Golgi to endoplasmic reticulum | 37/5968 | 52/18723 | 6.98e-09 | 1.75e-07 | 37 |
| GO:007050717 | Thyroid | PTC | regulation of microtubule cytoskeleton organization | 80/5968 | 148/18723 | 1.79e-08 | 4.19e-07 | 80 |
| GO:00109709 | Thyroid | PTC | transport along microtubule | 80/5968 | 155/18723 | 2.48e-07 | 4.32e-06 | 80 |
| GO:00723848 | Thyroid | PTC | organelle transport along microtubule | 47/5968 | 85/18723 | 6.61e-06 | 7.83e-05 | 47 |
| GO:00991115 | Thyroid | PTC | microtubule-based transport | 88/5968 | 190/18723 | 2.08e-05 | 2.08e-04 | 88 |
| GO:00340677 | Thyroid | PTC | protein localization to Golgi apparatus | 20/5968 | 29/18723 | 4.54e-05 | 4.09e-04 | 20 |
| GO:00328866 | Thyroid | PTC | regulation of microtubule-based process | 105/5968 | 240/18723 | 6.91e-05 | 6.03e-04 | 105 |
| GO:006184210 | Thyroid | PTC | microtubule organizing center localization | 20/5968 | 33/18723 | 6.26e-04 | 3.96e-03 | 20 |
| Page: 1 2 3 4 5 6 7 |
| Pathway ID | Tissue | Disease Stage | Description | Gene Ratio | Bg Ratio | pvalue | p.adjust | qvalue | Count |
| hsa032509 | Esophagus | ESCC | Viral life cycle - HIV-1 | 54/4205 | 63/8465 | 2.01e-09 | 2.17e-08 | 1.11e-08 | 54 |
| hsa0325014 | Esophagus | ESCC | Viral life cycle - HIV-1 | 54/4205 | 63/8465 | 2.01e-09 | 2.17e-08 | 1.11e-08 | 54 |
| hsa032508 | Oral cavity | OSCC | Viral life cycle - HIV-1 | 45/3704 | 63/8465 | 7.62e-06 | 3.59e-05 | 1.83e-05 | 45 |
| hsa0325013 | Oral cavity | OSCC | Viral life cycle - HIV-1 | 45/3704 | 63/8465 | 7.62e-06 | 3.59e-05 | 1.83e-05 | 45 |
| hsa0325022 | Oral cavity | LP | Viral life cycle - HIV-1 | 32/2418 | 63/8465 | 1.55e-04 | 9.08e-04 | 5.86e-04 | 32 |
| hsa0325031 | Oral cavity | LP | Viral life cycle - HIV-1 | 32/2418 | 63/8465 | 1.55e-04 | 9.08e-04 | 5.86e-04 | 32 |
| hsa032504 | Prostate | BPH | Viral life cycle - HIV-1 | 24/1718 | 63/8465 | 8.32e-04 | 3.98e-03 | 2.46e-03 | 24 |
| hsa0325012 | Prostate | BPH | Viral life cycle - HIV-1 | 24/1718 | 63/8465 | 8.32e-04 | 3.98e-03 | 2.46e-03 | 24 |
| hsa0325021 | Prostate | Tumor | Viral life cycle - HIV-1 | 25/1791 | 63/8465 | 6.13e-04 | 3.07e-03 | 1.91e-03 | 25 |
| hsa032503 | Prostate | Tumor | Viral life cycle - HIV-1 | 25/1791 | 63/8465 | 6.13e-04 | 3.07e-03 | 1.91e-03 | 25 |
| Page: 1 |
Top |
Cell-cell communication analysis |
| Identification of potential cell-cell interactions between two cell types and their ligand-receptor pairs for different disease states |
| Ligand | Receptor | LRpair | Pathway | Tissue | Disease Stage |
| Page: 1 |
Top |
Single-cell gene regulatory network inference analysis |
| Find out the significant the regulons (TFs) and the target genes of each regulon across cell types for different disease states |
| TF | Cell Type | Tissue | Disease Stage | Target Gene | RSS | Regulon Activity |
| ∗The dot plots of a searched regulon are shown for all cell subpopulations in each disease state of each tissue based on the regulon specific score inferred using pySCENIC and by calculating the average expression. |
| Page: 1 |
Top |
Somatic mutation of malignant transformation related genes |
| Annotation of somatic variants for genes involved in malignant transformation |
| Hugo Symbol | Variant Class | Variant Classification | dbSNP RS | HGVSc | HGVSp | HGVSp Short | SWISSPROT | BIOTYPE | SIFT | PolyPhen | Tumor Sample Barcode | Tissue | Histology | Sex | Age | Stage | Therapy Types | Drugs | Outcome |
| BICD2 | SNV | Missense_Mutation | rs201997144 | c.1348C>T | p.Arg450Cys | p.R450C | Q8TD16 | protein_coding | deleterious(0) | possibly_damaging(0.891) | TCGA-DR-A0ZM-01 | Cervix | cervical & endocervical cancer | Female | <65 | III/IV | Unspecific | Cisplatin | SD |
| BICD2 | SNV | Missense_Mutation | rs765563734 | c.1489G>A | p.Glu497Lys | p.E497K | Q8TD16 | protein_coding | deleterious(0.01) | benign(0.401) | TCGA-DS-A5RQ-01 | Cervix | cervical & endocervical cancer | Female | >=65 | I/II | Chemotherapy | cisplatin | CR |
| BICD2 | SNV | Missense_Mutation | c.2407N>G | p.His803Asp | p.H803D | Q8TD16 | protein_coding | deleterious(0.04) | benign(0.356) | TCGA-EA-A411-01 | Cervix | cervical & endocervical cancer | Female | <65 | I/II | Unknown | Unknown | SD | |
| BICD2 | SNV | Missense_Mutation | c.2354N>T | p.Ala785Val | p.A785V | Q8TD16 | protein_coding | deleterious(0) | probably_damaging(0.997) | TCGA-Q1-A5R2-01 | Cervix | cervical & endocervical cancer | Female | <65 | I/II | Chemotherapy | cisplatin | PR | |
| BICD2 | SNV | Missense_Mutation | rs776528966 | c.1733N>A | p.Arg578His | p.R578H | Q8TD16 | protein_coding | tolerated(0.08) | benign(0.01) | TCGA-5M-AAT6-01 | Colorectum | colon adenocarcinoma | Female | <65 | III/IV | Unknown | Unknown | PD |
| BICD2 | SNV | Missense_Mutation | c.2384G>A | p.Arg795Gln | p.R795Q | Q8TD16 | protein_coding | deleterious(0.02) | probably_damaging(0.996) | TCGA-A6-A565-01 | Colorectum | colon adenocarcinoma | Female | <65 | III/IV | Unspecific | 5FU | PD | |
| BICD2 | SNV | Missense_Mutation | novel | c.844N>C | p.Gly282Arg | p.G282R | Q8TD16 | protein_coding | deleterious(0.01) | probably_damaging(0.956) | TCGA-AA-3930-01 | Colorectum | colon adenocarcinoma | Male | >=65 | III/IV | Chemotherapy | capecitabine | PD |
| BICD2 | SNV | Missense_Mutation | c.2510N>C | p.Gly837Ala | p.G837A | Q8TD16 | protein_coding | tolerated_low_confidence(0.26) | benign(0.001) | TCGA-AA-3955-01 | Colorectum | colon adenocarcinoma | Male | <65 | III/IV | Chemotherapy | capecitabine | CR | |
| BICD2 | SNV | Missense_Mutation | c.1531G>A | p.Asp511Asn | p.D511N | Q8TD16 | protein_coding | tolerated(0.36) | possibly_damaging(0.561) | TCGA-AA-A00N-01 | Colorectum | colon adenocarcinoma | Male | >=65 | I/II | Unknown | Unknown | PD | |
| BICD2 | SNV | Missense_Mutation | rs761506224 | c.485G>A | p.Arg162His | p.R162H | Q8TD16 | protein_coding | tolerated(0.25) | possibly_damaging(0.814) | TCGA-AA-A00N-01 | Colorectum | colon adenocarcinoma | Male | >=65 | I/II | Unknown | Unknown | PD |
| Page: 1 2 3 4 5 6 7 8 9 |
Top |
Related drugs of malignant transformation related genes |
| Identification of chemicals and drugs interact with genes involved in malignant transfromation |
| (DGIdb 4.0) |
| Entrez ID | Symbol | Category | Interaction Types | Drug Claim Name | Drug Name | PMIDs |
| Page: 1 |

Copyright 2023-Present -The University of Texas Health Science Center at Houston |