Schematic overview of the cellular and molecular mechanisms involved in the cancer progression, including the proposed cellular and molecular mechanisms in cancer cells trajectory. AT1: alveolar type 1 cells; AT2: alveolar type 2 cells; AAH: atypical adenomatous hyperplasia; AIS: adenocarcinoma in situ; MIA: minimally invasive adenocarcinoma; IA: invasive adenocarcinoma; EMT: epithelial-mesenchymal transition

Home

Download

Statistics

Help

Contact

Center for Computational Systems Medicine
leaf

Gene summary

leaf

Malignant transformation analysis

leaf

Malignant transformation related pathway analysis

leaf

Cell-cell communication analysis

leaf

Single-cell gene regulatory network inference analysis

leaf

Somatic mutation of malignant transformation related genes

leaf

Related drugs of malignant transformation related genes

Gene: BCAR3

Gene summary for BCAR3

check button Gene summary.

Gene informationSpeciesHuman
Gene symbol

BCAR3

Gene ID

8412

Gene nameBCAR3 adaptor protein, NSP family member
Gene AliasAND-34
Cytomap1p22.1
Gene Typeprotein-coding
GO ID

GO:0000165

UniProtAcc

O75815


Top

Malignant transformation analysis

check button Identification of the aberrant gene expression in precancerous and cancerous lesions by comparing the gene expression of stem-like cells in diseased tissues with normal stem cells
check button Malignant transformation involving gene list.
Entrez IDSymbolReplicatesSpeciesOrganTissueAdj P-valueLog2FCMalignancy
8412BCAR3CCI_1HumanCervixCC2.23e-088.22e-010.528
8412BCAR3CCI_3HumanCervixCC7.33e-126.34e-010.516
8412BCAR3sample3HumanCervixCC4.86e-031.76e-010.1387
8412BCAR3T3HumanCervixCC2.44e-041.43e-010.1389
8412BCAR3HTA11_347_2000001011HumanColorectumAD3.29e-094.29e-01-0.1954
8412BCAR3HTA11_866_2000001011HumanColorectumAD9.77e-072.10e-01-0.1001
8412BCAR3HTA11_7696_3000711011HumanColorectumAD1.95e-031.28e-010.0674
8412BCAR3A015-C-203HumanColorectumFAP4.02e-03-1.39e-01-0.1294
8412BCAR3A002-C-205HumanColorectumFAP2.60e-05-2.11e-01-0.1236
8412BCAR3A015-C-006HumanColorectumFAP2.04e-03-2.17e-01-0.0994
8412BCAR3A002-C-114HumanColorectumFAP4.02e-03-1.95e-01-0.1561
8412BCAR3A015-C-104HumanColorectumFAP1.71e-04-1.58e-01-0.1899
8412BCAR3A015-C-002HumanColorectumFAP1.47e-03-2.77e-01-0.0763
8412BCAR3A002-C-116HumanColorectumFAP6.23e-04-2.16e-01-0.0452
8412BCAR3A014-C-008HumanColorectumFAP3.74e-02-1.94e-01-0.191
8412BCAR3A018-E-020HumanColorectumFAP1.54e-04-2.13e-01-0.2034
8412BCAR3CRC-3-11773HumanColorectumCRC1.35e-02-2.17e-010.2564
8412BCAR3LZE24THumanEsophagusESCC2.90e-031.96e-010.0596
8412BCAR3LZE6THumanEsophagusESCC9.20e-036.31e-010.0845
8412BCAR3P2T-EHumanEsophagusESCC1.50e-101.58e-010.1177
Page: 1 2 3 4 

check button Transcriptomic changes along malignancy continuum.
TissueExpression DynamicsAbbreviation
CervixThe image shows the transcriptomic changes along malignancy continuum.log2FC in expression of this searched gene in stem-like cells from each diseased tissue sample relative to stem-like cells in normal samples in each tissue plotted against the malignancy continuum. Samples are colored based on if they are from different disease stage.CC: Cervix cancer
HSIL_HPV: HPV-infected high-grade squamous intraepithelial lesions
N_HPV: HPV-infected normal cervix
Colorectum (GSE201348)The image shows the transcriptomic changes along malignancy continuum.log2FC in expression of this searched gene in stem-like cells from each diseased tissue sample relative to stem-like cells in normal samples in each tissue plotted against the malignancy continuum. Samples are colored based on if they are from different disease stage.FAP: Familial adenomatous polyposis
CRC: Colorectal cancer
Colorectum (HTA11)The image shows the transcriptomic changes along malignancy continuum.log2FC in expression of this searched gene in stem-like cells from each diseased tissue sample relative to stem-like cells in normal samples in each tissue plotted against the malignancy continuum. Samples are colored based on if they are from different disease stage.AD: Adenomas
SER: Sessile serrated lesions
MSI-H: Microsatellite-high colorectal cancer
MSS: Microsatellite stable colorectal cancer
EsophagusThe image shows the transcriptomic changes along malignancy continuum.log2FC in expression of this searched gene in stem-like cells from each diseased tissue sample relative to stem-like cells in normal samples in each tissue plotted against the malignancy continuum. Samples are colored based on if they are from different disease stage.
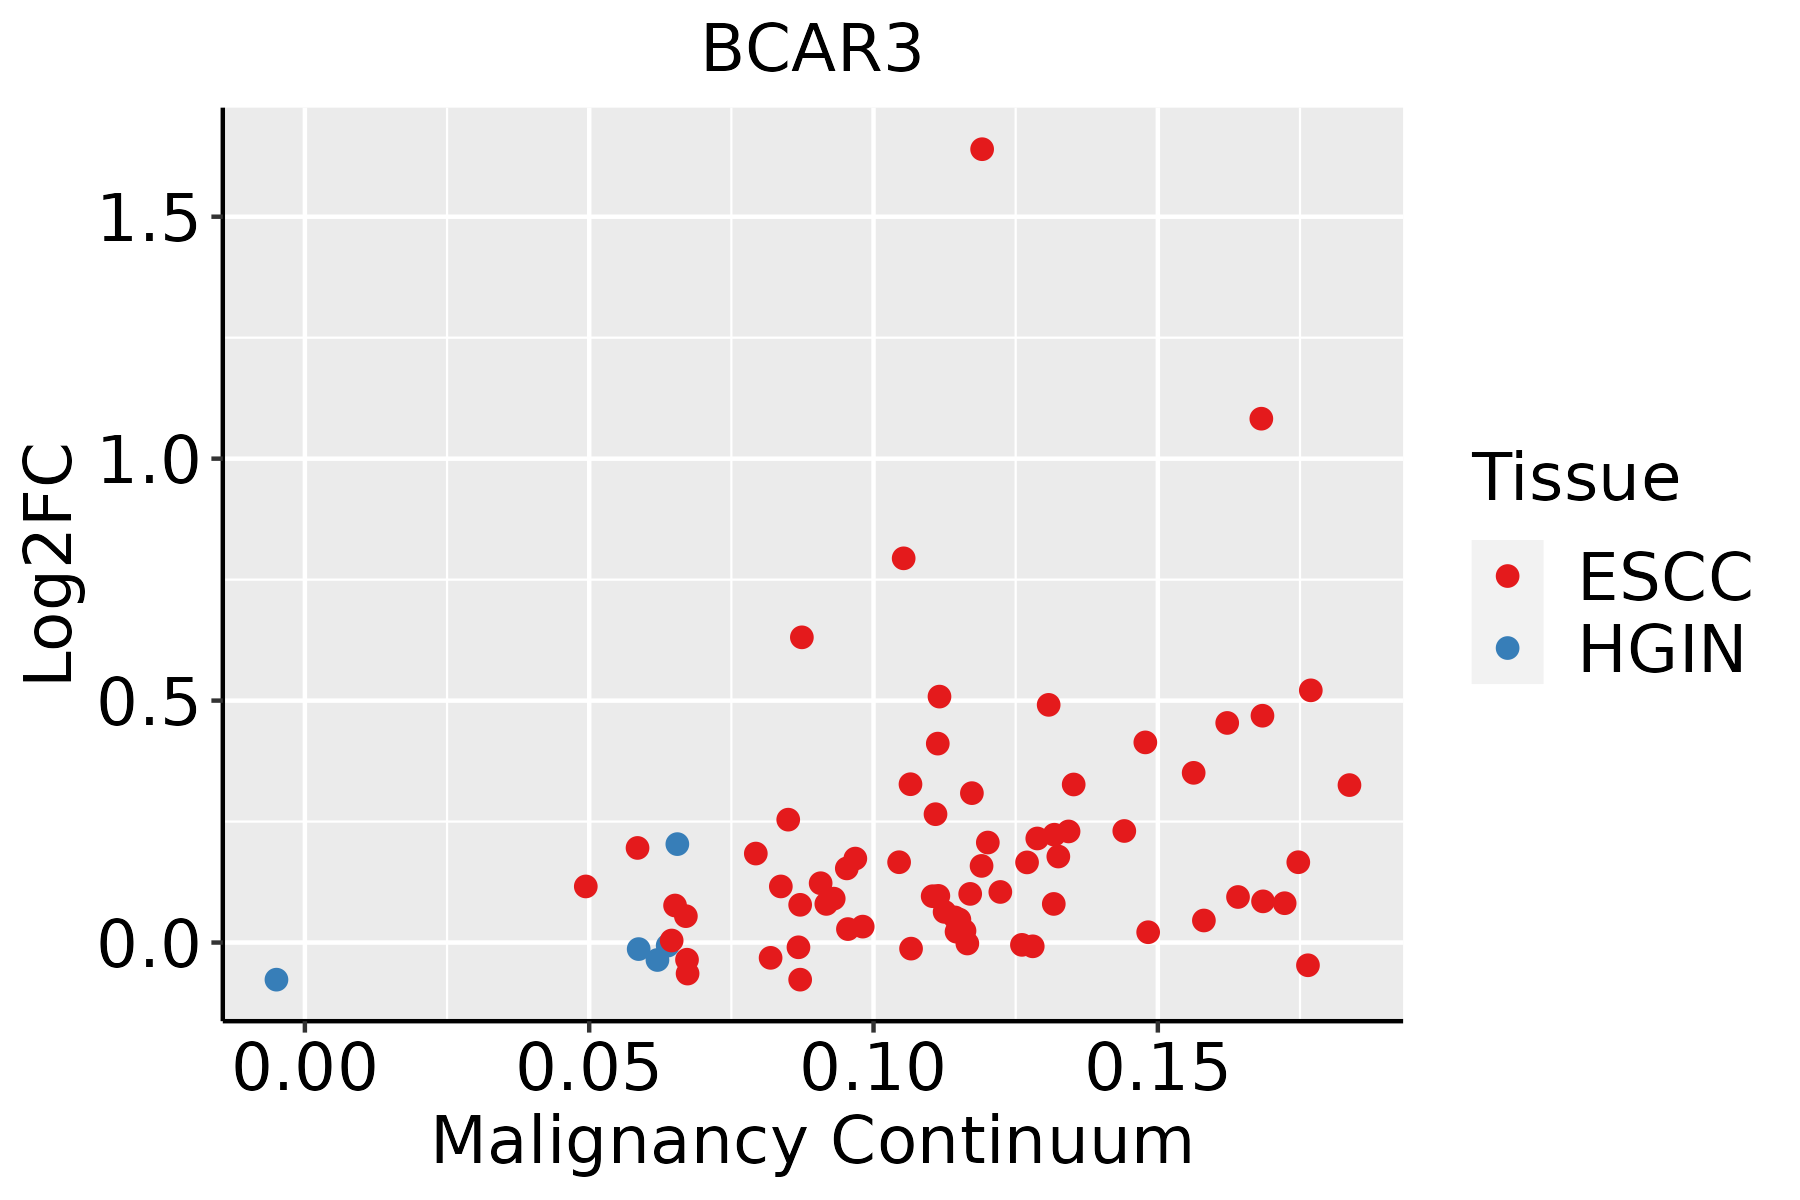
ESCC: Esophageal squamous cell carcinoma
HGIN: High-grade intraepithelial neoplasias
LGIN: Low-grade intraepithelial neoplasias
Oral CavityThe image shows the transcriptomic changes along malignancy continuum.log2FC in expression of this searched gene in stem-like cells from each diseased tissue sample relative to stem-like cells in normal samples in each tissue plotted against the malignancy continuum. Samples are colored based on if they are from different disease stage.
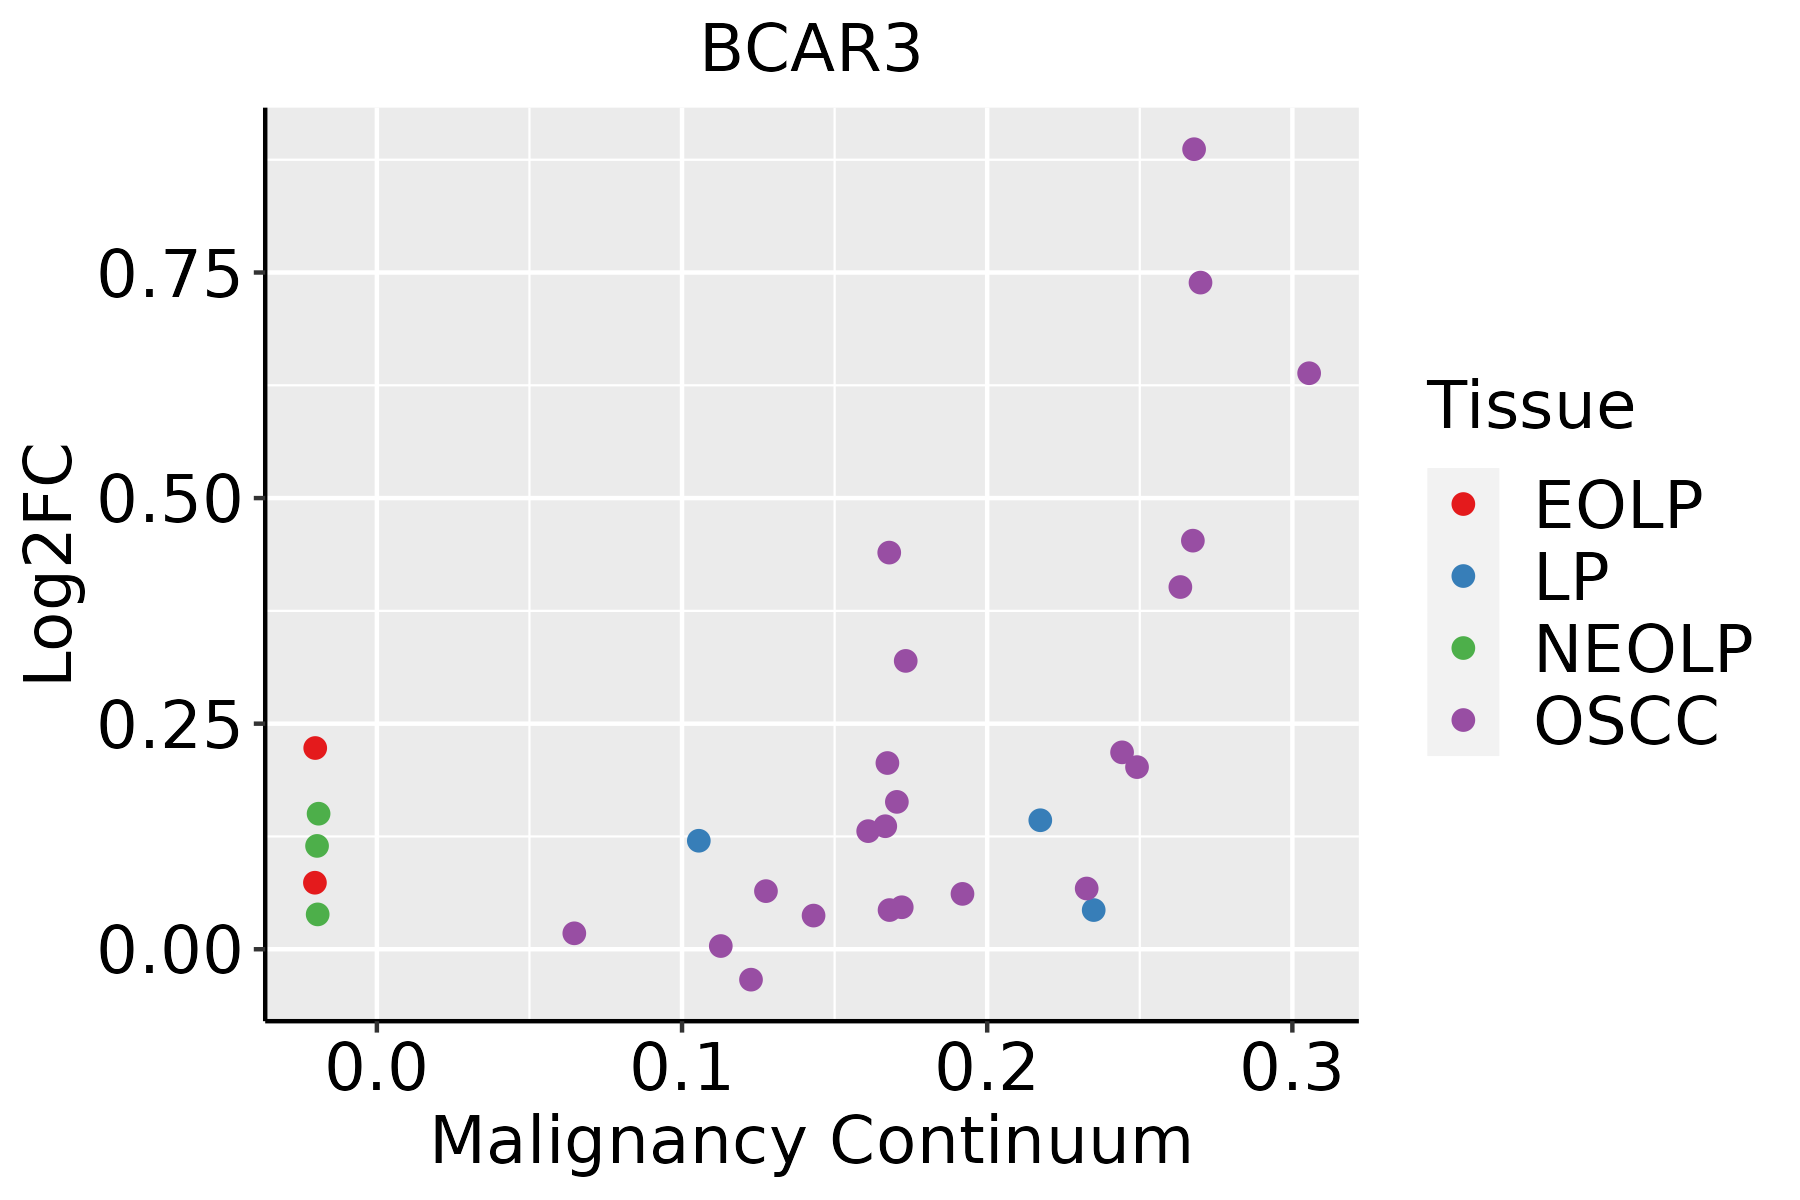
EOLP: Erosive Oral lichen planus
LP: leukoplakia
NEOLP: Non-erosive oral lichen planus
OSCC: Oral squamous cell carcinoma
∗log2FC in expression of this searched gene in stem-like cells from each diseased tissue sample relative to stem-like cells in normal samples in each tissue plotted against the malignancy continuum. Samples are colored based on if they are from different disease stage.

Top

Malignant transformation related pathway analysis

check buttonFind out the enriched GO biological processes and KEGG pathways involved in transition from healthy to precancer to cancer
check button Figure of enriched GO biological processes.
TissueDisease StageEnriched GO biological Processes
ColorectumADGO analysis - Figure of enriched GO biological processes: Top 15 enriched GO BP terms are showed in the bar plot of each disease state in each tissue. Each row represents a significant GO biological process which is colored according to the -log10(p.adjust).
ColorectumSERGO analysis - Figure of enriched GO biological processes: Top 15 enriched GO BP terms are showed in the bar plot of each disease state in each tissue. Each row represents a significant GO biological process which is colored according to the -log10(p.adjust).
ColorectumMSSGO analysis - Figure of enriched GO biological processes: Top 15 enriched GO BP terms are showed in the bar plot of each disease state in each tissue. Each row represents a significant GO biological process which is colored according to the -log10(p.adjust).
ColorectumMSI-HGO analysis - Figure of enriched GO biological processes: Top 15 enriched GO BP terms are showed in the bar plot of each disease state in each tissue. Each row represents a significant GO biological process which is colored according to the -log10(p.adjust).
ColorectumFAPGO analysis - Figure of enriched GO biological processes: Top 15 enriched GO BP terms are showed in the bar plot of each disease state in each tissue. Each row represents a significant GO biological process which is colored according to the -log10(p.adjust).
∗Top 15 enriched GO BP terms are showed in the bar plot of each disease state in each tissue. Each row represents a significant GO biological process which is colored according to the -log10(p.adjust).
Page: 1 2 3 4 5 6 7 8 9 

check button Enriched GO biological processes.
GO IDTissueDisease StageDescriptionGene RatioBg Ratiopvaluep.adjustCount
GO:001810510Oral cavityOSCCpeptidyl-serine phosphorylation164/7305315/187231.51e-061.99e-05164
GO:004343419Oral cavityOSCCresponse to peptide hormone208/7305414/187231.83e-062.35e-05208
GO:003286816Oral cavityOSCCresponse to insulin138/7305264/187237.54e-068.15e-05138
GO:19011847Oral cavityOSCCregulation of ERBB signaling pathway50/730579/187231.06e-051.12e-0450
GO:00420587Oral cavityOSCCregulation of epidermal growth factor receptor signaling pathway46/730573/187232.80e-052.59e-0446
GO:00082868Oral cavityOSCCinsulin receptor signaling pathway67/7305116/187233.23e-052.91e-0467
GO:000941018Oral cavityOSCCresponse to xenobiotic stimulus222/7305462/187234.00e-053.48e-04222
GO:00062753Oral cavityOSCCregulation of DNA replication62/7305107/187235.49e-054.54e-0462
GO:004308710Oral cavityOSCCregulation of GTPase activity165/7305348/187237.94e-044.27e-03165
GO:00331354Oral cavityOSCCregulation of peptidyl-serine phosphorylation72/7305144/187234.66e-031.87e-0272
GO:0033138Oral cavityOSCCpositive regulation of peptidyl-serine phosphorylation55/7305108/187237.75e-032.84e-0255
GO:00434107Oral cavityOSCCpositive regulation of MAPK cascade213/7305480/187238.71e-033.16e-02213
GO:00457405Oral cavityOSCCpositive regulation of DNA replication23/730540/187231.36e-024.50e-0223
GO:001810514Oral cavityEOLPpeptidyl-serine phosphorylation84/2218315/187233.32e-131.05e-1084
GO:001820914Oral cavityEOLPpeptidyl-serine modification87/2218338/187231.07e-122.46e-1087
GO:190165323Oral cavityEOLPcellular response to peptide85/2218359/187232.06e-102.06e-0885
GO:004343424Oral cavityEOLPresponse to peptide hormone89/2218414/187231.29e-086.11e-0789
GO:003286922Oral cavityEOLPcellular response to insulin stimulus53/2218203/187231.65e-087.43e-0753
GO:007137523Oral cavityEOLPcellular response to peptide hormone stimulus68/2218290/187231.98e-088.62e-0768
GO:003286823Oral cavityEOLPresponse to insulin62/2218264/187237.78e-082.76e-0662
Page: 1 2 3 4 5 6 7 

check button Enriched KEGG pathways.
Pathway IDTissueDisease StageDescriptionGene RatioBg Ratiopvaluep.adjustqvalueCount
Page: 1 

Top

Cell-cell communication analysis

check buttonIdentification of potential cell-cell interactions between two cell types and their ligand-receptor pairs for different disease states
LigandReceptorLRpairPathwayTissueDisease Stage
Page: 1 

Top

Single-cell gene regulatory network inference analysis

check buttonFind out the significant the regulons (TFs) and the target genes of each regulon across cell types for different disease states
TFCell TypeTissueDisease StageTarget GeneRSSRegulon Activity
∗The dot plots of a searched regulon are shown for all cell subpopulations in each disease state of each tissue based on the regulon specific score inferred using pySCENIC and by calculating the average expression.
Page: 1 

Top

Somatic mutation of malignant transformation related genes

check buttonAnnotation of somatic variants for genes involved in malignant transformation
Hugo SymbolVariant ClassVariant ClassificationdbSNP RSHGVScHGVSpHGVSp ShortSWISSPROTBIOTYPESIFTPolyPhenTumor Sample BarcodeTissueHistologySexAgeStageTherapy TypesDrugsOutcome
BCAR3SNVMissense_Mutationc.382G>Ap.Asp128Asnp.D128NO75815protein_codingdeleterious(0.01)possibly_damaging(0.881)TCGA-A2-A0CP-01Breastbreast invasive carcinomaFemale<65I/IIChemotherapycytoxanSD
BCAR3SNVMissense_Mutationc.538C>Ap.Leu180Metp.L180MO75815protein_codingdeleterious(0)probably_damaging(0.992)TCGA-A2-A0D2-01Breastbreast invasive carcinomaFemale<65I/IIChemotherapyadriamycinSD
BCAR3SNVMissense_Mutationc.13N>Cp.Lys5Glnp.K5QO75815protein_codingdeleterious_low_confidence(0)possibly_damaging(0.82)TCGA-A8-A06Z-01Breastbreast invasive carcinomaFemale>=65I/IIUnknownUnknownSD
BCAR3SNVMissense_Mutationc.1987G>Ap.Glu663Lysp.E663KO75815protein_codingdeleterious(0)possibly_damaging(0.714)TCGA-AC-A23H-01Breastbreast invasive carcinomaFemale>=65I/IIUnknownUnknownPD
BCAR3SNVMissense_Mutationnovelc.587N>Gp.Ala196Glyp.A196GO75815protein_codingtolerated(0.1)benign(0.297)TCGA-AR-A5QQ-01Breastbreast invasive carcinomaFemale>=65III/IVChemotherapycarboplatinPD
BCAR3SNVMissense_Mutationc.1428G>Cp.Leu476Phep.L476FO75815protein_codingdeleterious(0.03)benign(0.116)TCGA-BH-A1F0-01Breastbreast invasive carcinomaFemale>=65I/IIUnknownUnknownPD
BCAR3SNVMissense_Mutationnovelc.193G>Ap.Asp65Asnp.D65NO75815protein_codingtolerated(0.09)benign(0.439)TCGA-D8-A3Z5-01Breastbreast invasive carcinomaFemale<65III/IVUnknownUnknownSD
BCAR3SNVMissense_Mutationnovelc.1246N>Tp.Pro416Serp.P416SO75815protein_codingtolerated(0.16)benign(0.012)TCGA-LD-A74U-01Breastbreast invasive carcinomaFemale>=65III/IVChemotherapytaxotereSD
BCAR3insertionFrame_Shift_Insnovelc.1975_1976insAGTGCCCTGTTTCTCCTTGTGTGp.Ile659LysfsTer12p.I659Kfs*12O75815protein_codingTCGA-B6-A0RE-01Breastbreast invasive carcinomaFemale<65I/IIUnknownUnknownSD
BCAR3deletionFrame_Shift_Delnovelc.409delGp.Glu137SerfsTer8p.E137Sfs*8O75815protein_codingTCGA-D8-A27V-01Breastbreast invasive carcinomaFemale<65I/IIHormone TherapytamoxiphenSD
Page: 1 2 3 4 5 6 7 8 

Top

Related drugs of malignant transformation related genes

check buttonIdentification of chemicals and drugs interact with genes involved in malignant transfromation
(DGIdb 4.0)
Entrez IDSymbolCategoryInteraction TypesDrug Claim NameDrug NamePMIDs
8412BCAR3KINASEANTIESTROGEN9582273
Page: 1