
|
|||||
|
 | |
| |
| |
| |
| |
| |
|
Gene: BAMBI |
Gene summary for BAMBI |
| Gene information | Species | Human | Gene symbol | BAMBI | Gene ID | 25805 |
| Gene name | BMP and activin membrane bound inhibitor | |
| Gene Alias | NMA | |
| Cytomap | 10p12.1 | |
| Gene Type | protein-coding | GO ID | GO:0000902 | UniProtAcc | Q13145 |
Top |
Malignant transformation analysis |
| Identification of the aberrant gene expression in precancerous and cancerous lesions by comparing the gene expression of stem-like cells in diseased tissues with normal stem cells |
| Entrez ID | Symbol | Replicates | Species | Organ | Tissue | Adj P-value | Log2FC | Malignancy |
| 25805 | BAMBI | LZE5T | Human | Esophagus | ESCC | 2.82e-02 | 4.18e-01 | 0.0514 |
| 25805 | BAMBI | LZE7T | Human | Esophagus | ESCC | 2.87e-08 | 4.91e-01 | 0.0667 |
| 25805 | BAMBI | LZE22D1 | Human | Esophagus | HGIN | 2.63e-02 | 2.01e-01 | 0.0595 |
| 25805 | BAMBI | LZE22T | Human | Esophagus | ESCC | 4.69e-06 | 9.95e-01 | 0.068 |
| 25805 | BAMBI | LZE24T | Human | Esophagus | ESCC | 1.38e-15 | 8.92e-01 | 0.0596 |
| 25805 | BAMBI | LZE21T | Human | Esophagus | ESCC | 1.34e-13 | 1.44e+00 | 0.0655 |
| 25805 | BAMBI | P1T-E | Human | Esophagus | ESCC | 1.19e-19 | 1.43e+00 | 0.0875 |
| 25805 | BAMBI | P2T-E | Human | Esophagus | ESCC | 9.72e-35 | 8.51e-01 | 0.1177 |
| 25805 | BAMBI | P4T-E | Human | Esophagus | ESCC | 3.35e-55 | 2.27e+00 | 0.1323 |
| 25805 | BAMBI | P5T-E | Human | Esophagus | ESCC | 3.46e-64 | 1.82e+00 | 0.1327 |
| 25805 | BAMBI | P8T-E | Human | Esophagus | ESCC | 1.15e-24 | 6.51e-01 | 0.0889 |
| 25805 | BAMBI | P9T-E | Human | Esophagus | ESCC | 9.83e-31 | 1.16e+00 | 0.1131 |
| 25805 | BAMBI | P10T-E | Human | Esophagus | ESCC | 1.32e-14 | 4.77e-01 | 0.116 |
| 25805 | BAMBI | P11T-E | Human | Esophagus | ESCC | 5.35e-14 | 1.04e+00 | 0.1426 |
| 25805 | BAMBI | P12T-E | Human | Esophagus | ESCC | 5.01e-26 | 6.96e-01 | 0.1122 |
| 25805 | BAMBI | P15T-E | Human | Esophagus | ESCC | 8.26e-36 | 1.02e+00 | 0.1149 |
| 25805 | BAMBI | P16T-E | Human | Esophagus | ESCC | 2.20e-79 | 1.90e+00 | 0.1153 |
| 25805 | BAMBI | P22T-E | Human | Esophagus | ESCC | 8.85e-27 | 7.49e-01 | 0.1236 |
| 25805 | BAMBI | P23T-E | Human | Esophagus | ESCC | 2.07e-16 | 8.64e-01 | 0.108 |
| 25805 | BAMBI | P24T-E | Human | Esophagus | ESCC | 2.91e-06 | 3.11e-01 | 0.1287 |
| Page: 1 2 3 4 |
| Tissue | Expression Dynamics | Abbreviation |
| Esophagus | 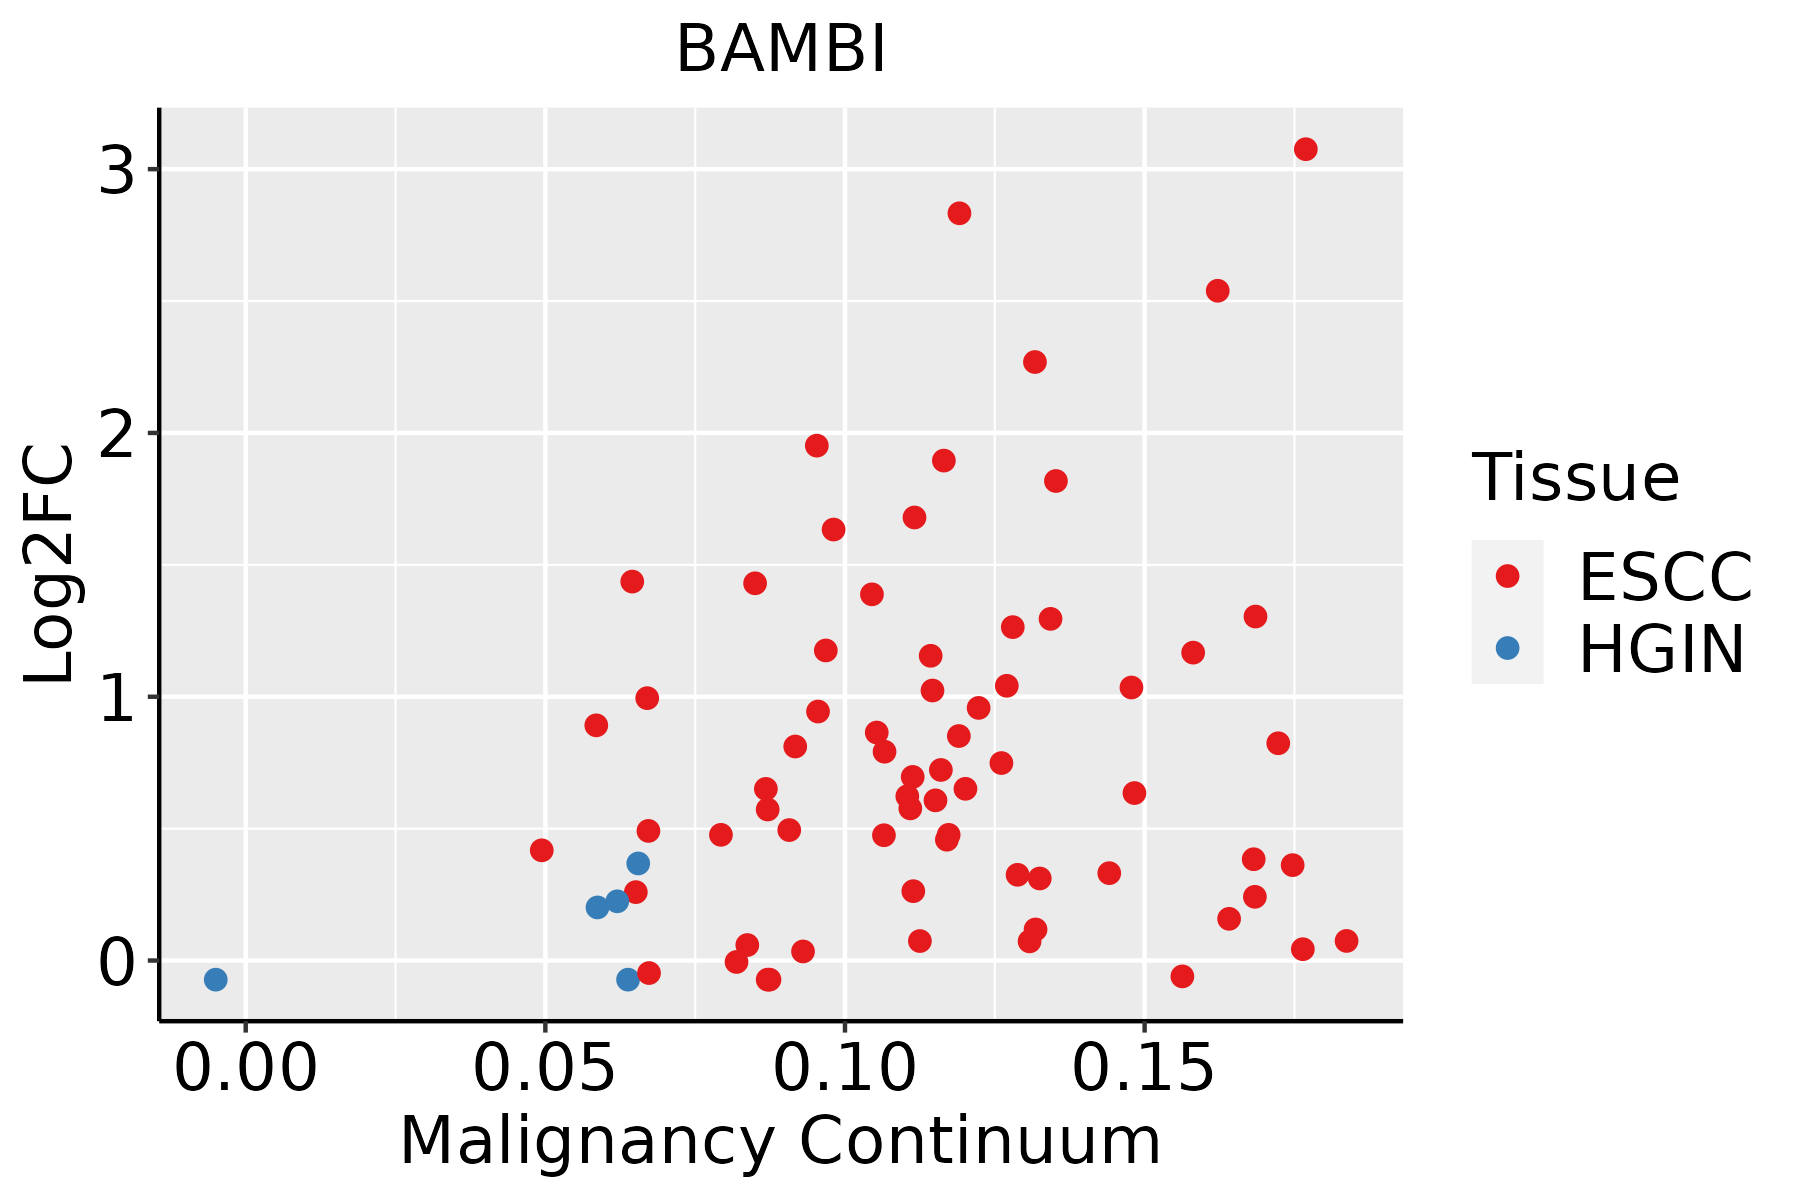 | ESCC: Esophageal squamous cell carcinoma |
| HGIN: High-grade intraepithelial neoplasias | ||
| LGIN: Low-grade intraepithelial neoplasias | ||
| Liver |  | HCC: Hepatocellular carcinoma |
| NAFLD: Non-alcoholic fatty liver disease | ||
| Oral Cavity | 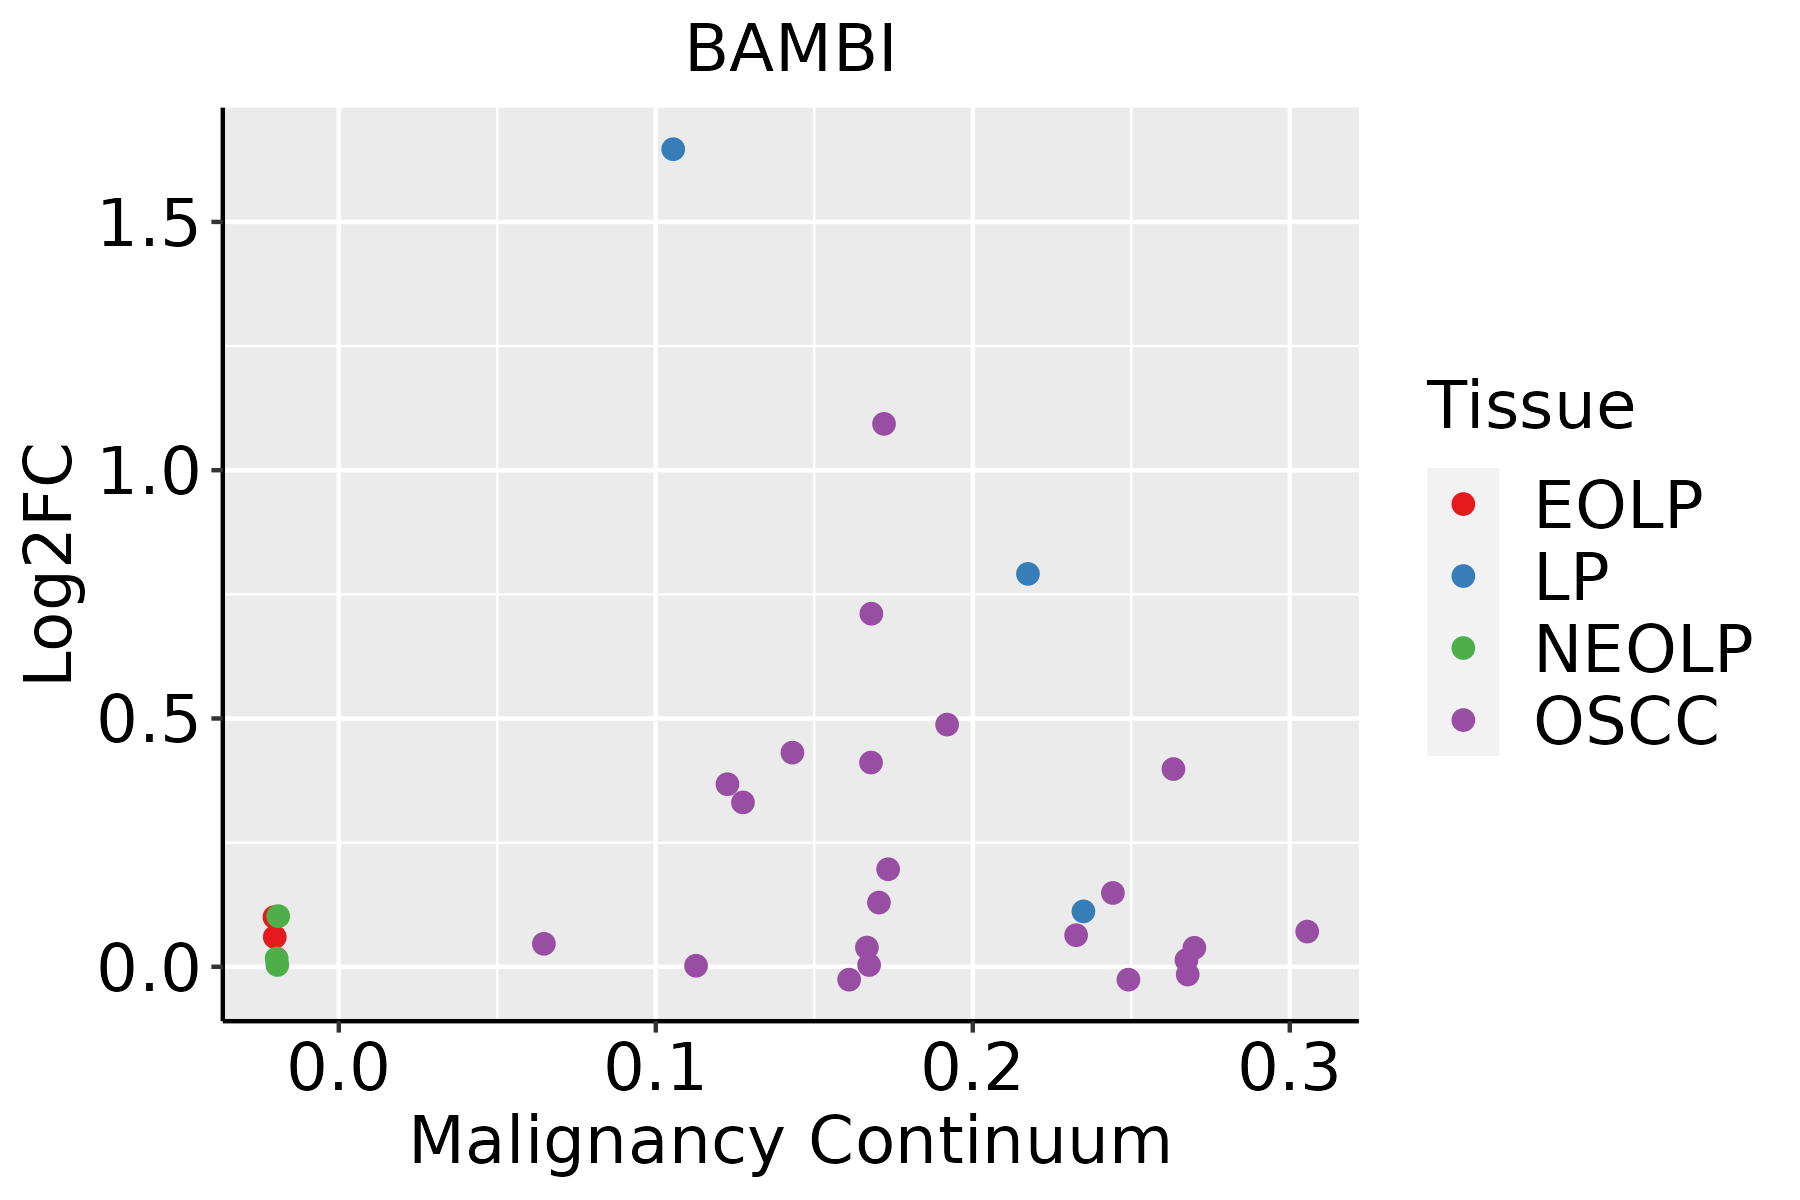 | EOLP: Erosive Oral lichen planus |
| LP: leukoplakia | ||
| NEOLP: Non-erosive oral lichen planus | ||
| OSCC: Oral squamous cell carcinoma | ||
| Prostate | 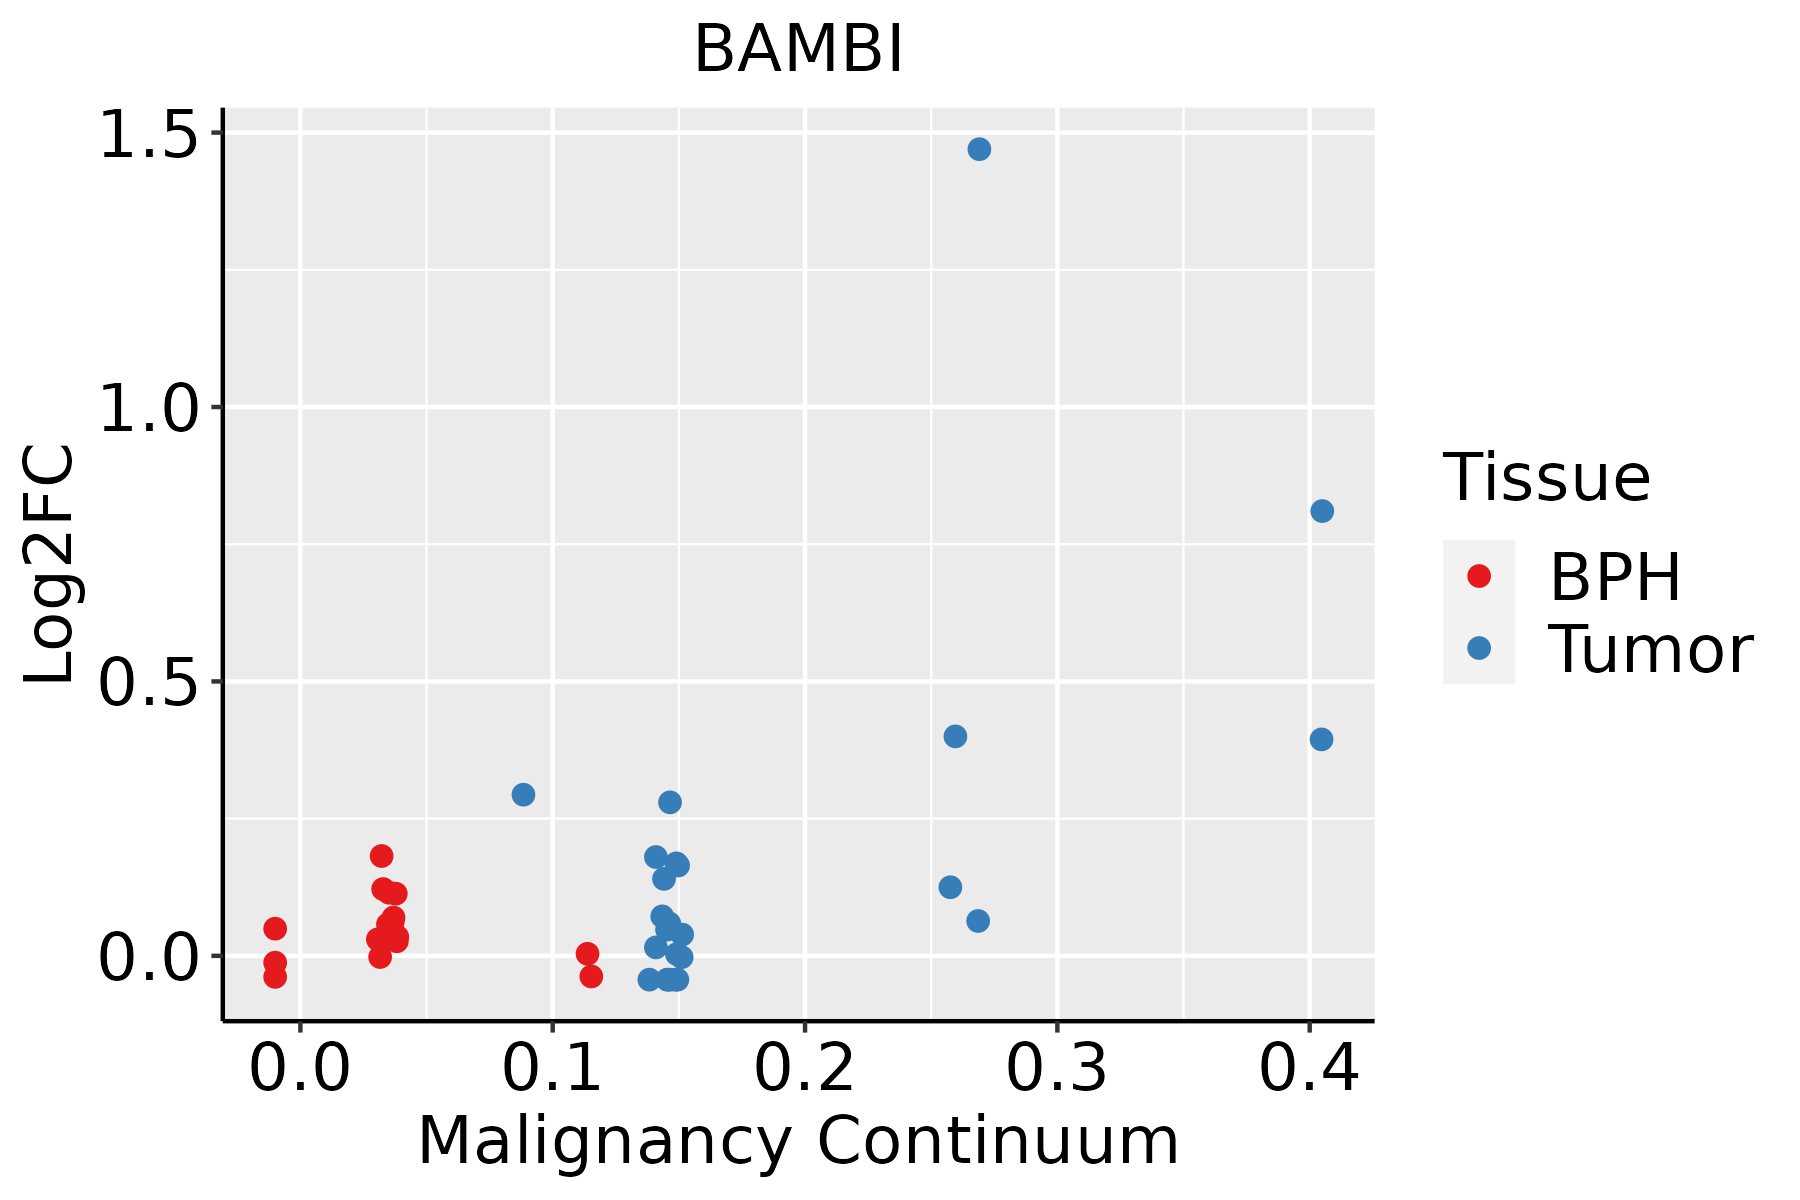 | BPH: Benign Prostatic Hyperplasia |
| ∗log2FC in expression of this searched gene in stem-like cells from each diseased tissue sample relative to stem-like cells in normal samples in each tissue plotted against the malignancy continuum. Samples are colored based on if they are from different disease stage. |
Top |
Malignant transformation related pathway analysis |
| Find out the enriched GO biological processes and KEGG pathways involved in transition from healthy to precancer to cancer |
| Tissue | Disease Stage | Enriched GO biological Processes |
| Colorectum | AD |  |
| Colorectum | SER |  |
| Colorectum | MSS |  |
| Colorectum | MSI-H |  |
| Colorectum | FAP |  |
| ∗Top 15 enriched GO BP terms are showed in the bar plot of each disease state in each tissue. Each row represents a significant GO biological process which is colored according to the -log10(p.adjust). |
| Page: 1 2 3 4 5 6 7 8 9 |
| GO ID | Tissue | Disease Stage | Description | Gene Ratio | Bg Ratio | pvalue | p.adjust | Count |
| GO:00071789 | Oral cavity | OSCC | transmembrane receptor protein serine/threonine kinase signaling pathway | 165/7305 | 355/18723 | 2.31e-03 | 1.02e-02 | 165 |
| GO:00456674 | Oral cavity | OSCC | regulation of osteoblast differentiation | 65/7305 | 132/18723 | 1.06e-02 | 3.60e-02 | 65 |
| GO:00487627 | Oral cavity | OSCC | mesenchymal cell differentiation | 109/7305 | 236/18723 | 1.43e-02 | 4.69e-02 | 109 |
| GO:0051098110 | Oral cavity | LP | regulation of binding | 140/4623 | 363/18723 | 2.47e-09 | 1.10e-07 | 140 |
| GO:004339319 | Oral cavity | LP | regulation of protein binding | 80/4623 | 196/18723 | 4.41e-07 | 1.23e-05 | 80 |
| GO:0051099110 | Oral cavity | LP | positive regulation of binding | 67/4623 | 173/18723 | 2.86e-05 | 4.51e-04 | 67 |
| GO:001605515 | Oral cavity | LP | Wnt signaling pathway | 140/4623 | 444/18723 | 5.80e-04 | 5.35e-03 | 140 |
| GO:003209215 | Oral cavity | LP | positive regulation of protein binding | 35/4623 | 85/18723 | 5.94e-04 | 5.44e-03 | 35 |
| GO:019873815 | Oral cavity | LP | cell-cell signaling by wnt | 140/4623 | 446/18723 | 7.12e-04 | 6.38e-03 | 140 |
| GO:0022604110 | Oral cavity | LP | regulation of cell morphogenesis | 101/4623 | 309/18723 | 8.65e-04 | 7.50e-03 | 101 |
| GO:006082815 | Oral cavity | LP | regulation of canonical Wnt signaling pathway | 82/4623 | 253/18723 | 3.23e-03 | 2.18e-02 | 82 |
| GO:003011115 | Oral cavity | LP | regulation of Wnt signaling pathway | 103/4623 | 328/18723 | 3.29e-03 | 2.21e-02 | 103 |
| GO:000836017 | Oral cavity | LP | regulation of cell shape | 53/4623 | 154/18723 | 4.22e-03 | 2.70e-02 | 53 |
| GO:000150315 | Oral cavity | LP | ossification | 123/4623 | 408/18723 | 6.55e-03 | 3.84e-02 | 123 |
| GO:009026315 | Oral cavity | LP | positive regulation of canonical Wnt signaling pathway | 38/4623 | 106/18723 | 6.67e-03 | 3.89e-02 | 38 |
| GO:006007015 | Oral cavity | LP | canonical Wnt signaling pathway | 94/4623 | 303/18723 | 6.97e-03 | 3.96e-02 | 94 |
| GO:000164916 | Oral cavity | LP | osteoblast differentiation | 73/4623 | 229/18723 | 8.09e-03 | 4.40e-02 | 73 |
| GO:001605532 | Oral cavity | NEOLP | Wnt signaling pathway | 93/2005 | 444/18723 | 1.35e-10 | 1.34e-08 | 93 |
| GO:019873832 | Oral cavity | NEOLP | cell-cell signaling by wnt | 93/2005 | 446/18723 | 1.73e-10 | 1.66e-08 | 93 |
| GO:002260433 | Oral cavity | NEOLP | regulation of cell morphogenesis | 69/2005 | 309/18723 | 2.07e-09 | 1.29e-07 | 69 |
| Page: 1 2 3 4 5 6 7 8 9 10 |
| Pathway ID | Tissue | Disease Stage | Description | Gene Ratio | Bg Ratio | pvalue | p.adjust | qvalue | Count |
| hsa043507 | Esophagus | ESCC | TGF-beta signaling pathway | 69/4205 | 108/8465 | 1.92e-03 | 5.54e-03 | 2.84e-03 | 69 |
| hsa0435014 | Esophagus | ESCC | TGF-beta signaling pathway | 69/4205 | 108/8465 | 1.92e-03 | 5.54e-03 | 2.84e-03 | 69 |
| hsa043506 | Oral cavity | OSCC | TGF-beta signaling pathway | 60/3704 | 108/8465 | 8.66e-03 | 1.97e-02 | 1.00e-02 | 60 |
| hsa0435013 | Oral cavity | OSCC | TGF-beta signaling pathway | 60/3704 | 108/8465 | 8.66e-03 | 1.97e-02 | 1.00e-02 | 60 |
| hsa0435041 | Oral cavity | NEOLP | TGF-beta signaling pathway | 28/1112 | 108/8465 | 2.46e-04 | 1.62e-03 | 1.02e-03 | 28 |
| hsa0431024 | Oral cavity | NEOLP | Wnt signaling pathway | 34/1112 | 171/8465 | 8.05e-03 | 2.88e-02 | 1.81e-02 | 34 |
| hsa0435051 | Oral cavity | NEOLP | TGF-beta signaling pathway | 28/1112 | 108/8465 | 2.46e-04 | 1.62e-03 | 1.02e-03 | 28 |
| hsa0431034 | Oral cavity | NEOLP | Wnt signaling pathway | 34/1112 | 171/8465 | 8.05e-03 | 2.88e-02 | 1.81e-02 | 34 |
| Page: 1 |
Top |
Cell-cell communication analysis |
| Identification of potential cell-cell interactions between two cell types and their ligand-receptor pairs for different disease states |
| Ligand | Receptor | LRpair | Pathway | Tissue | Disease Stage |
| Page: 1 |
Top |
Single-cell gene regulatory network inference analysis |
| Find out the significant the regulons (TFs) and the target genes of each regulon across cell types for different disease states |
| TF | Cell Type | Tissue | Disease Stage | Target Gene | RSS | Regulon Activity |
| ∗The dot plots of a searched regulon are shown for all cell subpopulations in each disease state of each tissue based on the regulon specific score inferred using pySCENIC and by calculating the average expression. |
| Page: 1 |
Top |
Somatic mutation of malignant transformation related genes |
| Annotation of somatic variants for genes involved in malignant transformation |
| Hugo Symbol | Variant Class | Variant Classification | dbSNP RS | HGVSc | HGVSp | HGVSp Short | SWISSPROT | BIOTYPE | SIFT | PolyPhen | Tumor Sample Barcode | Tissue | Histology | Sex | Age | Stage | Therapy Types | Drugs | Outcome |
| BAMBI | SNV | Missense_Mutation | c.103G>T | p.Ala35Ser | p.A35S | Q13145 | protein_coding | tolerated(0.13) | benign(0.258) | TCGA-A8-A079-01 | Breast | breast invasive carcinoma | Female | >=65 | III/IV | Chemotherapy | 5-fluorouracil | SD | |
| BAMBI | insertion | Frame_Shift_Ins | novel | c.534_535insCA | p.Glu179GlnfsTer34 | p.E179Qfs*34 | Q13145 | protein_coding | TCGA-A2-A0T2-01 | Breast | breast invasive carcinoma | Female | >=65 | III/IV | Chemotherapy | xeloda | PD | ||
| BAMBI | insertion | Nonsense_Mutation | novel | c.535_536insCCTGGCTAACATGGTGAAACCCCATCTCTACTACAAATACA | p.Glu179AlafsTer6 | p.E179Afs*6 | Q13145 | protein_coding | TCGA-A2-A0T2-01 | Breast | breast invasive carcinoma | Female | >=65 | III/IV | Chemotherapy | xeloda | PD | ||
| BAMBI | SNV | Missense_Mutation | novel | c.521G>T | p.Arg174Met | p.R174M | Q13145 | protein_coding | deleterious(0) | probably_damaging(0.993) | TCGA-2W-A8YY-01 | Cervix | cervical & endocervical cancer | Female | <65 | I/II | Chemotherapy | cisplatin | CR |
| BAMBI | SNV | Missense_Mutation | novel | c.669N>T | p.Glu223Asp | p.E223D | Q13145 | protein_coding | tolerated_low_confidence(0.15) | probably_damaging(0.978) | TCGA-AA-3984-01 | Colorectum | colon adenocarcinoma | Female | <65 | I/II | Unknown | Unknown | SD |
| BAMBI | SNV | Missense_Mutation | rs372503225 | c.148G>T | p.Ala50Ser | p.A50S | Q13145 | protein_coding | tolerated(0.13) | probably_damaging(0.999) | TCGA-AA-A024-01 | Colorectum | colon adenocarcinoma | Male | >=65 | I/II | Unknown | Unknown | SD |
| BAMBI | SNV | Missense_Mutation | rs375455762 | c.166C>A | p.Leu56Ile | p.L56I | Q13145 | protein_coding | tolerated(0.08) | probably_damaging(0.998) | TCGA-AZ-4315-01 | Colorectum | colon adenocarcinoma | Male | <65 | I/II | Unknown | Unknown | SD |
| BAMBI | SNV | Missense_Mutation | rs776749607 | c.458C>T | p.Ala153Val | p.A153V | Q13145 | protein_coding | deleterious(0) | probably_damaging(0.986) | TCGA-AZ-4315-01 | Colorectum | colon adenocarcinoma | Male | <65 | I/II | Unknown | Unknown | SD |
| BAMBI | SNV | Missense_Mutation | rs369743386 | c.530G>A | p.Arg177Gln | p.R177Q | Q13145 | protein_coding | deleterious(0.02) | probably_damaging(0.978) | TCGA-AZ-4315-01 | Colorectum | colon adenocarcinoma | Male | <65 | I/II | Unknown | Unknown | SD |
| BAMBI | SNV | Missense_Mutation | c.113T>C | p.Val38Ala | p.V38A | Q13145 | protein_coding | deleterious(0) | probably_damaging(0.994) | TCGA-D5-6540-01 | Colorectum | colon adenocarcinoma | Male | >=65 | I/II | Unknown | Unknown | SD |
| Page: 1 2 3 4 |
Top |
Related drugs of malignant transformation related genes |
| Identification of chemicals and drugs interact with genes involved in malignant transfromation |
| (DGIdb 4.0) |
| Entrez ID | Symbol | Category | Interaction Types | Drug Claim Name | Drug Name | PMIDs |
| Page: 1 |

Copyright 2023-Present -The University of Texas Health Science Center at Houston |