| Tissue | Expression Dynamics | Abbreviation |
| Cervix | 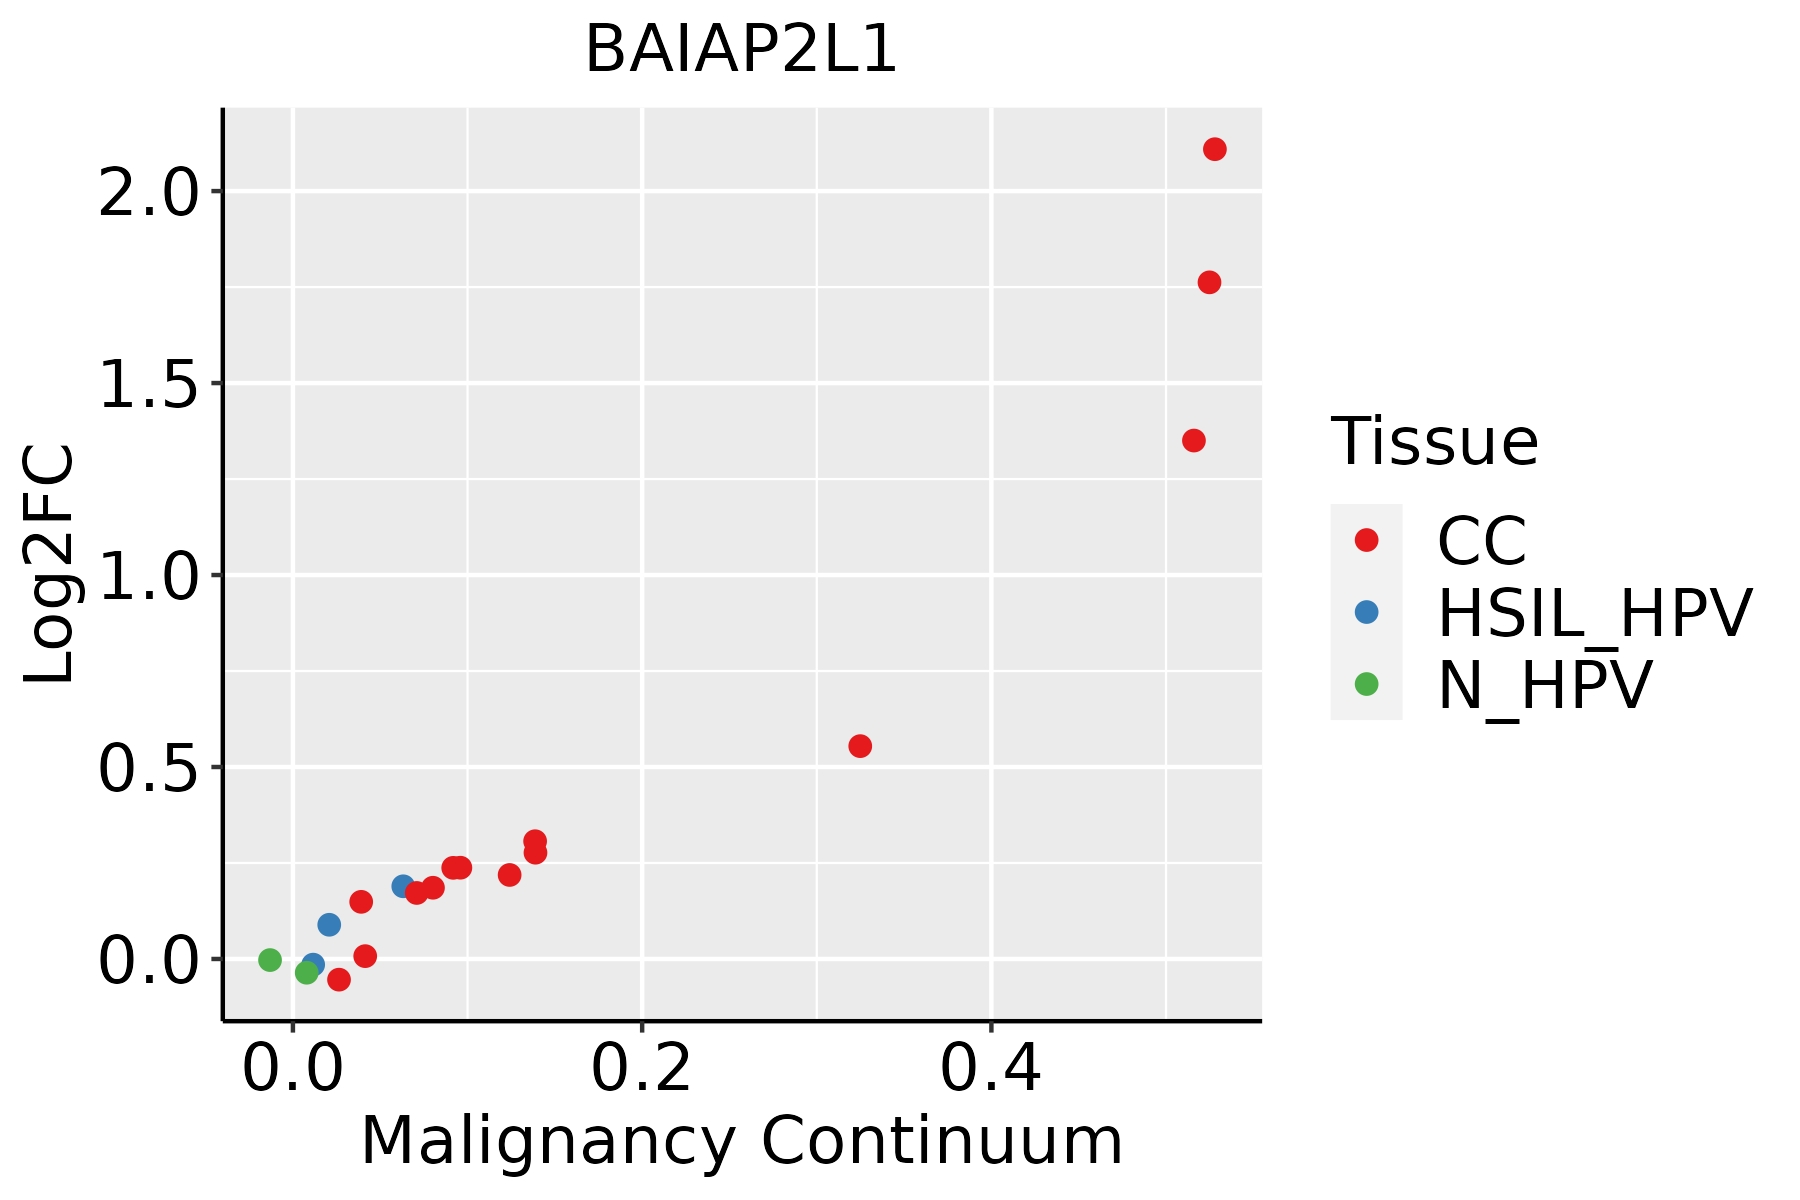 | CC: Cervix cancer |
| HSIL_HPV: HPV-infected high-grade squamous intraepithelial lesions |
| N_HPV: HPV-infected normal cervix |
| Colorectum (GSE201348) |  | FAP: Familial adenomatous polyposis |
| CRC: Colorectal cancer |
| Colorectum (HTA11) |  | AD: Adenomas |
| SER: Sessile serrated lesions |
| MSI-H: Microsatellite-high colorectal cancer |
| MSS: Microsatellite stable colorectal cancer |
| Endometrium | 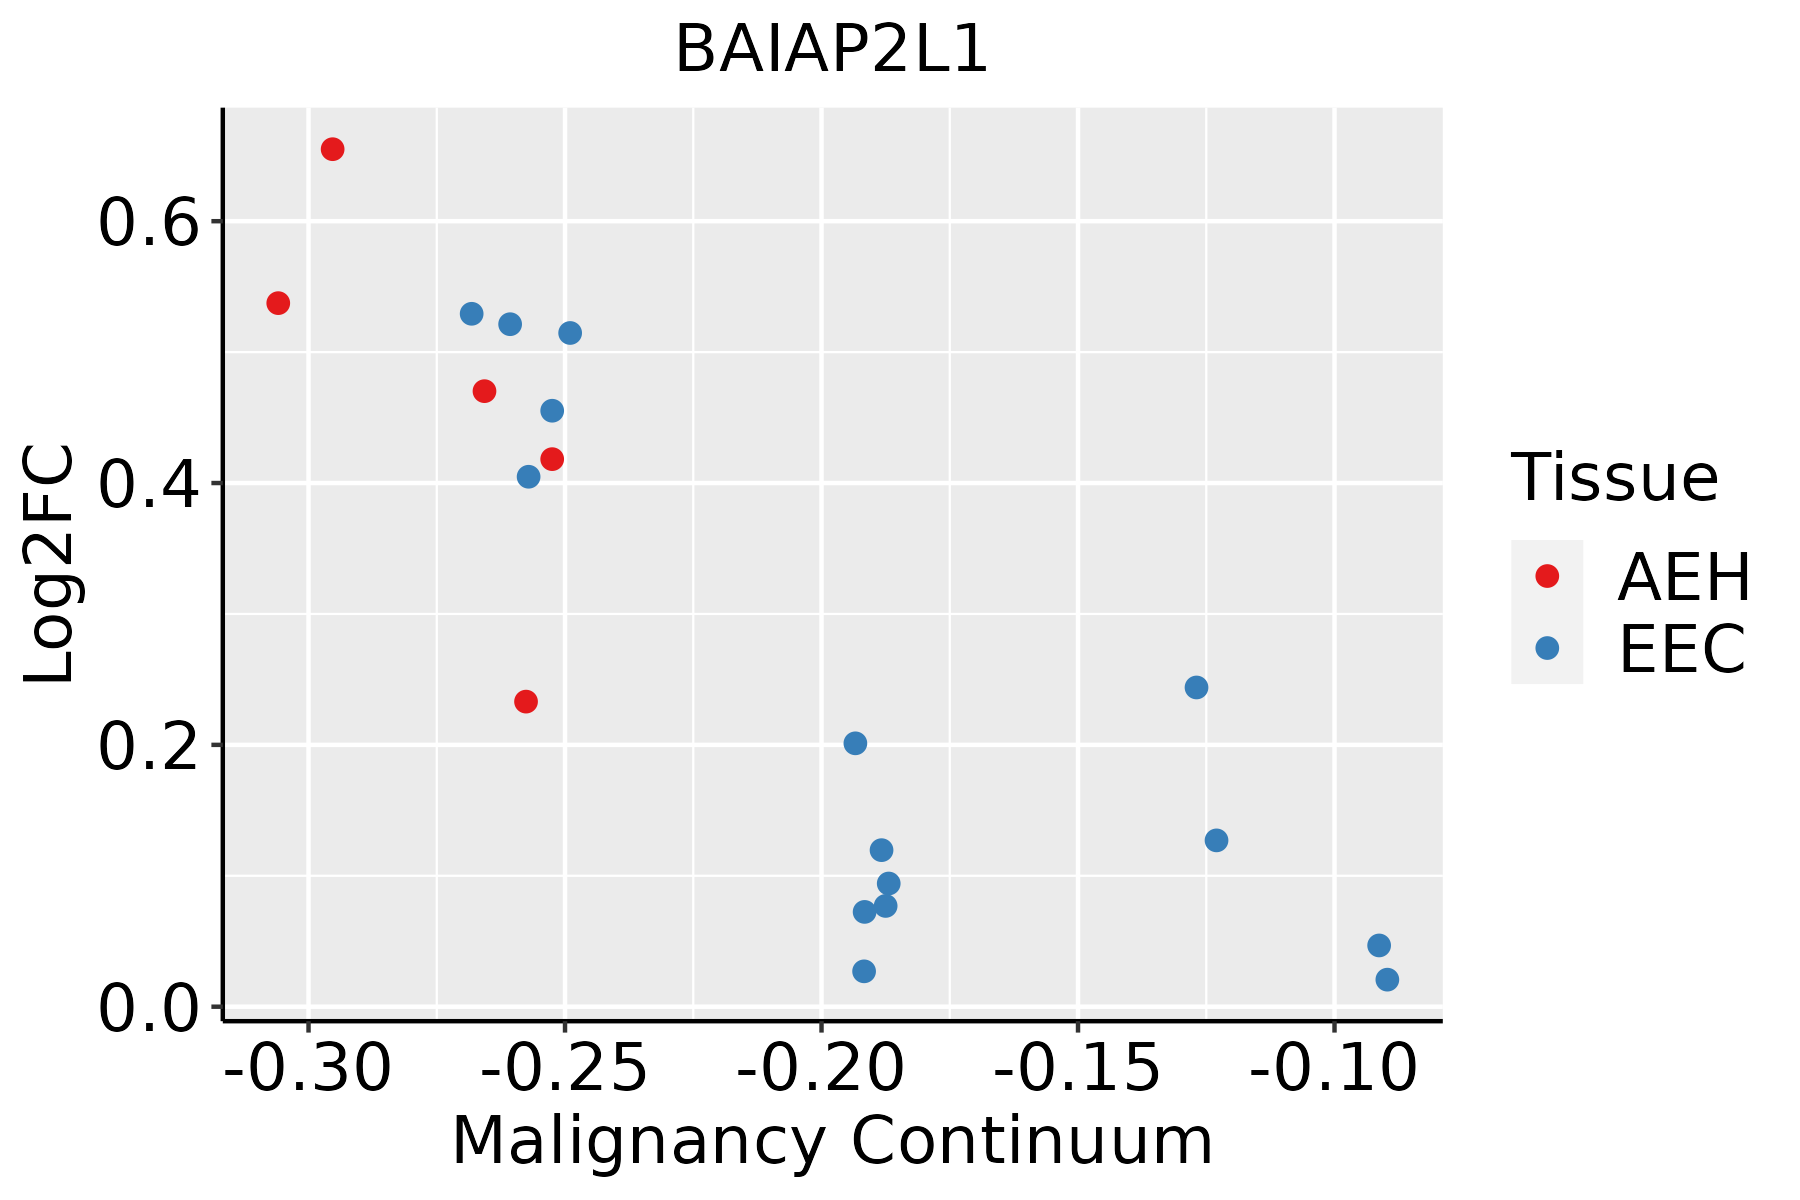 | AEH: Atypical endometrial hyperplasia |
| EEC: Endometrioid Cancer |
| Esophagus |  | ESCC: Esophageal squamous cell carcinoma |
| HGIN: High-grade intraepithelial neoplasias |
| LGIN: Low-grade intraepithelial neoplasias |
| GC | 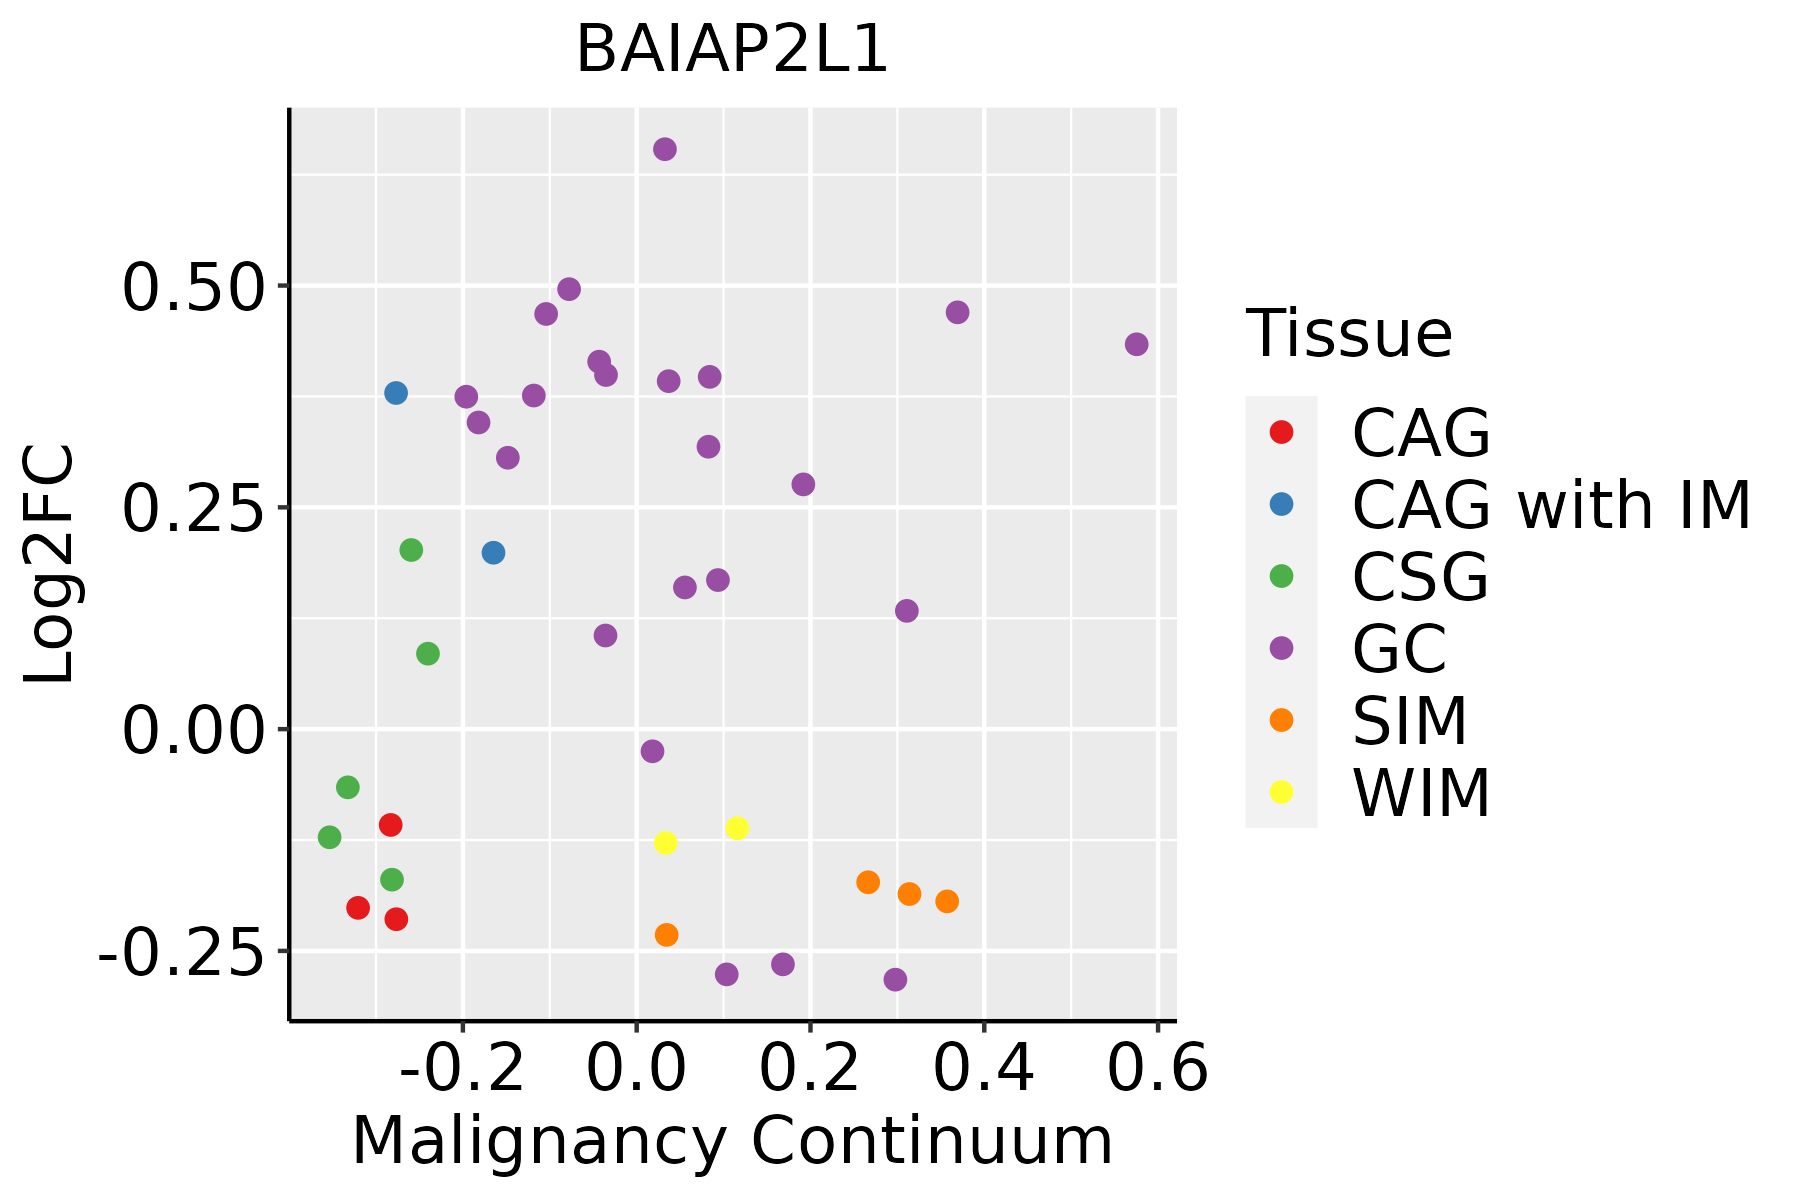 | CAG: Chronic atrophic gastritis |
| CAG with IM: Chronic atrophic gastritis with intestinal metaplasia |
| CSG: Chronic superficial gastritis |
| GC: Gastric cancer |
| SIM: Severe intestinal metaplasia |
| WIM: Wild intestinal metaplasia |
| Liver | 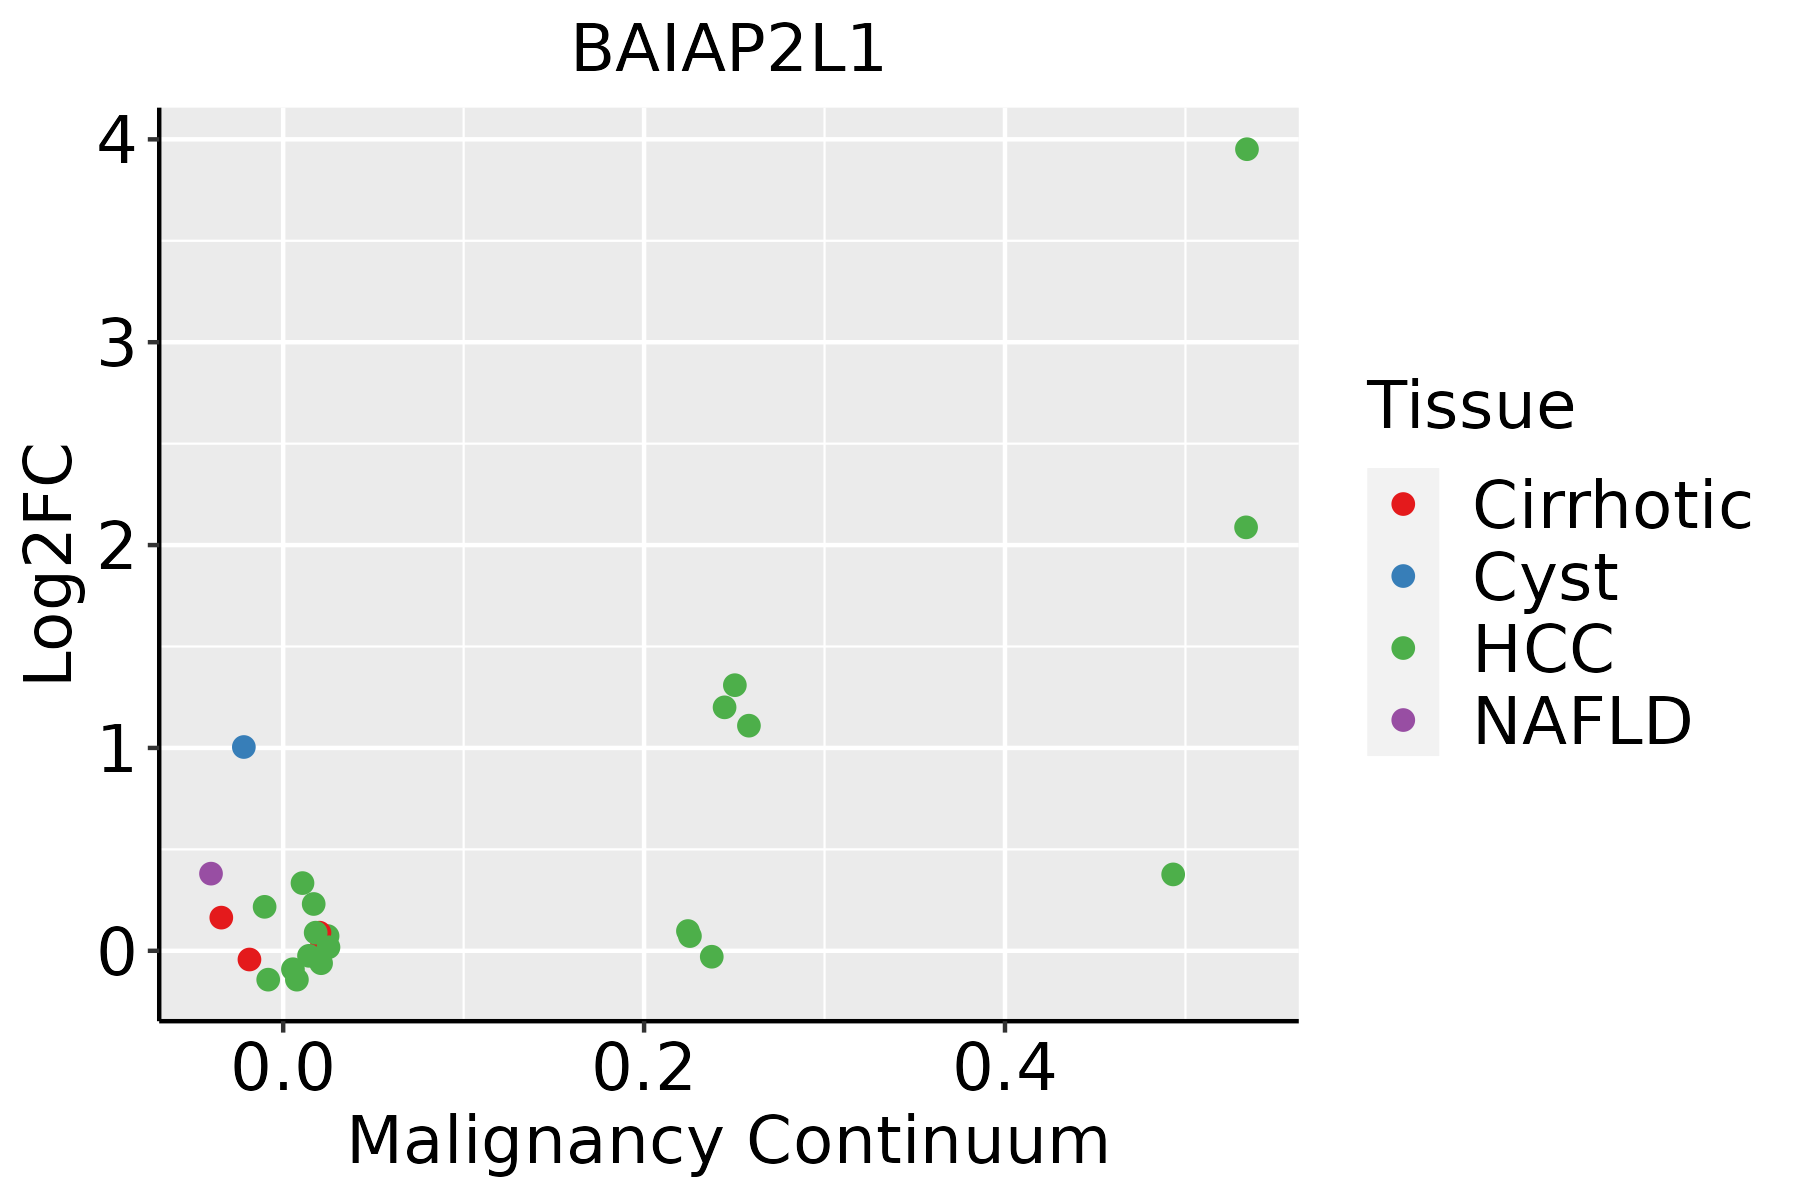 | HCC: Hepatocellular carcinoma |
| NAFLD: Non-alcoholic fatty liver disease |
| Lung |  | AAH: Atypical adenomatous hyperplasia |
| AIS: Adenocarcinoma in situ |
| IAC: Invasive lung adenocarcinoma |
| MIA: Minimally invasive adenocarcinoma |
| Oral Cavity | 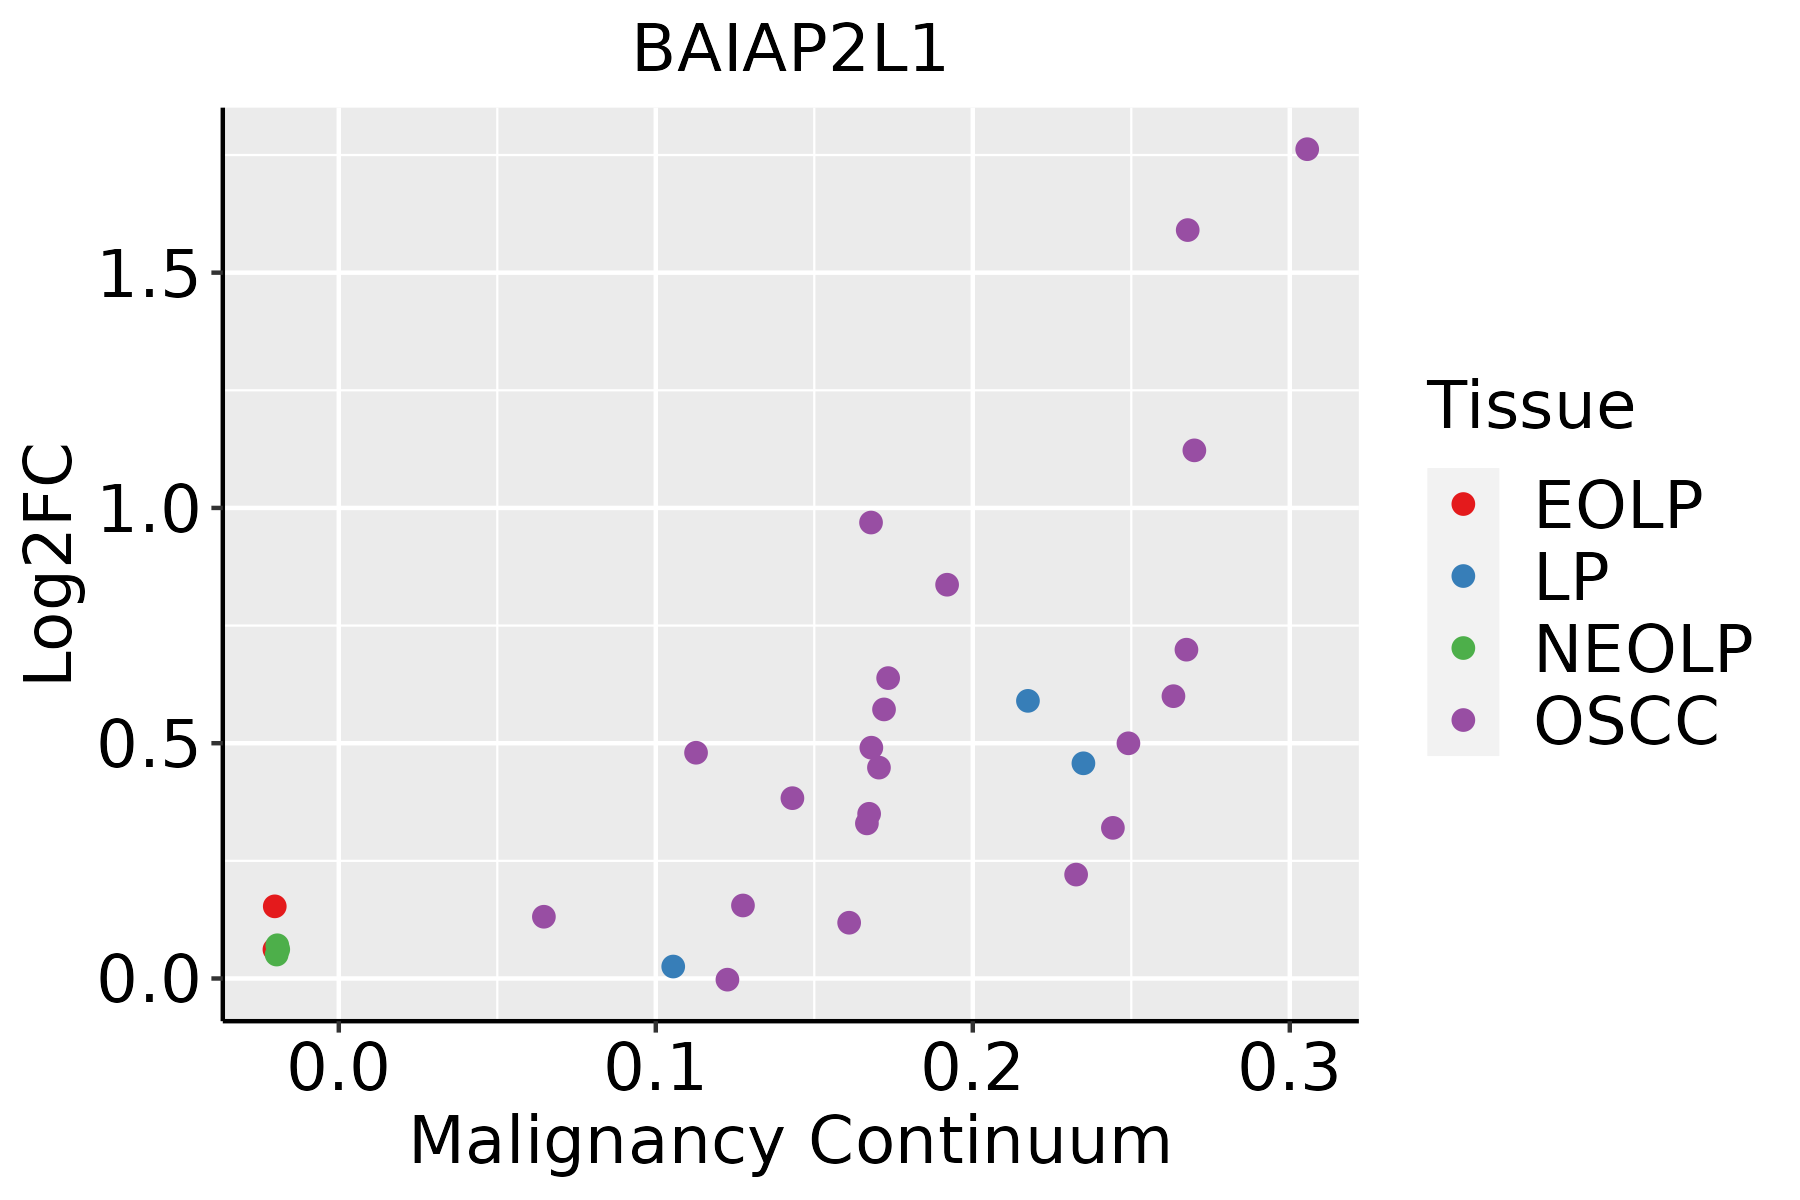 | EOLP: Erosive Oral lichen planus |
| LP: leukoplakia |
| NEOLP: Non-erosive oral lichen planus |
| OSCC: Oral squamous cell carcinoma |
| Prostate | 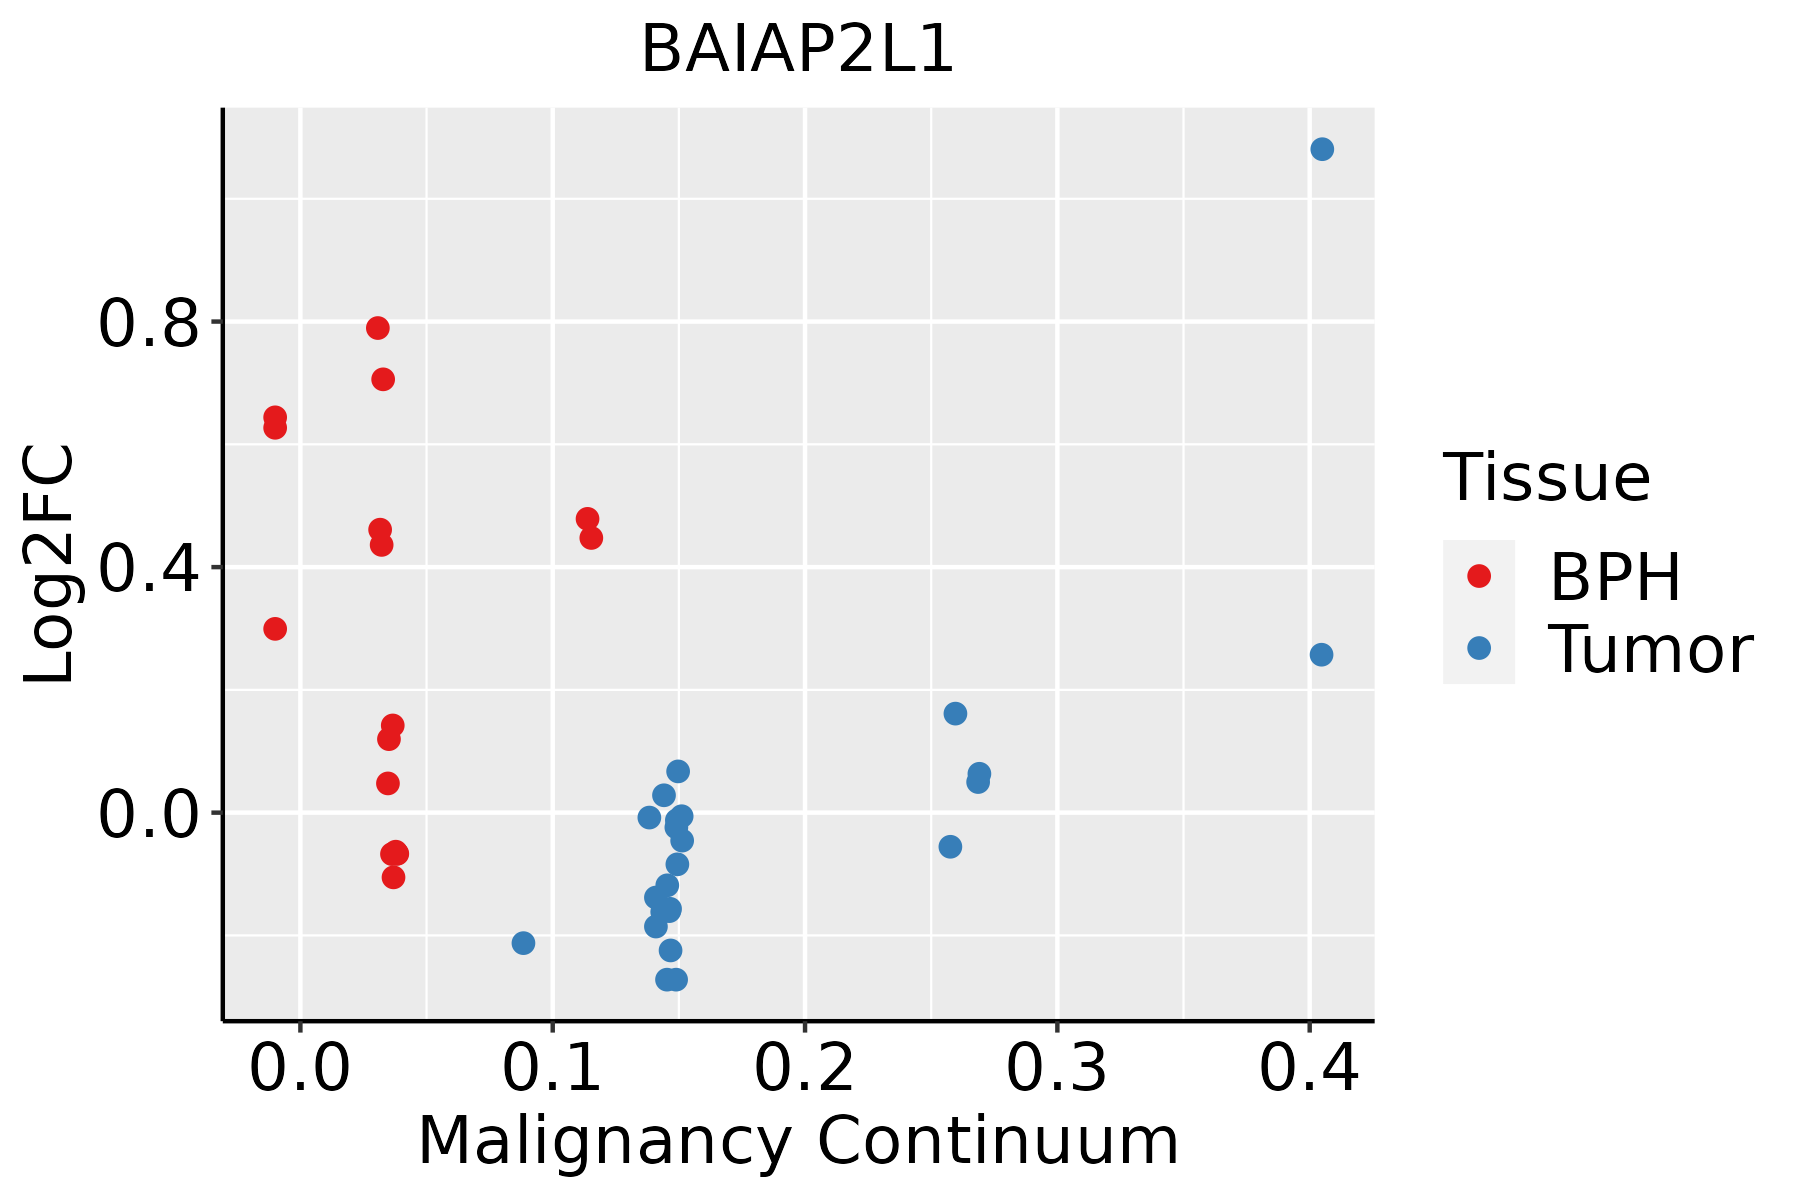 | BPH: Benign Prostatic Hyperplasia |
| Skin |  | AK: Actinic keratosis |
| cSCC: Cutaneous squamous cell carcinoma |
| SCCIS:squamous cell carcinoma in situ |
| GO ID | Tissue | Disease Stage | Description | Gene Ratio | Bg Ratio | pvalue | p.adjust | Count |
| GO:19016531 | Colorectum | SER | cellular response to peptide | 83/2897 | 359/18723 | 8.03e-05 | 1.77e-03 | 83 |
| GO:00434341 | Colorectum | SER | response to peptide hormone | 93/2897 | 414/18723 | 9.61e-05 | 2.04e-03 | 93 |
| GO:00713751 | Colorectum | SER | cellular response to peptide hormone stimulus | 68/2897 | 290/18723 | 2.20e-04 | 3.89e-03 | 68 |
| GO:00328691 | Colorectum | SER | cellular response to insulin stimulus | 51/2897 | 203/18723 | 2.30e-04 | 3.96e-03 | 51 |
| GO:00315321 | Colorectum | SER | actin cytoskeleton reorganization | 30/2897 | 107/18723 | 6.38e-04 | 8.64e-03 | 30 |
| GO:0007009 | Colorectum | SER | plasma membrane organization | 36/2897 | 142/18723 | 1.50e-03 | 1.62e-02 | 36 |
| GO:00070152 | Colorectum | MSS | actin filament organization | 146/3467 | 442/18723 | 1.16e-13 | 2.67e-11 | 146 |
| GO:00325352 | Colorectum | MSS | regulation of cellular component size | 127/3467 | 383/18723 | 3.44e-12 | 5.79e-10 | 127 |
| GO:00329702 | Colorectum | MSS | regulation of actin filament-based process | 128/3467 | 397/18723 | 2.47e-11 | 3.49e-09 | 128 |
| GO:19029032 | Colorectum | MSS | regulation of supramolecular fiber organization | 121/3467 | 383/18723 | 3.63e-10 | 3.28e-08 | 121 |
| GO:00322712 | Colorectum | MSS | regulation of protein polymerization | 83/3467 | 233/18723 | 3.99e-10 | 3.49e-08 | 83 |
| GO:00081542 | Colorectum | MSS | actin polymerization or depolymerization | 79/3467 | 218/18723 | 4.14e-10 | 3.49e-08 | 79 |
| GO:00300412 | Colorectum | MSS | actin filament polymerization | 71/3467 | 191/18723 | 8.77e-10 | 6.92e-08 | 71 |
| GO:00080642 | Colorectum | MSS | regulation of actin polymerization or depolymerization | 70/3467 | 188/18723 | 1.06e-09 | 8.25e-08 | 70 |
| GO:00308322 | Colorectum | MSS | regulation of actin filament length | 70/3467 | 189/18723 | 1.38e-09 | 1.03e-07 | 70 |
| GO:00432542 | Colorectum | MSS | regulation of protein-containing complex assembly | 130/3467 | 428/18723 | 1.38e-09 | 1.03e-07 | 130 |
| GO:00329562 | Colorectum | MSS | regulation of actin cytoskeleton organization | 113/3467 | 358/18723 | 1.46e-09 | 1.07e-07 | 113 |
| GO:19029052 | Colorectum | MSS | positive regulation of supramolecular fiber organization | 75/3467 | 209/18723 | 1.89e-09 | 1.35e-07 | 75 |
| GO:00308332 | Colorectum | MSS | regulation of actin filament polymerization | 65/3467 | 172/18723 | 2.05e-09 | 1.45e-07 | 65 |
| GO:00313342 | Colorectum | MSS | positive regulation of protein-containing complex assembly | 82/3467 | 237/18723 | 2.49e-09 | 1.75e-07 | 82 |
| Pathway ID | Tissue | Disease Stage | Description | Gene Ratio | Bg Ratio | pvalue | p.adjust | qvalue | Count |
| hsa0513020 | Cervix | CC | Pathogenic Escherichia coli infection | 63/1267 | 197/8465 | 9.28e-10 | 2.00e-08 | 1.19e-08 | 63 |
| hsa05130110 | Cervix | CC | Pathogenic Escherichia coli infection | 63/1267 | 197/8465 | 9.28e-10 | 2.00e-08 | 1.19e-08 | 63 |
| hsa0513025 | Cervix | HSIL_HPV | Pathogenic Escherichia coli infection | 28/459 | 197/8465 | 2.36e-06 | 4.61e-05 | 3.73e-05 | 28 |
| hsa0513035 | Cervix | HSIL_HPV | Pathogenic Escherichia coli infection | 28/459 | 197/8465 | 2.36e-06 | 4.61e-05 | 3.73e-05 | 28 |
| hsa05130 | Colorectum | AD | Pathogenic Escherichia coli infection | 79/2092 | 197/8465 | 1.05e-06 | 1.36e-05 | 8.65e-06 | 79 |
| hsa051301 | Colorectum | AD | Pathogenic Escherichia coli infection | 79/2092 | 197/8465 | 1.05e-06 | 1.36e-05 | 8.65e-06 | 79 |
| hsa051302 | Colorectum | SER | Pathogenic Escherichia coli infection | 60/1580 | 197/8465 | 3.63e-05 | 4.31e-04 | 3.13e-04 | 60 |
| hsa051303 | Colorectum | SER | Pathogenic Escherichia coli infection | 60/1580 | 197/8465 | 3.63e-05 | 4.31e-04 | 3.13e-04 | 60 |
| hsa051304 | Colorectum | MSS | Pathogenic Escherichia coli infection | 73/1875 | 197/8465 | 1.10e-06 | 1.48e-05 | 9.06e-06 | 73 |
| hsa051305 | Colorectum | MSS | Pathogenic Escherichia coli infection | 73/1875 | 197/8465 | 1.10e-06 | 1.48e-05 | 9.06e-06 | 73 |
| hsa051308 | Colorectum | FAP | Pathogenic Escherichia coli infection | 62/1404 | 197/8465 | 1.37e-07 | 3.08e-06 | 1.87e-06 | 62 |
| hsa051309 | Colorectum | FAP | Pathogenic Escherichia coli infection | 62/1404 | 197/8465 | 1.37e-07 | 3.08e-06 | 1.87e-06 | 62 |
| hsa0513010 | Colorectum | CRC | Pathogenic Escherichia coli infection | 47/1091 | 197/8465 | 1.49e-05 | 3.84e-04 | 2.60e-04 | 47 |
| hsa0513011 | Colorectum | CRC | Pathogenic Escherichia coli infection | 47/1091 | 197/8465 | 1.49e-05 | 3.84e-04 | 2.60e-04 | 47 |
| hsa0513026 | Endometrium | AEH | Pathogenic Escherichia coli infection | 50/1197 | 197/8465 | 1.72e-05 | 1.86e-04 | 1.36e-04 | 50 |
| hsa05130112 | Endometrium | AEH | Pathogenic Escherichia coli infection | 50/1197 | 197/8465 | 1.72e-05 | 1.86e-04 | 1.36e-04 | 50 |
| hsa0513027 | Endometrium | EEC | Pathogenic Escherichia coli infection | 51/1237 | 197/8465 | 1.98e-05 | 2.28e-04 | 1.70e-04 | 51 |
| hsa0513036 | Endometrium | EEC | Pathogenic Escherichia coli infection | 51/1237 | 197/8465 | 1.98e-05 | 2.28e-04 | 1.70e-04 | 51 |
| hsa0513039 | Esophagus | HGIN | Pathogenic Escherichia coli infection | 54/1383 | 197/8465 | 4.91e-05 | 6.15e-04 | 4.89e-04 | 54 |
| hsa05130115 | Esophagus | HGIN | Pathogenic Escherichia coli infection | 54/1383 | 197/8465 | 4.91e-05 | 6.15e-04 | 4.89e-04 | 54 |
| Hugo Symbol | Variant Class | Variant Classification | dbSNP RS | HGVSc | HGVSp | HGVSp Short | SWISSPROT | BIOTYPE | SIFT | PolyPhen | Tumor Sample Barcode | Tissue | Histology | Sex | Age | Stage | Therapy Types | Drugs | Outcome |
| BAIAP2L1 | SNV | Missense_Mutation | novel | c.1051N>G | p.Thr351Ala | p.T351A | Q9UHR4 | protein_coding | tolerated(0.78) | possibly_damaging(0.469) | TCGA-A7-A6VY-01 | Breast | breast invasive carcinoma | Female | <65 | I/II | Chemotherapy | cyclophosphamide | CR |
| BAIAP2L1 | SNV | Missense_Mutation | rs775381596 | c.601T>C | p.Cys201Arg | p.C201R | Q9UHR4 | protein_coding | deleterious(0) | probably_damaging(0.999) | TCGA-A8-A09Z-01 | Breast | breast invasive carcinoma | Female | >=65 | I/II | Unknown | Unknown | SD |
| BAIAP2L1 | SNV | Missense_Mutation | | c.506N>G | p.Ser169Cys | p.S169C | Q9UHR4 | protein_coding | deleterious(0.02) | benign(0.28) | TCGA-AR-A0TS-01 | Breast | breast invasive carcinoma | Female | <65 | I/II | Chemotherapy | doxorubicin | SD |
| BAIAP2L1 | SNV | Missense_Mutation | rs140166928 | c.452N>A | p.Arg151Gln | p.R151Q | Q9UHR4 | protein_coding | deleterious(0.03) | benign(0.046) | TCGA-D8-A1J9-01 | Breast | breast invasive carcinoma | Female | <65 | I/II | Unknown | Unknown | SD |
| BAIAP2L1 | insertion | Nonsense_Mutation | novel | c.510_511insGCAACACATGTCACATTTCCTTTCCTTTGTTTTAAATTATGA | p.Arg170_Gln171insAlaThrHisValThrPheProPheLeuCysPheLysLeuTer | p.R170_Q171insATHVTFPFLCFKL* | Q9UHR4 | protein_coding | | | TCGA-A8-A092-01 | Breast | breast invasive carcinoma | Female | <65 | III/IV | Chemotherapy | paclitaxel | CR |
| BAIAP2L1 | deletion | Frame_Shift_Del | novel | c.1148delN | p.His383ProfsTer26 | p.H383Pfs*26 | Q9UHR4 | protein_coding | | | TCGA-EW-A2FV-01 | Breast | breast invasive carcinoma | Female | <65 | III/IV | Chemotherapy | docetaxel | SD |
| BAIAP2L1 | SNV | Missense_Mutation | novel | c.986N>T | p.Ser329Leu | p.S329L | Q9UHR4 | protein_coding | deleterious(0.02) | probably_damaging(0.995) | TCGA-C5-A2M1-01 | Cervix | cervical & endocervical cancer | Female | <65 | I/II | Unknown | Unknown | SD |
| BAIAP2L1 | SNV | Missense_Mutation | novel | c.1041N>G | p.Ile347Met | p.I347M | Q9UHR4 | protein_coding | deleterious(0) | probably_damaging(0.976) | TCGA-DG-A2KM-01 | Cervix | cervical & endocervical cancer | Female | <65 | I/II | Chemotherapy | cisplatin | SD |
| BAIAP2L1 | SNV | Missense_Mutation | rs202012767 | c.127N>A | p.Ala43Thr | p.A43T | Q9UHR4 | protein_coding | deleterious(0.04) | benign(0.116) | TCGA-PN-A8MA-01 | Cervix | cervical & endocervical cancer | Female | <65 | I/II | Chemotherapy | cisplatin | SD |
| BAIAP2L1 | SNV | Missense_Mutation | | c.842N>T | p.Ser281Leu | p.S281L | Q9UHR4 | protein_coding | tolerated(0.28) | benign(0.001) | TCGA-UC-A7PF-01 | Cervix | cervical & endocervical cancer | Female | <65 | I/II | Unknown | Unknown | SD |


