
|
|||||
|
 | |
| |
| |
| |
| |
| |
|
Gene: ATG5 |
Gene summary for ATG5 |
| Gene information | Species | Human | Gene symbol | ATG5 | Gene ID | 9474 |
| Gene name | autophagy related 5 | |
| Gene Alias | APG5 | |
| Cytomap | 6q21 | |
| Gene Type | protein-coding | GO ID | GO:0000045 | UniProtAcc | A9UGY9 |
Top |
Malignant transformation analysis |
| Identification of the aberrant gene expression in precancerous and cancerous lesions by comparing the gene expression of stem-like cells in diseased tissues with normal stem cells |
| Entrez ID | Symbol | Replicates | Species | Organ | Tissue | Adj P-value | Log2FC | Malignancy |
| 9474 | ATG5 | CA_HPV_2 | Human | Cervix | CC | 1.71e-02 | 1.62e-01 | 0.0391 |
| 9474 | ATG5 | CA_HPV_3 | Human | Cervix | CC | 1.06e-02 | 1.17e-01 | 0.0414 |
| 9474 | ATG5 | CCI_2 | Human | Cervix | CC | 4.41e-03 | 7.10e-01 | 0.5249 |
| 9474 | ATG5 | CCI_3 | Human | Cervix | CC | 2.77e-02 | 5.35e-01 | 0.516 |
| 9474 | ATG5 | Tumor | Human | Cervix | CC | 1.50e-06 | 2.81e-01 | 0.1241 |
| 9474 | ATG5 | sample3 | Human | Cervix | CC | 8.03e-13 | 2.91e-01 | 0.1387 |
| 9474 | ATG5 | T3 | Human | Cervix | CC | 8.50e-13 | 2.97e-01 | 0.1389 |
| 9474 | ATG5 | HTA11_3410_2000001011 | Human | Colorectum | AD | 6.18e-21 | -6.03e-01 | 0.0155 |
| 9474 | ATG5 | HTA11_2487_2000001011 | Human | Colorectum | SER | 6.18e-09 | -5.30e-01 | -0.1808 |
| 9474 | ATG5 | HTA11_2951_2000001011 | Human | Colorectum | AD | 5.16e-04 | -6.47e-01 | 0.0216 |
| 9474 | ATG5 | HTA11_1938_2000001011 | Human | Colorectum | AD | 1.26e-07 | -5.69e-01 | -0.0811 |
| 9474 | ATG5 | HTA11_78_2000001011 | Human | Colorectum | AD | 1.61e-08 | -4.79e-01 | -0.1088 |
| 9474 | ATG5 | HTA11_347_2000001011 | Human | Colorectum | AD | 1.81e-14 | -4.55e-01 | -0.1954 |
| 9474 | ATG5 | HTA11_3361_2000001011 | Human | Colorectum | AD | 1.29e-08 | -5.84e-01 | -0.1207 |
| 9474 | ATG5 | HTA11_83_2000001011 | Human | Colorectum | SER | 2.36e-03 | -4.84e-01 | -0.1526 |
| 9474 | ATG5 | HTA11_696_2000001011 | Human | Colorectum | AD | 4.17e-18 | -5.28e-01 | -0.1464 |
| 9474 | ATG5 | HTA11_866_2000001011 | Human | Colorectum | AD | 3.73e-18 | -5.49e-01 | -0.1001 |
| 9474 | ATG5 | HTA11_1391_2000001011 | Human | Colorectum | AD | 3.48e-09 | -5.03e-01 | -0.059 |
| 9474 | ATG5 | HTA11_5212_2000001011 | Human | Colorectum | AD | 4.20e-02 | -5.47e-01 | -0.2061 |
| 9474 | ATG5 | HTA11_546_2000001011 | Human | Colorectum | AD | 5.48e-04 | -5.27e-01 | -0.0842 |
| Page: 1 2 3 4 5 6 7 8 9 |
| Tissue | Expression Dynamics | Abbreviation |
| Cervix |  | CC: Cervix cancer |
| HSIL_HPV: HPV-infected high-grade squamous intraepithelial lesions | ||
| N_HPV: HPV-infected normal cervix | ||
| Colorectum (GSE201348) |  | FAP: Familial adenomatous polyposis |
| CRC: Colorectal cancer | ||
| Colorectum (HTA11) | 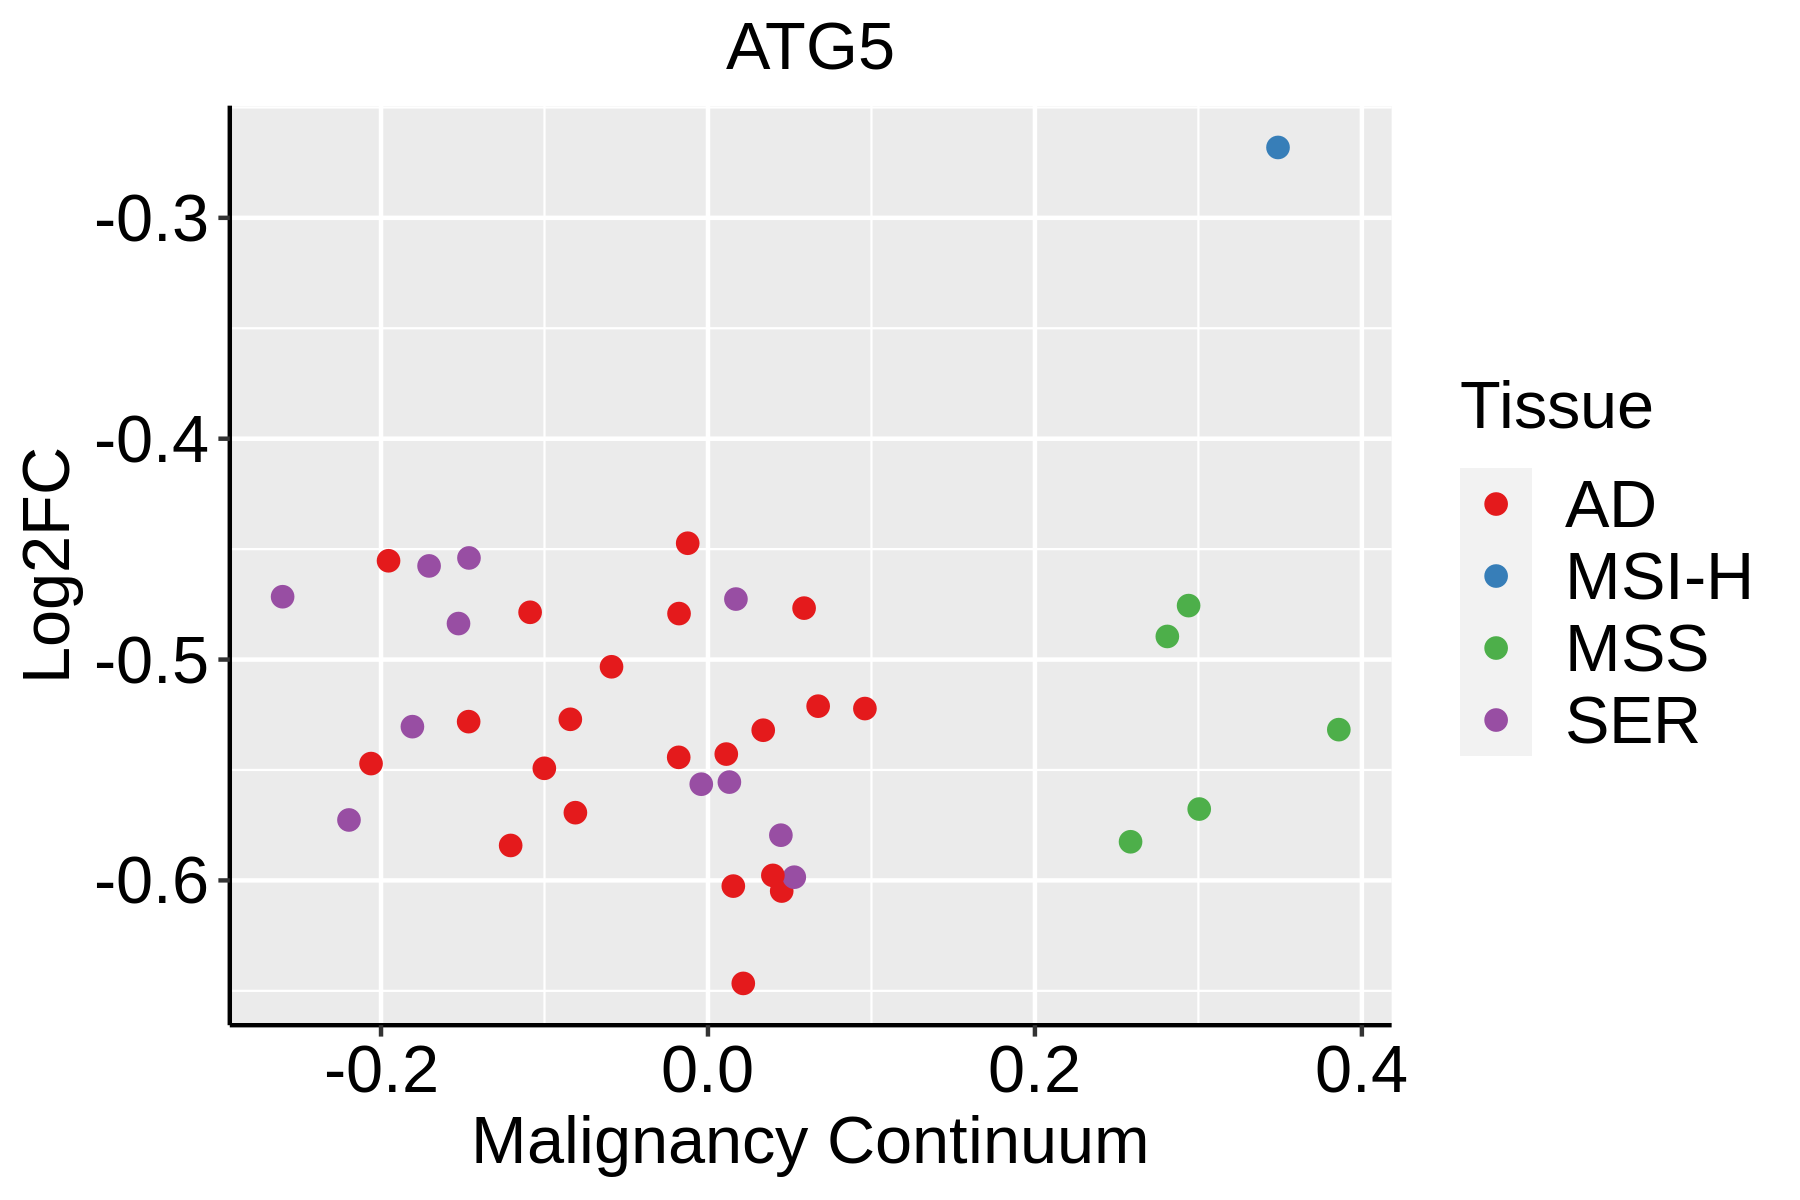 | AD: Adenomas |
| SER: Sessile serrated lesions | ||
| MSI-H: Microsatellite-high colorectal cancer | ||
| MSS: Microsatellite stable colorectal cancer | ||
| Esophagus | 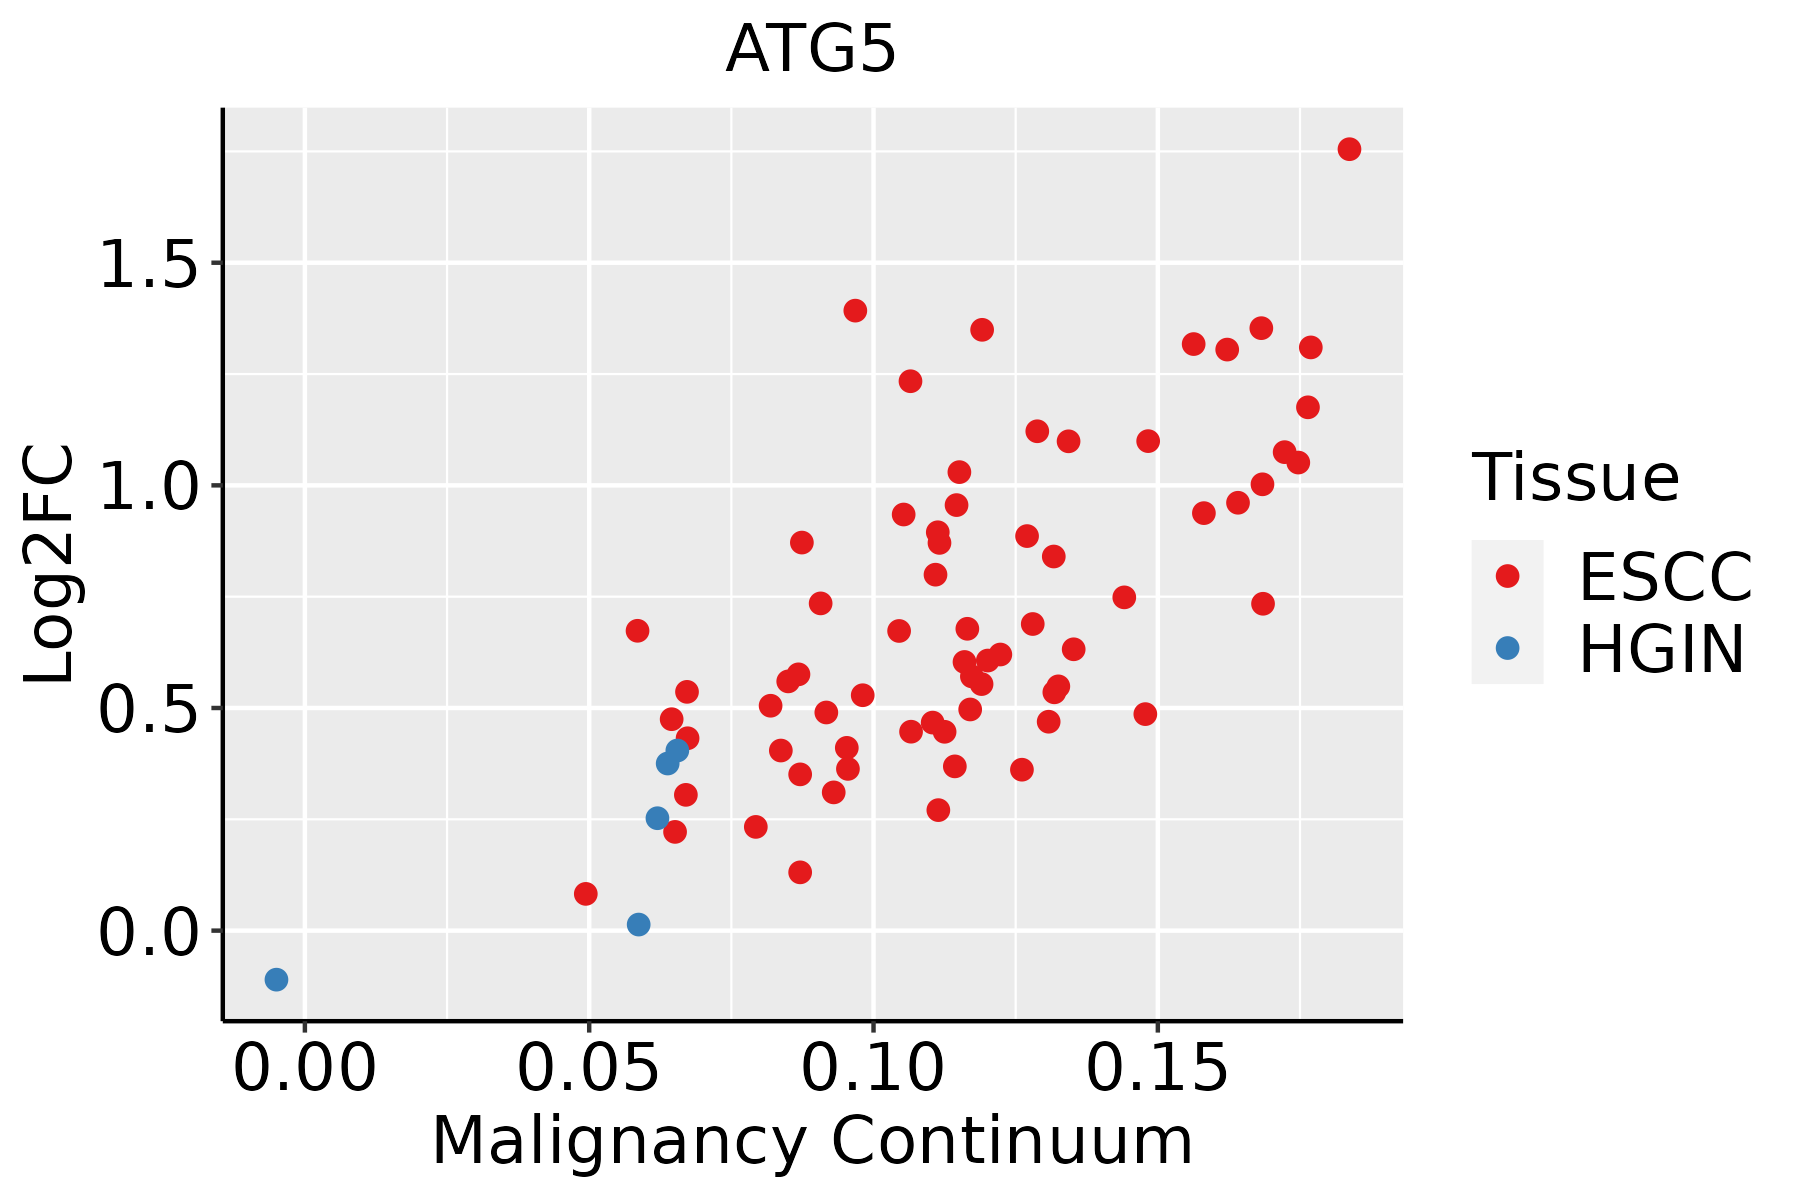 | ESCC: Esophageal squamous cell carcinoma |
| HGIN: High-grade intraepithelial neoplasias | ||
| LGIN: Low-grade intraepithelial neoplasias | ||
| Liver |  | HCC: Hepatocellular carcinoma |
| NAFLD: Non-alcoholic fatty liver disease | ||
| Oral Cavity | 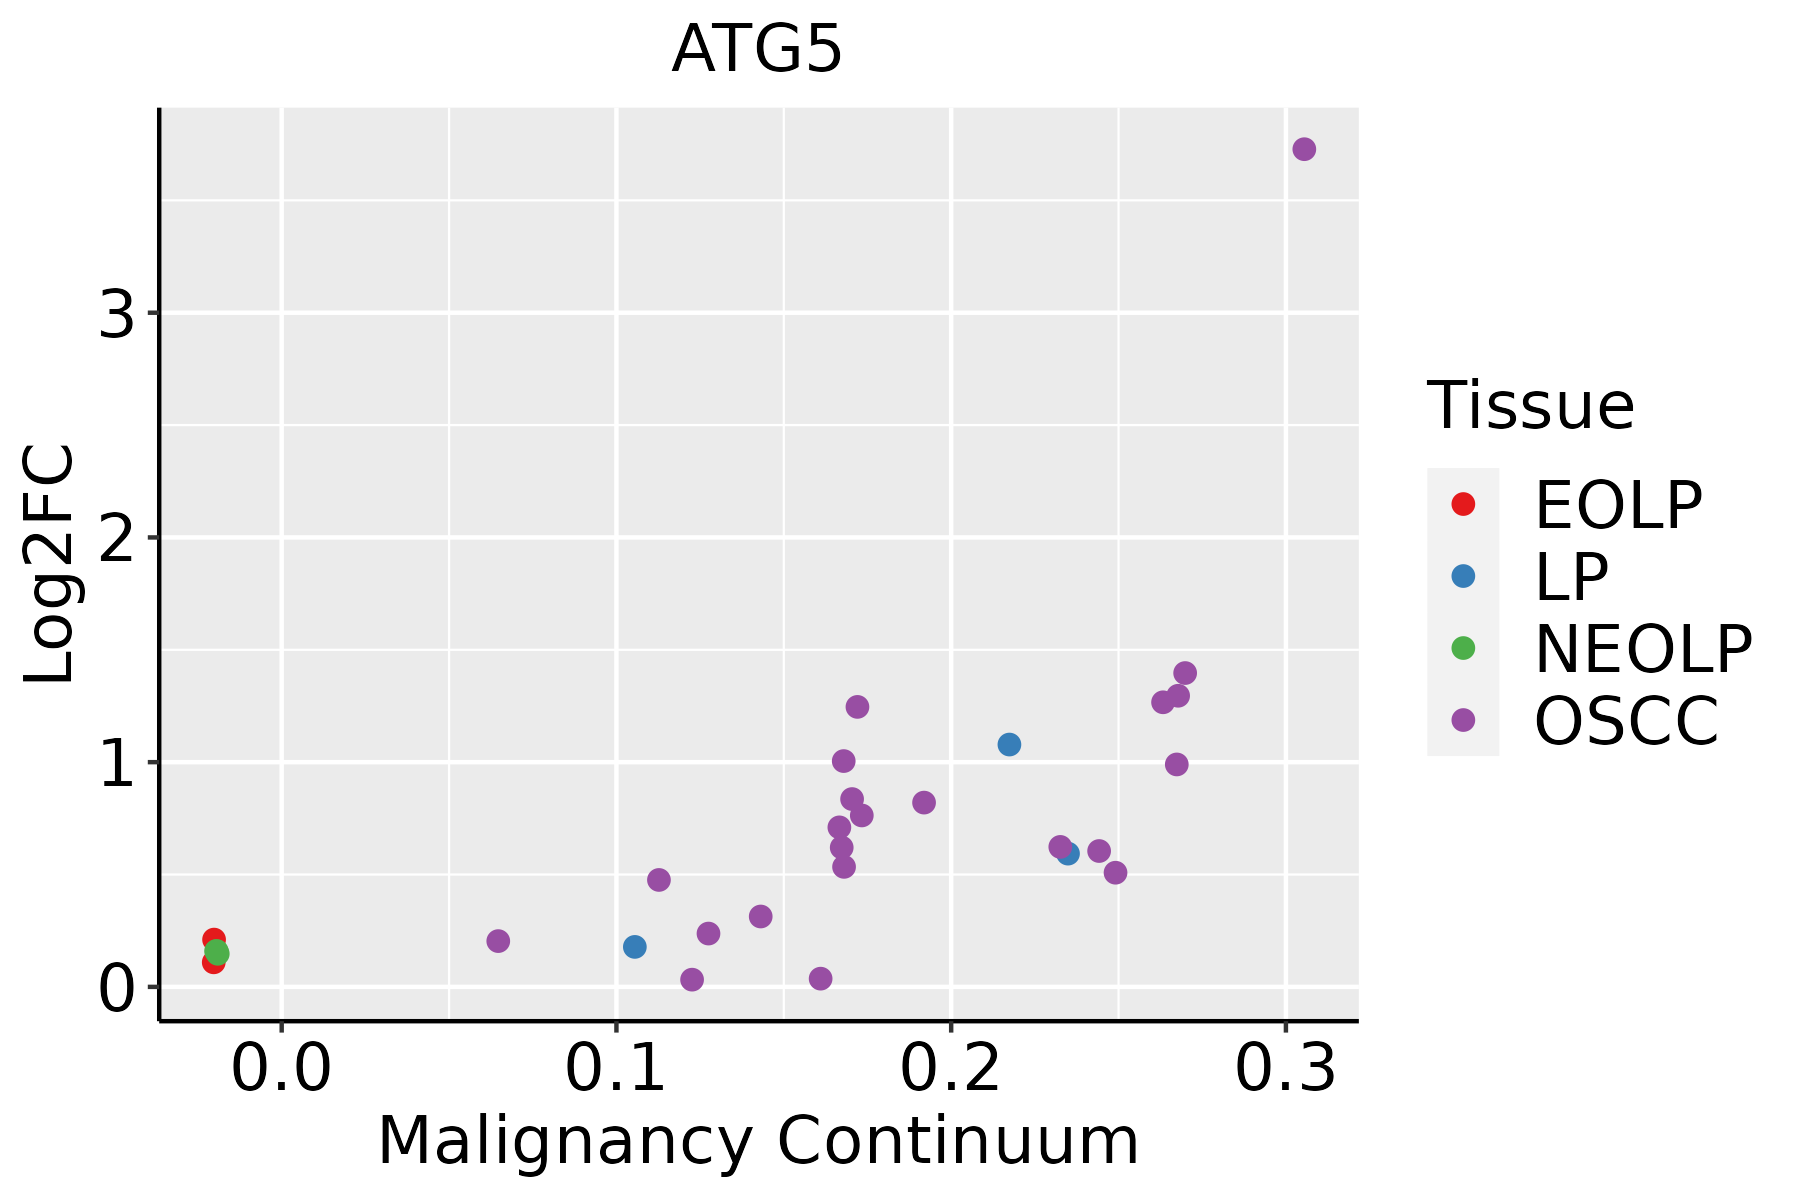 | EOLP: Erosive Oral lichen planus |
| LP: leukoplakia | ||
| NEOLP: Non-erosive oral lichen planus | ||
| OSCC: Oral squamous cell carcinoma | ||
| Skin | 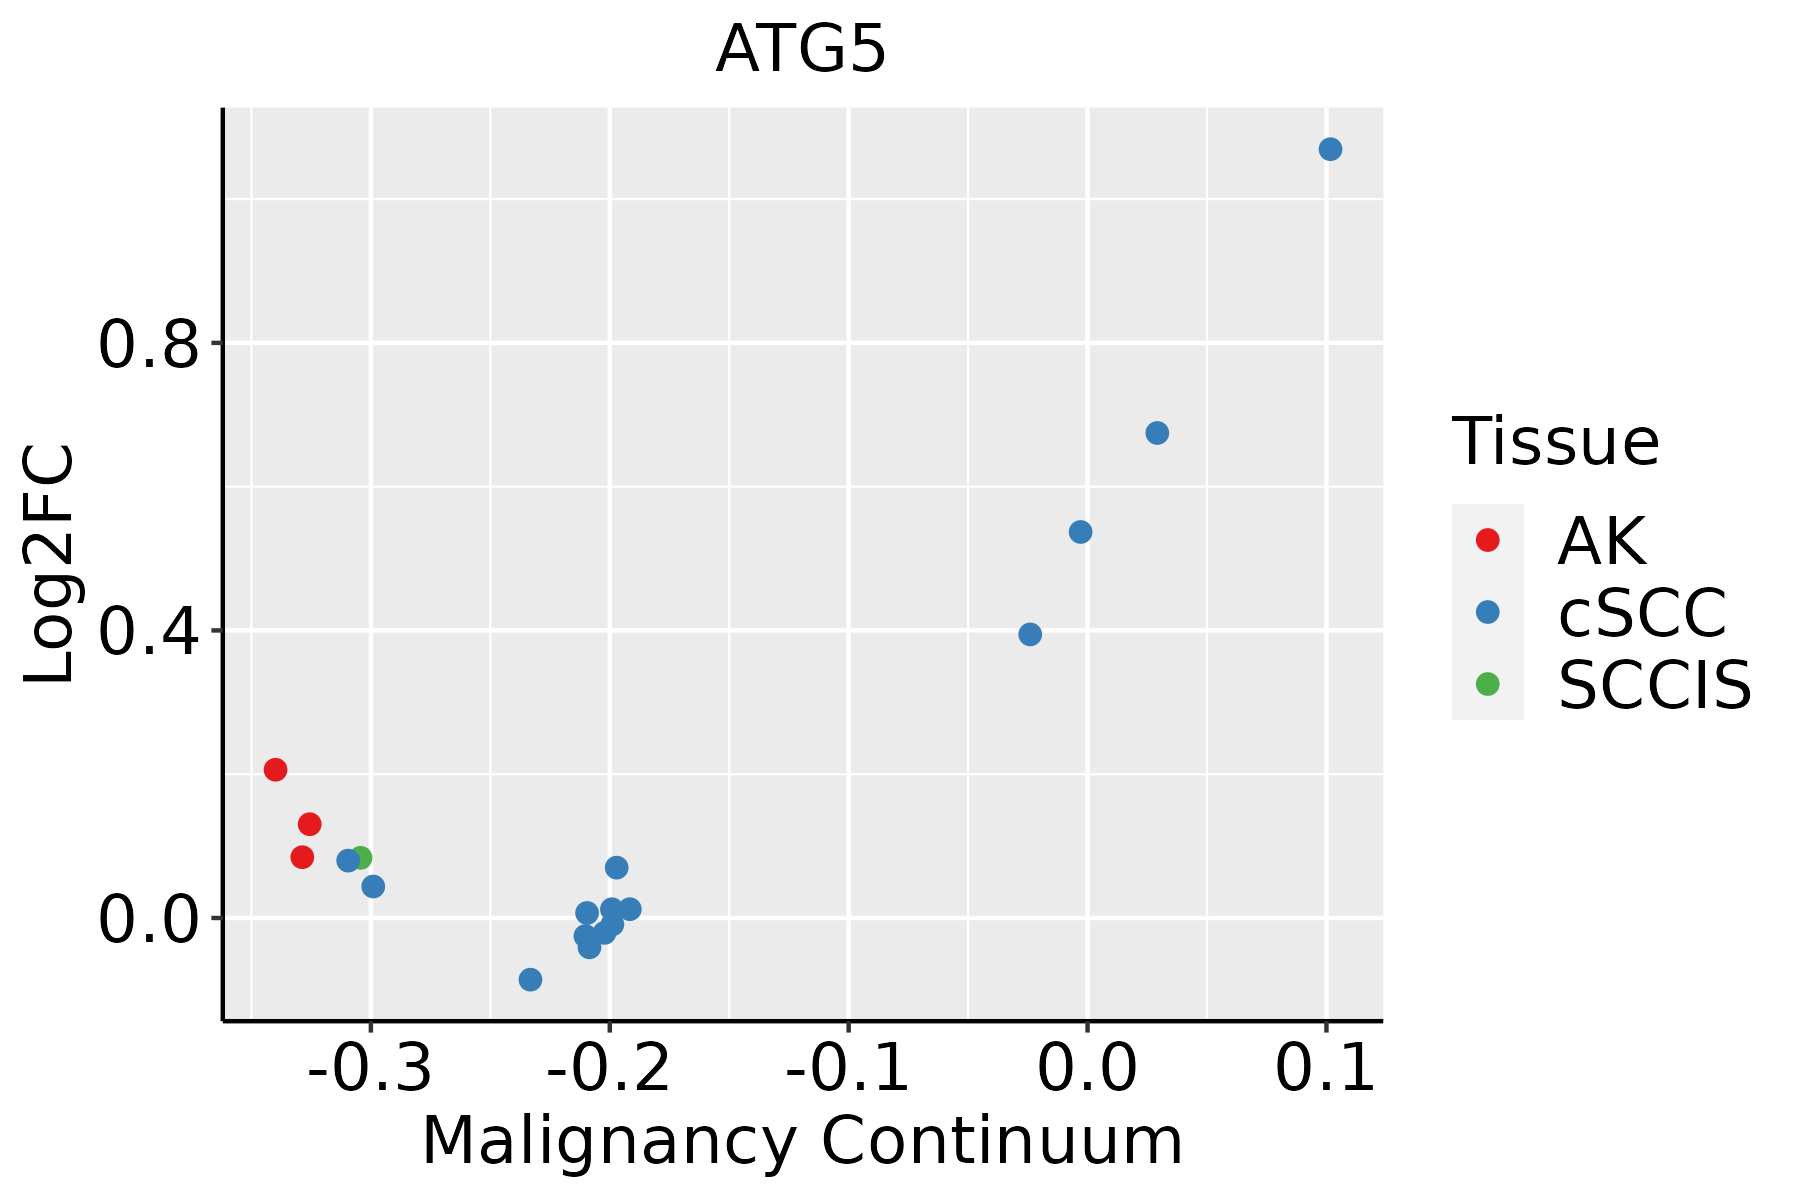 | AK: Actinic keratosis |
| cSCC: Cutaneous squamous cell carcinoma | ||
| SCCIS:squamous cell carcinoma in situ | ||
| Thyroid |  | ATC: Anaplastic thyroid cancer |
| HT: Hashimoto's thyroiditis | ||
| PTC: Papillary thyroid cancer |
| ∗log2FC in expression of this searched gene in stem-like cells from each diseased tissue sample relative to stem-like cells in normal samples in each tissue plotted against the malignancy continuum. Samples are colored based on if they are from different disease stage. |
Top |
Malignant transformation related pathway analysis |
| Find out the enriched GO biological processes and KEGG pathways involved in transition from healthy to precancer to cancer |
| Tissue | Disease Stage | Enriched GO biological Processes |
| Colorectum | AD |  |
| Colorectum | SER |  |
| Colorectum | MSS |  |
| Colorectum | MSI-H |  |
| Colorectum | FAP |  |
| ∗Top 15 enriched GO BP terms are showed in the bar plot of each disease state in each tissue. Each row represents a significant GO biological process which is colored according to the -log10(p.adjust). |
| Page: 1 2 3 4 5 6 7 8 9 |
| GO ID | Tissue | Disease Stage | Description | Gene Ratio | Bg Ratio | pvalue | p.adjust | Count |
| GO:00190791 | Colorectum | SER | viral genome replication | 37/2897 | 131/18723 | 1.36e-04 | 2.72e-03 | 37 |
| GO:20003771 | Colorectum | SER | regulation of reactive oxygen species metabolic process | 41/2897 | 157/18723 | 3.86e-04 | 5.86e-03 | 41 |
| GO:00198831 | Colorectum | SER | antigen processing and presentation of endogenous antigen | 11/2897 | 26/18723 | 9.60e-04 | 1.15e-02 | 11 |
| GO:0051051 | Colorectum | SER | negative regulation of transport | 98/2897 | 470/18723 | 1.01e-03 | 1.19e-02 | 98 |
| GO:00508781 | Colorectum | SER | regulation of body fluid levels | 81/2897 | 379/18723 | 1.28e-03 | 1.43e-02 | 81 |
| GO:00425941 | Colorectum | SER | response to starvation | 47/2897 | 197/18723 | 1.31e-03 | 1.45e-02 | 47 |
| GO:00714961 | Colorectum | SER | cellular response to external stimulus | 70/2897 | 320/18723 | 1.40e-03 | 1.53e-02 | 70 |
| GO:00075891 | Colorectum | SER | body fluid secretion | 26/2897 | 93/18723 | 1.49e-03 | 1.60e-02 | 26 |
| GO:1901984 | Colorectum | SER | negative regulation of protein acetylation | 10/2897 | 24/18723 | 1.88e-03 | 1.90e-02 | 10 |
| GO:00092671 | Colorectum | SER | cellular response to starvation | 38/2897 | 156/18723 | 2.45e-03 | 2.32e-02 | 38 |
| GO:0019882 | Colorectum | SER | antigen processing and presentation | 28/2897 | 106/18723 | 2.52e-03 | 2.34e-02 | 28 |
| GO:00310561 | Colorectum | SER | regulation of histone modification | 37/2897 | 152/18723 | 2.80e-03 | 2.50e-02 | 37 |
| GO:0032941 | Colorectum | SER | secretion by tissue | 13/2897 | 38/18723 | 3.40e-03 | 2.90e-02 | 13 |
| GO:01200321 | Colorectum | SER | regulation of plasma membrane bounded cell projection assembly | 43/2897 | 186/18723 | 3.82e-03 | 3.16e-02 | 43 |
| GO:00316681 | Colorectum | SER | cellular response to extracellular stimulus | 54/2897 | 246/18723 | 4.26e-03 | 3.45e-02 | 54 |
| GO:0060491 | Colorectum | SER | regulation of cell projection assembly | 43/2897 | 188/18723 | 4.68e-03 | 3.70e-02 | 43 |
| GO:00316691 | Colorectum | SER | cellular response to nutrient levels | 48/2897 | 215/18723 | 4.82e-03 | 3.78e-02 | 48 |
| GO:00510471 | Colorectum | SER | positive regulation of secretion | 65/2897 | 310/18723 | 5.71e-03 | 4.19e-02 | 65 |
| GO:2000757 | Colorectum | SER | negative regulation of peptidyl-lysine acetylation | 8/2897 | 20/18723 | 7.14e-03 | 4.99e-02 | 8 |
| GO:00516511 | Colorectum | SER | maintenance of location in cell | 47/2897 | 214/18723 | 7.20e-03 | 4.99e-02 | 47 |
| Page: 1 2 3 4 5 6 7 8 9 10 11 12 13 14 15 16 17 18 19 20 21 22 23 24 25 26 27 28 29 30 31 32 33 34 35 36 37 38 39 40 41 42 43 44 45 |
| Pathway ID | Tissue | Disease Stage | Description | Gene Ratio | Bg Ratio | pvalue | p.adjust | qvalue | Count |
| hsa0513120 | Cervix | CC | Shigellosis | 69/1267 | 247/8465 | 7.64e-08 | 1.03e-06 | 6.10e-07 | 69 |
| hsa0413718 | Cervix | CC | Mitophagy - animal | 22/1267 | 72/8465 | 5.77e-04 | 2.75e-03 | 1.63e-03 | 22 |
| hsa0421614 | Cervix | CC | Ferroptosis | 14/1267 | 41/8465 | 1.75e-03 | 7.21e-03 | 4.26e-03 | 14 |
| hsa046213 | Cervix | CC | NOD-like receptor signaling pathway | 41/1267 | 186/8465 | 5.90e-03 | 1.95e-02 | 1.15e-02 | 41 |
| hsa05131110 | Cervix | CC | Shigellosis | 69/1267 | 247/8465 | 7.64e-08 | 1.03e-06 | 6.10e-07 | 69 |
| hsa0413719 | Cervix | CC | Mitophagy - animal | 22/1267 | 72/8465 | 5.77e-04 | 2.75e-03 | 1.63e-03 | 22 |
| hsa0421615 | Cervix | CC | Ferroptosis | 14/1267 | 41/8465 | 1.75e-03 | 7.21e-03 | 4.26e-03 | 14 |
| hsa0462112 | Cervix | CC | NOD-like receptor signaling pathway | 41/1267 | 186/8465 | 5.90e-03 | 1.95e-02 | 1.15e-02 | 41 |
| hsa05131 | Colorectum | AD | Shigellosis | 109/2092 | 247/8465 | 1.09e-11 | 2.44e-10 | 1.55e-10 | 109 |
| hsa04216 | Colorectum | AD | Ferroptosis | 21/2092 | 41/8465 | 2.23e-04 | 1.78e-03 | 1.13e-03 | 21 |
| hsa04213 | Colorectum | AD | Longevity regulating pathway - multiple species | 27/2092 | 62/8465 | 8.72e-04 | 5.96e-03 | 3.80e-03 | 27 |
| hsa04137 | Colorectum | AD | Mitophagy - animal | 29/2092 | 72/8465 | 2.49e-03 | 1.35e-02 | 8.59e-03 | 29 |
| hsa04140 | Colorectum | AD | Autophagy - animal | 49/2092 | 141/8465 | 4.58e-03 | 2.20e-02 | 1.40e-02 | 49 |
| hsa04211 | Colorectum | AD | Longevity regulating pathway | 33/2092 | 89/8465 | 6.15e-03 | 2.68e-02 | 1.71e-02 | 33 |
| hsa051311 | Colorectum | AD | Shigellosis | 109/2092 | 247/8465 | 1.09e-11 | 2.44e-10 | 1.55e-10 | 109 |
| hsa042161 | Colorectum | AD | Ferroptosis | 21/2092 | 41/8465 | 2.23e-04 | 1.78e-03 | 1.13e-03 | 21 |
| hsa042131 | Colorectum | AD | Longevity regulating pathway - multiple species | 27/2092 | 62/8465 | 8.72e-04 | 5.96e-03 | 3.80e-03 | 27 |
| hsa041371 | Colorectum | AD | Mitophagy - animal | 29/2092 | 72/8465 | 2.49e-03 | 1.35e-02 | 8.59e-03 | 29 |
| hsa041401 | Colorectum | AD | Autophagy - animal | 49/2092 | 141/8465 | 4.58e-03 | 2.20e-02 | 1.40e-02 | 49 |
| hsa042111 | Colorectum | AD | Longevity regulating pathway | 33/2092 | 89/8465 | 6.15e-03 | 2.68e-02 | 1.71e-02 | 33 |
| Page: 1 2 3 4 5 6 7 |
Top |
Cell-cell communication analysis |
| Identification of potential cell-cell interactions between two cell types and their ligand-receptor pairs for different disease states |
| Ligand | Receptor | LRpair | Pathway | Tissue | Disease Stage |
| Page: 1 |
Top |
Single-cell gene regulatory network inference analysis |
| Find out the significant the regulons (TFs) and the target genes of each regulon across cell types for different disease states |
| TF | Cell Type | Tissue | Disease Stage | Target Gene | RSS | Regulon Activity |
| ∗The dot plots of a searched regulon are shown for all cell subpopulations in each disease state of each tissue based on the regulon specific score inferred using pySCENIC and by calculating the average expression. |
| Page: 1 |
Top |
Somatic mutation of malignant transformation related genes |
| Annotation of somatic variants for genes involved in malignant transformation |
| Hugo Symbol | Variant Class | Variant Classification | dbSNP RS | HGVSc | HGVSp | HGVSp Short | SWISSPROT | BIOTYPE | SIFT | PolyPhen | Tumor Sample Barcode | Tissue | Histology | Sex | Age | Stage | Therapy Types | Drugs | Outcome |
| ATG5 | SNV | Missense_Mutation | c.286C>G | p.Leu96Val | p.L96V | Q9H1Y0 | protein_coding | deleterious(0.02) | probably_damaging(0.925) | TCGA-A2-A0SY-01 | Breast | breast invasive carcinoma | Female | <65 | III/IV | Hormone Therapy | arimidex | SD | |
| ATG5 | SNV | Missense_Mutation | c.793C>T | p.Leu265Phe | p.L265F | Q9H1Y0 | protein_coding | deleterious(0) | probably_damaging(0.988) | TCGA-AC-A23H-01 | Breast | breast invasive carcinoma | Female | >=65 | I/II | Unknown | Unknown | PD | |
| ATG5 | insertion | Frame_Shift_Ins | novel | c.801_802insGGCCTAAGAAGAAAATGGA | p.Ser268GlyfsTer22 | p.S268Gfs*22 | Q9H1Y0 | protein_coding | TCGA-A7-A0CE-01 | Breast | breast invasive carcinoma | Female | <65 | I/II | Chemotherapy | adriamycin | SD | ||
| ATG5 | insertion | In_Frame_Ins | novel | c.799_800insATGAAGCTGAAACCT | p.Ile267delinsAsnGluAlaGluThrPhe | p.I267delinsNEAETF | Q9H1Y0 | protein_coding | TCGA-A7-A0CE-01 | Breast | breast invasive carcinoma | Female | <65 | I/II | Chemotherapy | adriamycin | SD | ||
| ATG5 | deletion | Frame_Shift_Del | novel | c.452delN | p.Lys151SerfsTer65 | p.K151Sfs*65 | Q9H1Y0 | protein_coding | TCGA-D8-A27V-01 | Breast | breast invasive carcinoma | Female | <65 | I/II | Hormone Therapy | tamoxiphen | SD | ||
| ATG5 | SNV | Missense_Mutation | c.397G>A | p.Asp133Asn | p.D133N | Q9H1Y0 | protein_coding | deleterious(0.03) | probably_damaging(0.919) | TCGA-Q1-A73O-01 | Cervix | cervical & endocervical cancer | Female | <65 | I/II | Chemotherapy | cisplatin | CR | |
| ATG5 | SNV | Missense_Mutation | c.32T>C | p.Val11Ala | p.V11A | Q9H1Y0 | protein_coding | deleterious(0) | possibly_damaging(0.83) | TCGA-A6-2679-01 | Colorectum | colon adenocarcinoma | Female | >=65 | I/II | Unknown | Unknown | SD | |
| ATG5 | SNV | Missense_Mutation | c.793C>A | p.Leu265Ile | p.L265I | Q9H1Y0 | protein_coding | tolerated(0.06) | possibly_damaging(0.609) | TCGA-AA-3977-01 | Colorectum | colon adenocarcinoma | Male | >=65 | I/II | Unknown | Unknown | SD | |
| ATG5 | SNV | Missense_Mutation | c.16G>T | p.Asp6Tyr | p.D6Y | Q9H1Y0 | protein_coding | deleterious(0) | possibly_damaging(0.894) | TCGA-AA-3977-01 | Colorectum | colon adenocarcinoma | Male | >=65 | I/II | Unknown | Unknown | SD | |
| ATG5 | SNV | Missense_Mutation | c.688N>A | p.Glu230Lys | p.E230K | Q9H1Y0 | protein_coding | tolerated(0.24) | benign(0.005) | TCGA-AA-A017-01 | Colorectum | colon adenocarcinoma | Female | <65 | I/II | Unknown | Unknown | SD |
| Page: 1 2 3 4 |
Top |
Related drugs of malignant transformation related genes |
| Identification of chemicals and drugs interact with genes involved in malignant transfromation |
| (DGIdb 4.0) |
| Entrez ID | Symbol | Category | Interaction Types | Drug Claim Name | Drug Name | PMIDs |
| 9474 | ATG5 | CLINICALLY ACTIONABLE, TRANSPORTER, ENZYME | adalimumab | ADALIMUMAB | 27096233 |
| Page: 1 |

Copyright 2023-Present -The University of Texas Health Science Center at Houston |