
|
|||||
|
 | |
| |
| |
| |
| |
| |
|
Gene: ADPGK |
Gene summary for ADPGK |
| Gene information | Species | Human | Gene symbol | ADPGK | Gene ID | 83440 |
| Gene name | ADP dependent glucokinase | |
| Gene Alias | 2610017G09Rik | |
| Cytomap | 15q24.1 | |
| Gene Type | protein-coding | GO ID | GO:0005975 | UniProtAcc | Q9BRR6 |
Top |
Malignant transformation analysis |
| Identification of the aberrant gene expression in precancerous and cancerous lesions by comparing the gene expression of stem-like cells in diseased tissues with normal stem cells |
| Entrez ID | Symbol | Replicates | Species | Organ | Tissue | Adj P-value | Log2FC | Malignancy |
| 83440 | ADPGK | LZE4T | Human | Esophagus | ESCC | 2.01e-09 | 2.02e-01 | 0.0811 |
| 83440 | ADPGK | LZE5T | Human | Esophagus | ESCC | 2.36e-06 | 2.66e-01 | 0.0514 |
| 83440 | ADPGK | LZE7T | Human | Esophagus | ESCC | 9.47e-07 | 3.80e-01 | 0.0667 |
| 83440 | ADPGK | LZE20T | Human | Esophagus | ESCC | 7.82e-05 | 1.33e-01 | 0.0662 |
| 83440 | ADPGK | LZE24T | Human | Esophagus | ESCC | 1.78e-15 | 2.58e-01 | 0.0596 |
| 83440 | ADPGK | LZE21T | Human | Esophagus | ESCC | 1.59e-03 | 1.57e-01 | 0.0655 |
| 83440 | ADPGK | P1T-E | Human | Esophagus | ESCC | 1.47e-07 | 3.18e-01 | 0.0875 |
| 83440 | ADPGK | P2T-E | Human | Esophagus | ESCC | 6.71e-25 | 3.91e-01 | 0.1177 |
| 83440 | ADPGK | P4T-E | Human | Esophagus | ESCC | 1.15e-32 | 6.71e-01 | 0.1323 |
| 83440 | ADPGK | P5T-E | Human | Esophagus | ESCC | 5.30e-09 | 1.16e-01 | 0.1327 |
| 83440 | ADPGK | P8T-E | Human | Esophagus | ESCC | 1.14e-32 | 4.50e-01 | 0.0889 |
| 83440 | ADPGK | P9T-E | Human | Esophagus | ESCC | 6.94e-22 | 3.98e-01 | 0.1131 |
| 83440 | ADPGK | P10T-E | Human | Esophagus | ESCC | 3.45e-42 | 6.01e-01 | 0.116 |
| 83440 | ADPGK | P11T-E | Human | Esophagus | ESCC | 1.08e-14 | 6.19e-01 | 0.1426 |
| 83440 | ADPGK | P12T-E | Human | Esophagus | ESCC | 1.72e-28 | 4.82e-01 | 0.1122 |
| 83440 | ADPGK | P15T-E | Human | Esophagus | ESCC | 5.63e-33 | 5.93e-01 | 0.1149 |
| 83440 | ADPGK | P16T-E | Human | Esophagus | ESCC | 5.52e-26 | 5.38e-01 | 0.1153 |
| 83440 | ADPGK | P17T-E | Human | Esophagus | ESCC | 7.92e-09 | 2.90e-01 | 0.1278 |
| 83440 | ADPGK | P19T-E | Human | Esophagus | ESCC | 2.97e-09 | 4.75e-01 | 0.1662 |
| 83440 | ADPGK | P20T-E | Human | Esophagus | ESCC | 3.10e-21 | 4.74e-01 | 0.1124 |
| Page: 1 2 3 4 5 6 |
| Tissue | Expression Dynamics | Abbreviation |
| Esophagus | 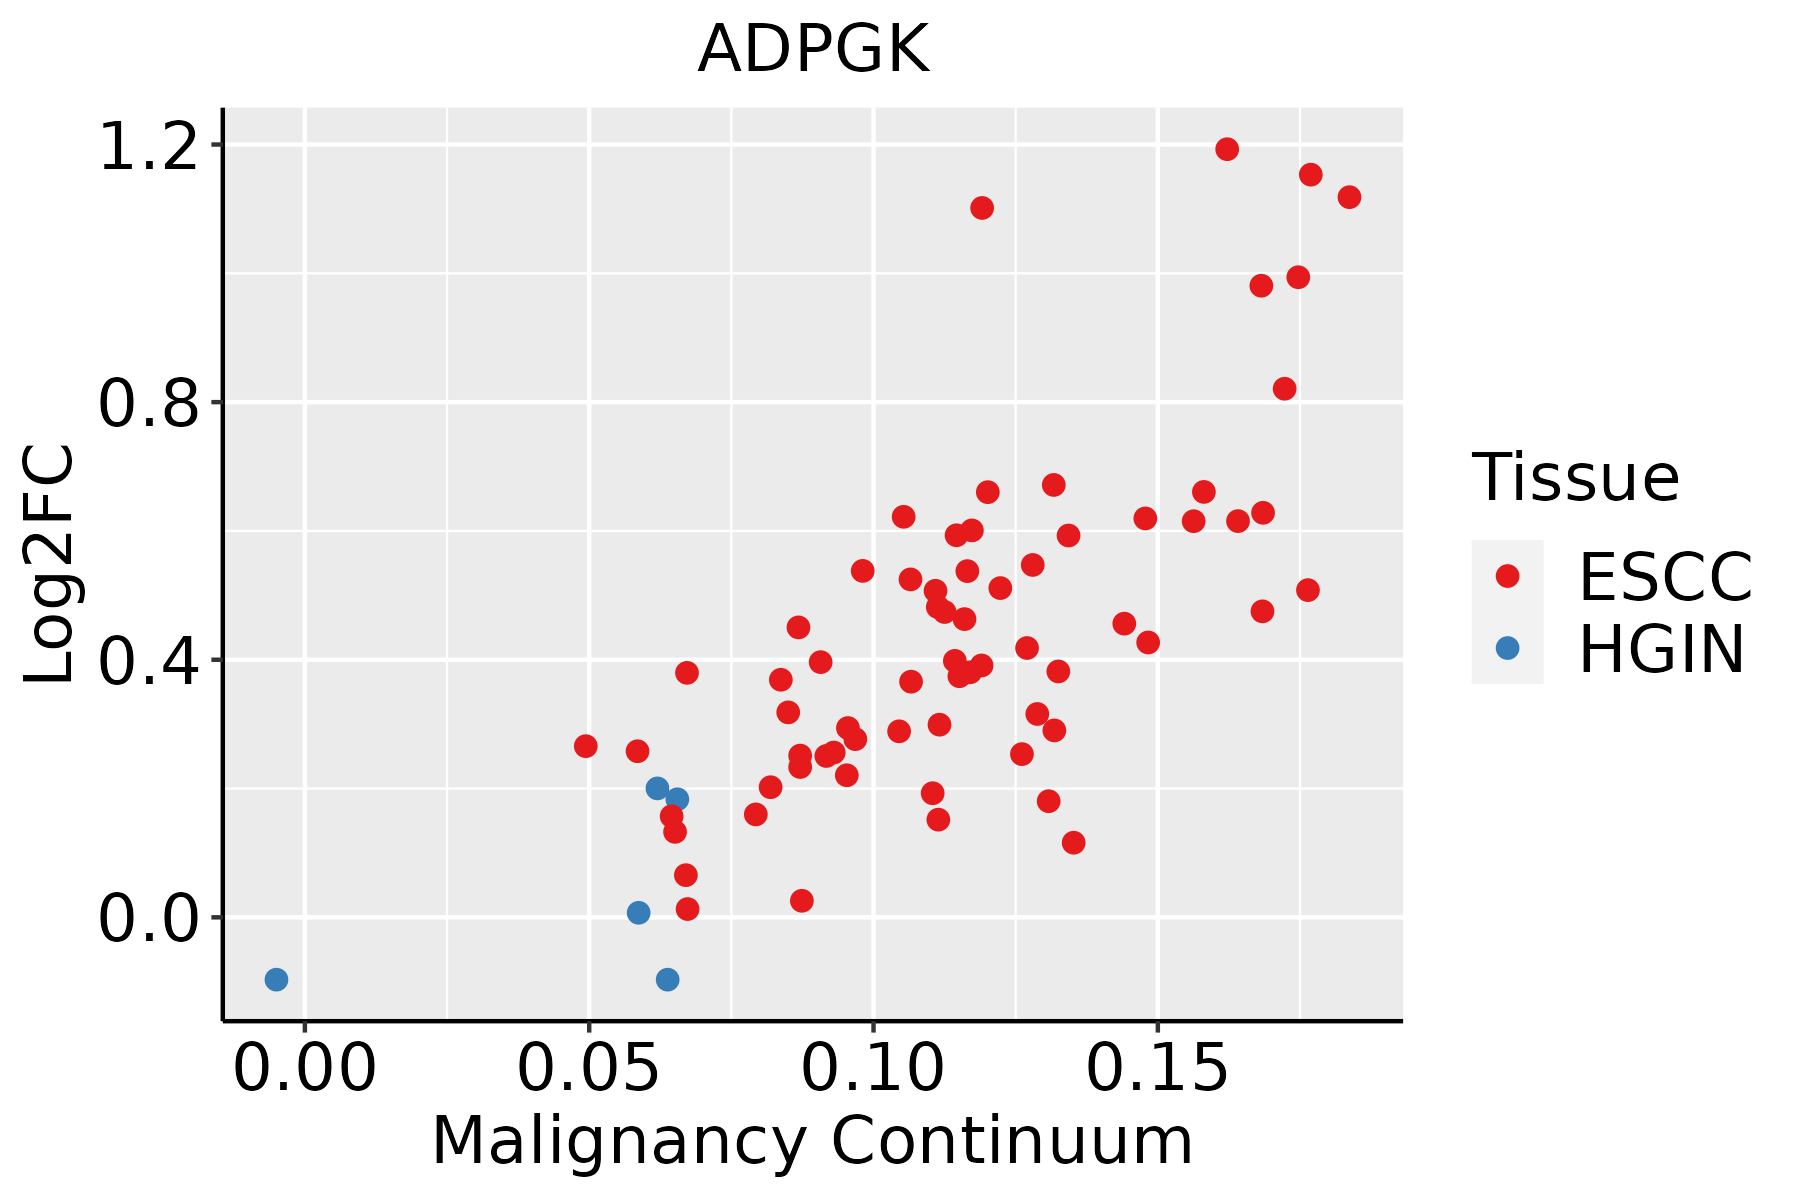 | ESCC: Esophageal squamous cell carcinoma |
| HGIN: High-grade intraepithelial neoplasias | ||
| LGIN: Low-grade intraepithelial neoplasias | ||
| Liver | 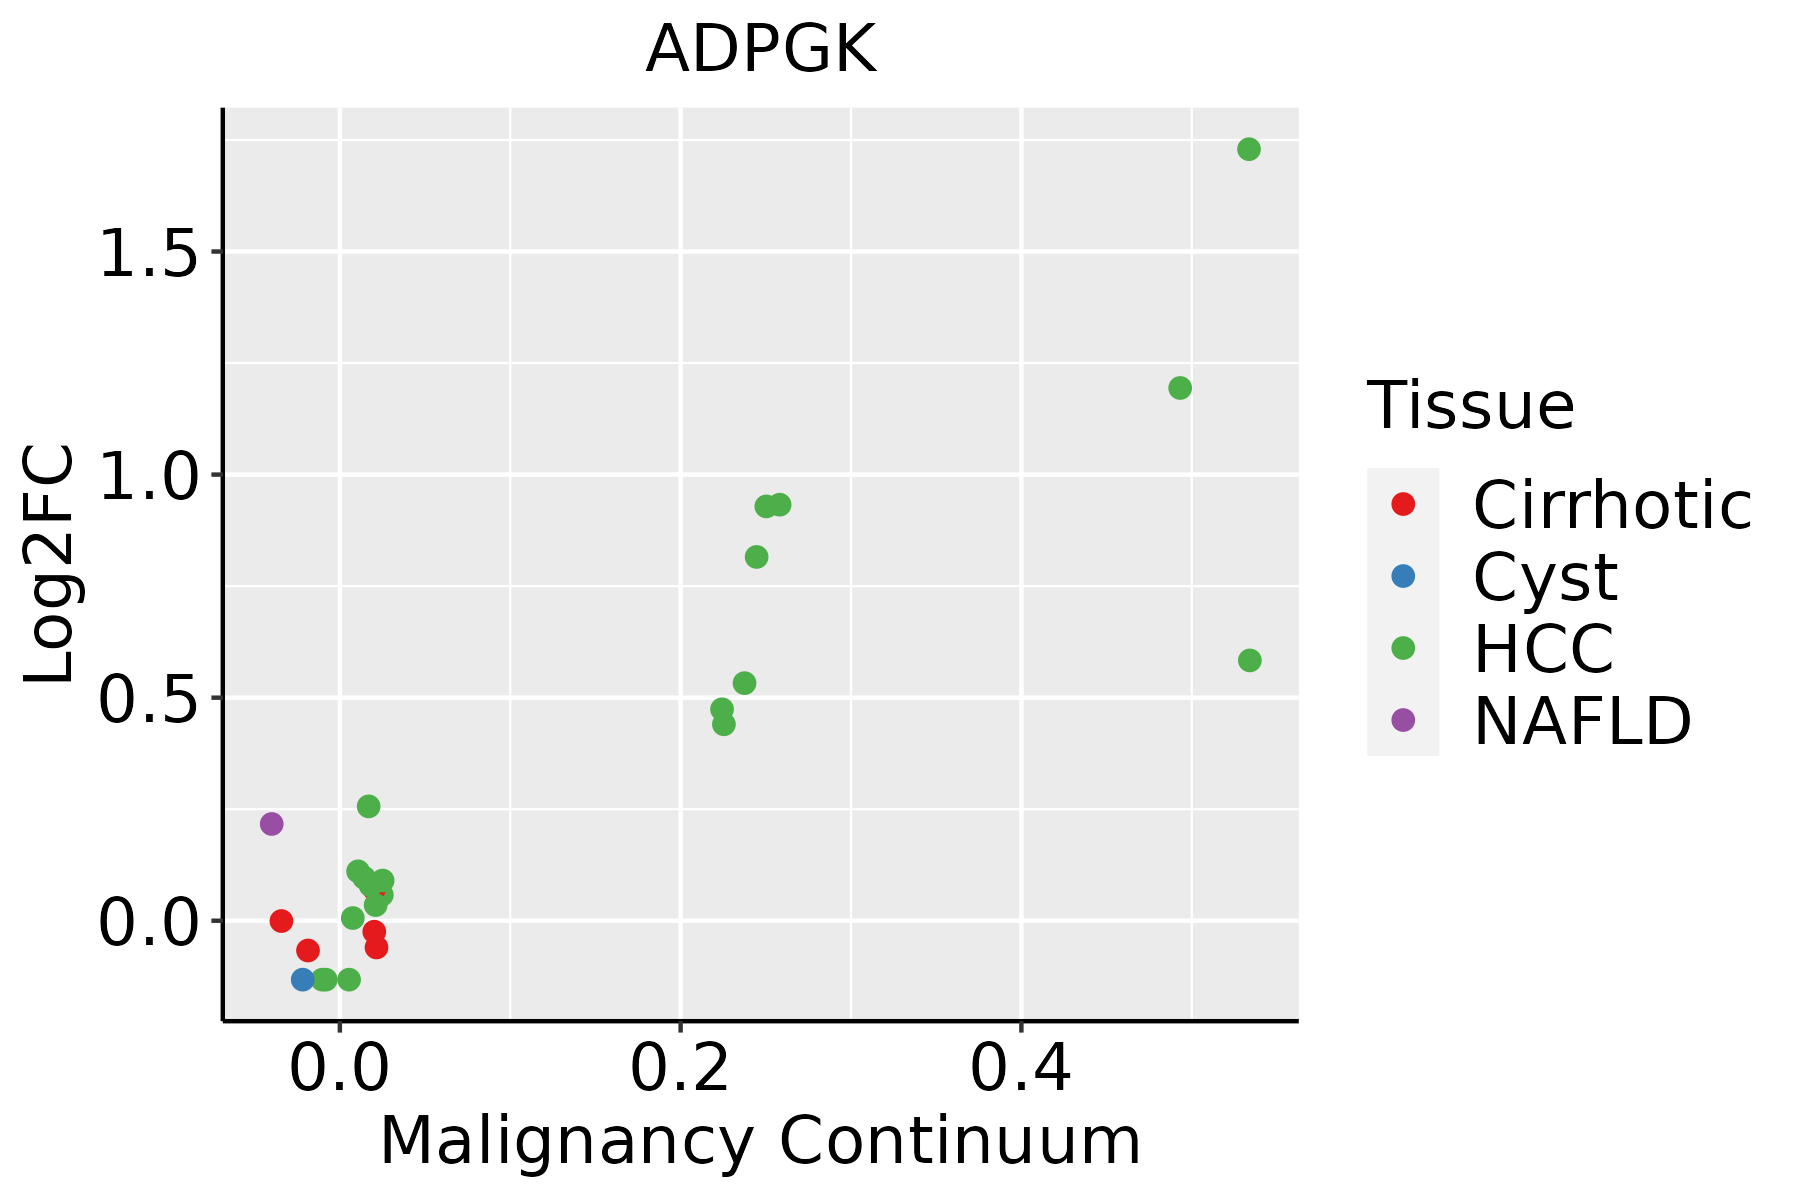 | HCC: Hepatocellular carcinoma |
| NAFLD: Non-alcoholic fatty liver disease | ||
| Oral Cavity |  | EOLP: Erosive Oral lichen planus |
| LP: leukoplakia | ||
| NEOLP: Non-erosive oral lichen planus | ||
| OSCC: Oral squamous cell carcinoma | ||
| Prostate | 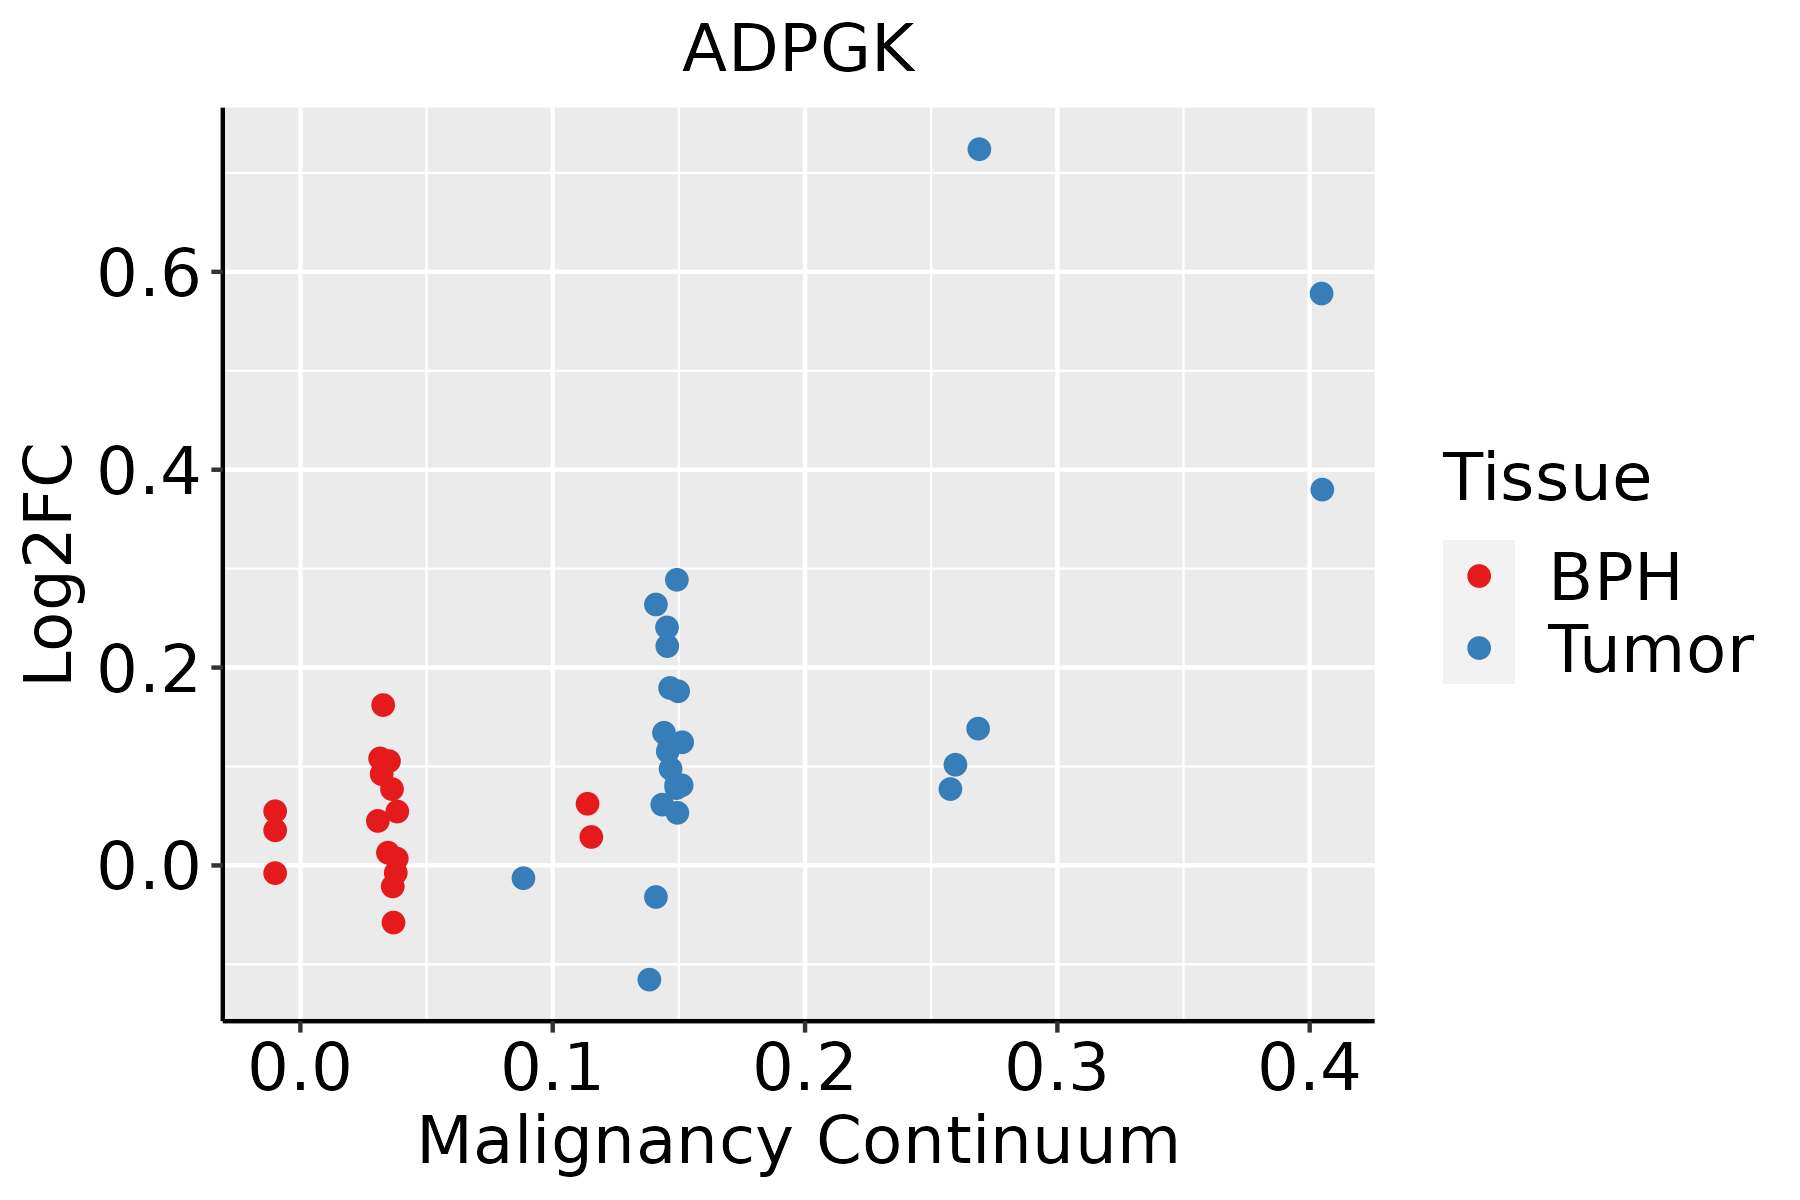 | BPH: Benign Prostatic Hyperplasia |
| Skin | 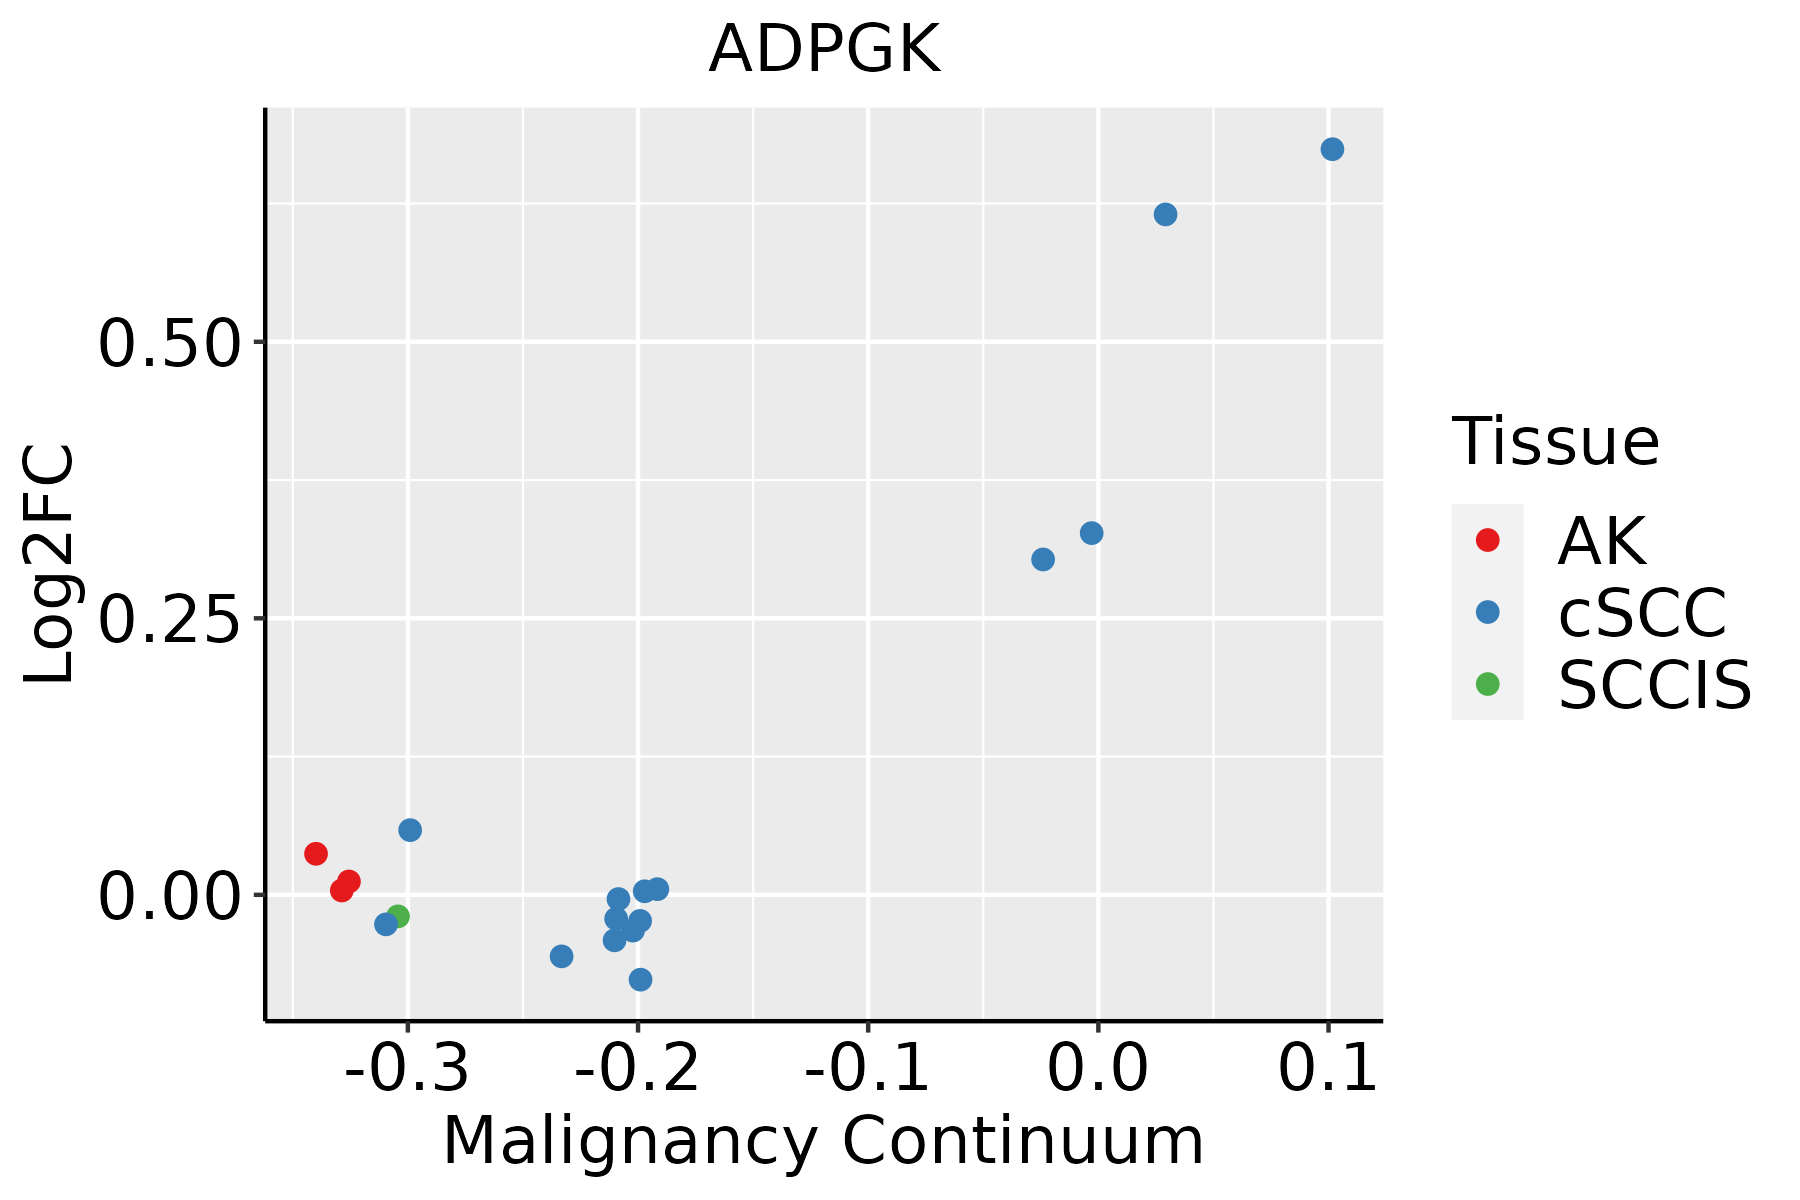 | AK: Actinic keratosis |
| cSCC: Cutaneous squamous cell carcinoma | ||
| SCCIS:squamous cell carcinoma in situ | ||
| Thyroid | 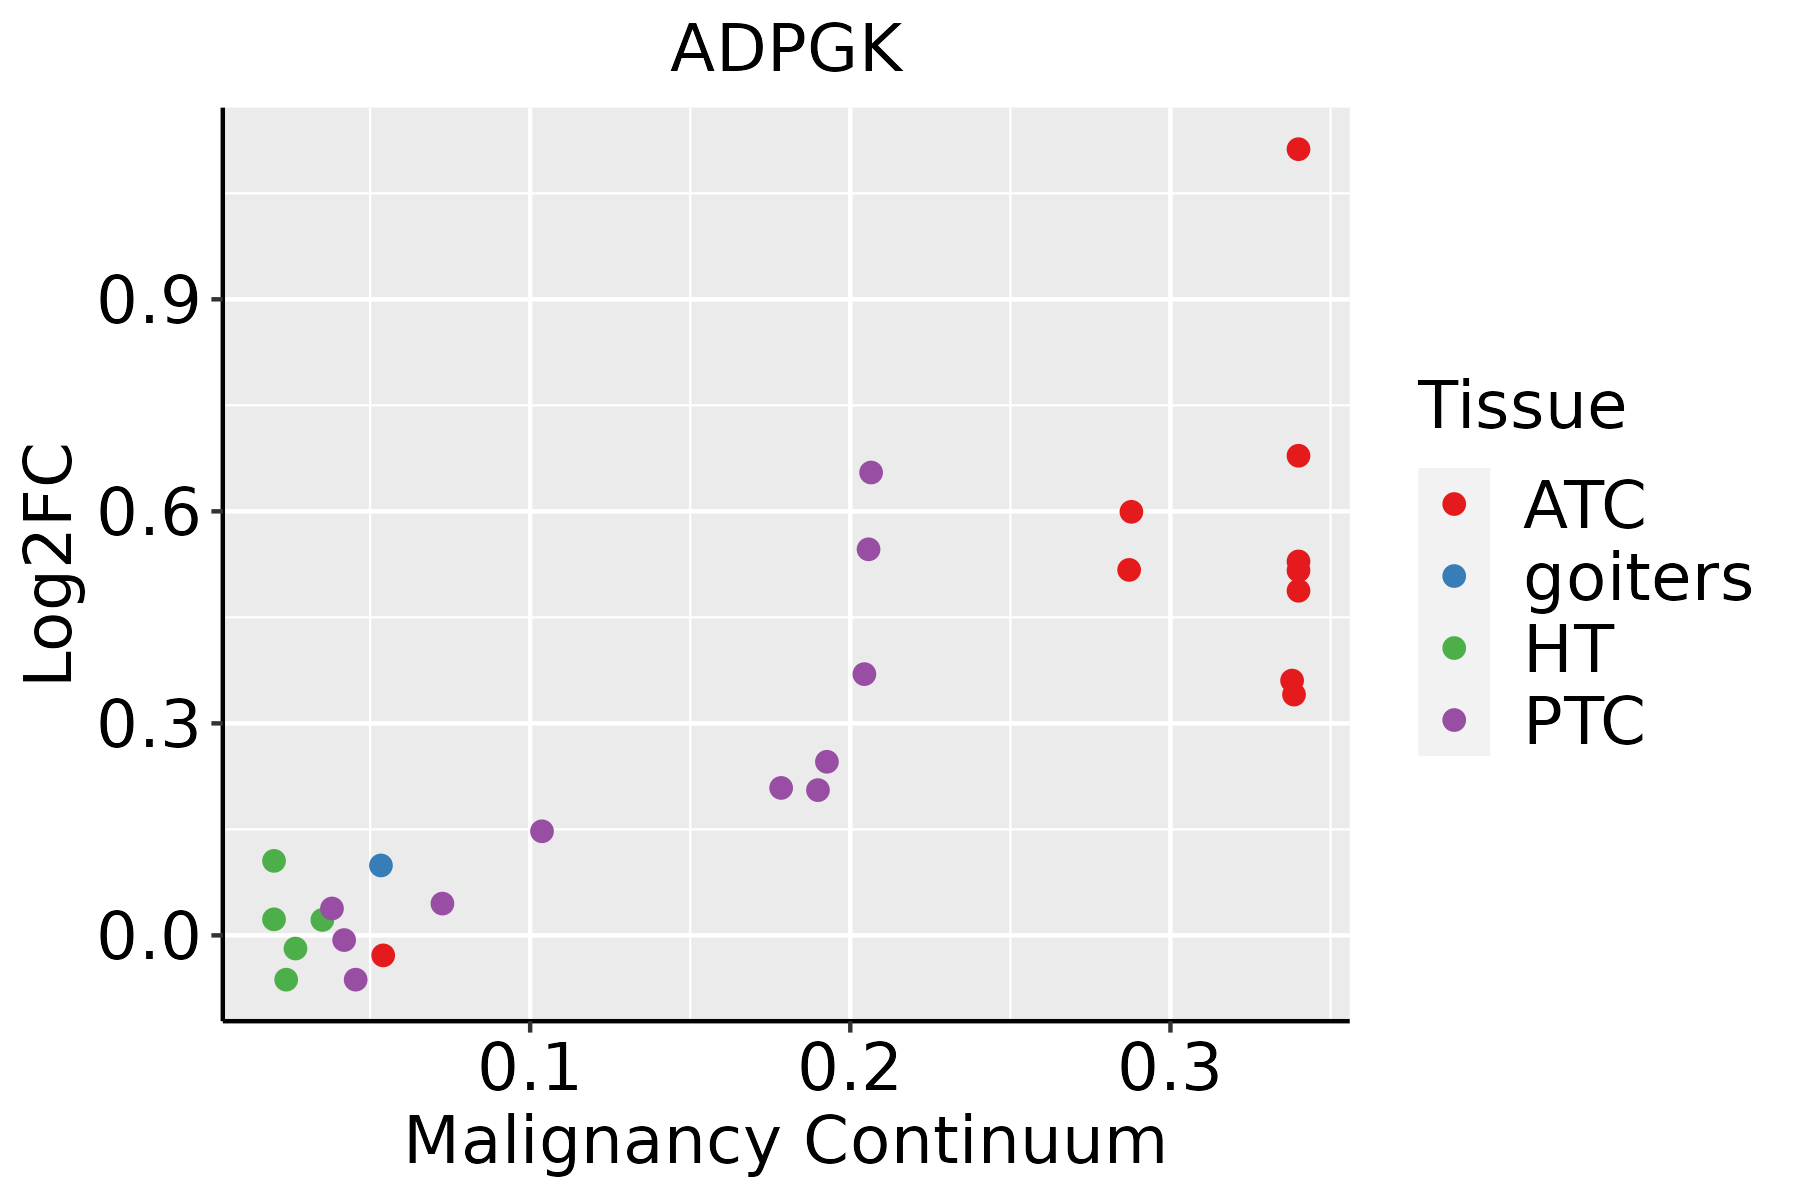 | ATC: Anaplastic thyroid cancer |
| HT: Hashimoto's thyroiditis | ||
| PTC: Papillary thyroid cancer |
| ∗log2FC in expression of this searched gene in stem-like cells from each diseased tissue sample relative to stem-like cells in normal samples in each tissue plotted against the malignancy continuum. Samples are colored based on if they are from different disease stage. |
Top |
Malignant transformation related pathway analysis |
| Find out the enriched GO biological processes and KEGG pathways involved in transition from healthy to precancer to cancer |
| Tissue | Disease Stage | Enriched GO biological Processes |
| Colorectum | AD |  |
| Colorectum | SER |  |
| Colorectum | MSS |  |
| Colorectum | MSI-H |  |
| Colorectum | FAP |  |
| ∗Top 15 enriched GO BP terms are showed in the bar plot of each disease state in each tissue. Each row represents a significant GO biological process which is colored according to the -log10(p.adjust). |
| Page: 1 2 3 4 5 6 7 8 9 |
| GO ID | Tissue | Disease Stage | Description | Gene Ratio | Bg Ratio | pvalue | p.adjust | Count |
| GO:000913224 | Oral cavity | EOLP | nucleoside diphosphate metabolic process | 27/2218 | 124/18723 | 1.19e-03 | 8.62e-03 | 27 |
| GO:000609018 | Oral cavity | EOLP | pyruvate metabolic process | 24/2218 | 106/18723 | 1.24e-03 | 8.90e-03 | 24 |
| GO:000609125 | Oral cavity | EOLP | generation of precursor metabolites and energy | 79/2218 | 490/18723 | 2.65e-03 | 1.59e-02 | 79 |
| GO:006162011 | Oral cavity | EOLP | glycolytic process through glucose-6-phosphate | 5/2218 | 12/18723 | 8.97e-03 | 4.12e-02 | 5 |
| GO:004603433 | Oral cavity | NEOLP | ATP metabolic process | 71/2005 | 277/18723 | 1.44e-12 | 3.17e-10 | 71 |
| GO:000913532 | Oral cavity | NEOLP | purine nucleoside diphosphate metabolic process | 26/2005 | 103/18723 | 2.31e-05 | 3.72e-04 | 26 |
| GO:000917932 | Oral cavity | NEOLP | purine ribonucleoside diphosphate metabolic process | 26/2005 | 103/18723 | 2.31e-05 | 3.72e-04 | 26 |
| GO:000609133 | Oral cavity | NEOLP | generation of precursor metabolites and energy | 82/2005 | 490/18723 | 2.70e-05 | 4.22e-04 | 82 |
| GO:000918532 | Oral cavity | NEOLP | ribonucleoside diphosphate metabolic process | 26/2005 | 106/18723 | 3.95e-05 | 5.62e-04 | 26 |
| GO:000913232 | Oral cavity | NEOLP | nucleoside diphosphate metabolic process | 27/2005 | 124/18723 | 2.46e-04 | 2.54e-03 | 27 |
| GO:000609624 | Oral cavity | NEOLP | glycolytic process | 20/2005 | 81/18723 | 2.69e-04 | 2.71e-03 | 20 |
| GO:000675724 | Oral cavity | NEOLP | ATP generation from ADP | 20/2005 | 82/18723 | 3.21e-04 | 3.11e-03 | 20 |
| GO:004693932 | Oral cavity | NEOLP | nucleotide phosphorylation | 23/2005 | 101/18723 | 3.50e-04 | 3.37e-03 | 23 |
| GO:004603132 | Oral cavity | NEOLP | ADP metabolic process | 21/2005 | 90/18723 | 4.39e-04 | 3.97e-03 | 21 |
| GO:000616532 | Oral cavity | NEOLP | nucleoside diphosphate phosphorylation | 22/2005 | 99/18723 | 6.64e-04 | 5.54e-03 | 22 |
| GO:000915025 | Oral cavity | NEOLP | purine ribonucleotide metabolic process | 55/2005 | 368/18723 | 6.80e-03 | 3.46e-02 | 55 |
| GO:000925925 | Oral cavity | NEOLP | ribonucleotide metabolic process | 57/2005 | 385/18723 | 7.23e-03 | 3.66e-02 | 57 |
| GO:000609024 | Oral cavity | NEOLP | pyruvate metabolic process | 20/2005 | 106/18723 | 8.31e-03 | 4.08e-02 | 20 |
| GO:001969325 | Oral cavity | NEOLP | ribose phosphate metabolic process | 58/2005 | 396/18723 | 8.46e-03 | 4.13e-02 | 58 |
| GO:004603419 | Prostate | Tumor | ATP metabolic process | 122/3246 | 277/18723 | 1.71e-25 | 5.33e-22 | 122 |
| Page: 1 2 3 4 5 6 7 8 9 10 11 |
| Pathway ID | Tissue | Disease Stage | Description | Gene Ratio | Bg Ratio | pvalue | p.adjust | qvalue | Count |
| hsa0120023 | Esophagus | ESCC | Carbon metabolism | 79/4205 | 115/8465 | 2.50e-05 | 1.21e-04 | 6.22e-05 | 79 |
| hsa0001016 | Esophagus | ESCC | Glycolysis / Gluconeogenesis | 42/4205 | 67/8465 | 2.15e-02 | 4.78e-02 | 2.45e-02 | 42 |
| hsa0120033 | Esophagus | ESCC | Carbon metabolism | 79/4205 | 115/8465 | 2.50e-05 | 1.21e-04 | 6.22e-05 | 79 |
| hsa0001017 | Esophagus | ESCC | Glycolysis / Gluconeogenesis | 42/4205 | 67/8465 | 2.15e-02 | 4.78e-02 | 2.45e-02 | 42 |
| hsa0120041 | Liver | HCC | Carbon metabolism | 89/4020 | 115/8465 | 3.92e-11 | 6.56e-10 | 3.65e-10 | 89 |
| hsa0001022 | Liver | HCC | Glycolysis / Gluconeogenesis | 43/4020 | 67/8465 | 4.26e-03 | 1.29e-02 | 7.15e-03 | 43 |
| hsa0120051 | Liver | HCC | Carbon metabolism | 89/4020 | 115/8465 | 3.92e-11 | 6.56e-10 | 3.65e-10 | 89 |
| hsa0001032 | Liver | HCC | Glycolysis / Gluconeogenesis | 43/4020 | 67/8465 | 4.26e-03 | 1.29e-02 | 7.15e-03 | 43 |
| hsa0120014 | Oral cavity | OSCC | Carbon metabolism | 74/3704 | 115/8465 | 6.10e-06 | 3.05e-05 | 1.55e-05 | 74 |
| hsa0001014 | Oral cavity | OSCC | Glycolysis / Gluconeogenesis | 40/3704 | 67/8465 | 6.08e-03 | 1.44e-02 | 7.31e-03 | 40 |
| hsa0120015 | Oral cavity | OSCC | Carbon metabolism | 74/3704 | 115/8465 | 6.10e-06 | 3.05e-05 | 1.55e-05 | 74 |
| hsa0001015 | Oral cavity | OSCC | Glycolysis / Gluconeogenesis | 40/3704 | 67/8465 | 6.08e-03 | 1.44e-02 | 7.31e-03 | 40 |
| hsa0120022 | Oral cavity | LP | Carbon metabolism | 62/2418 | 115/8465 | 8.38e-09 | 1.39e-07 | 8.99e-08 | 62 |
| hsa0001023 | Oral cavity | LP | Glycolysis / Gluconeogenesis | 28/2418 | 67/8465 | 1.36e-02 | 4.44e-02 | 2.86e-02 | 28 |
| hsa0120032 | Oral cavity | LP | Carbon metabolism | 62/2418 | 115/8465 | 8.38e-09 | 1.39e-07 | 8.99e-08 | 62 |
| hsa0001033 | Oral cavity | LP | Glycolysis / Gluconeogenesis | 28/2418 | 67/8465 | 1.36e-02 | 4.44e-02 | 2.86e-02 | 28 |
| Page: 1 |
Top |
Cell-cell communication analysis |
| Identification of potential cell-cell interactions between two cell types and their ligand-receptor pairs for different disease states |
| Ligand | Receptor | LRpair | Pathway | Tissue | Disease Stage |
| Page: 1 |
Top |
Single-cell gene regulatory network inference analysis |
| Find out the significant the regulons (TFs) and the target genes of each regulon across cell types for different disease states |
| TF | Cell Type | Tissue | Disease Stage | Target Gene | RSS | Regulon Activity |
| ∗The dot plots of a searched regulon are shown for all cell subpopulations in each disease state of each tissue based on the regulon specific score inferred using pySCENIC and by calculating the average expression. |
| Page: 1 |
Top |
Somatic mutation of malignant transformation related genes |
| Annotation of somatic variants for genes involved in malignant transformation |
| Hugo Symbol | Variant Class | Variant Classification | dbSNP RS | HGVSc | HGVSp | HGVSp Short | SWISSPROT | BIOTYPE | SIFT | PolyPhen | Tumor Sample Barcode | Tissue | Histology | Sex | Age | Stage | Therapy Types | Drugs | Outcome |
| ADPGK | SNV | Missense_Mutation | rs192015434 | c.535N>A | p.Gly179Ser | p.G179S | Q9BRR6 | protein_coding | deleterious(0.01) | probably_damaging(0.994) | TCGA-A2-A0D4-01 | Breast | breast invasive carcinoma | Female | <65 | I/II | Chemotherapy | adriamycin | SD |
| ADPGK | SNV | Missense_Mutation | c.889N>C | p.Glu297Gln | p.E297Q | Q9BRR6 | protein_coding | tolerated(0.06) | probably_damaging(0.97) | TCGA-B6-A0RE-01 | Breast | breast invasive carcinoma | Female | <65 | I/II | Unknown | Unknown | SD | |
| ADPGK | SNV | Missense_Mutation | rs778341188 | c.710A>G | p.Asn237Ser | p.N237S | Q9BRR6 | protein_coding | tolerated(0.13) | possibly_damaging(0.898) | TCGA-BH-A0HQ-01 | Breast | breast invasive carcinoma | Female | <65 | I/II | Hormone Therapy | arimidex | SD |
| ADPGK | SNV | Missense_Mutation | c.1010N>A | p.Gly337Glu | p.G337E | Q9BRR6 | protein_coding | deleterious(0) | probably_damaging(0.999) | TCGA-AA-3492-01 | Colorectum | colon adenocarcinoma | Female | >=65 | I/II | Unknown | Unknown | SD | |
| ADPGK | SNV | Missense_Mutation | c.1268N>T | p.Arg423Leu | p.R423L | Q9BRR6 | protein_coding | tolerated(0.23) | benign(0.031) | TCGA-AA-3662-01 | Colorectum | colon adenocarcinoma | Female | >=65 | III/IV | Chemotherapy | capecitabine | PR | |
| ADPGK | SNV | Missense_Mutation | novel | c.965N>A | p.Gly322Glu | p.G322E | Q9BRR6 | protein_coding | deleterious(0) | probably_damaging(0.999) | TCGA-AA-3872-01 | Colorectum | colon adenocarcinoma | Male | <65 | III/IV | Unknown | Unknown | SD |
| ADPGK | SNV | Missense_Mutation | c.400N>G | p.Ser134Gly | p.S134G | Q9BRR6 | protein_coding | deleterious(0.01) | possibly_damaging(0.74) | TCGA-AA-A02R-01 | Colorectum | colon adenocarcinoma | Female | >=65 | I/II | Unknown | Unknown | PD | |
| ADPGK | SNV | Missense_Mutation | novel | c.1226N>G | p.Ala409Gly | p.A409G | Q9BRR6 | protein_coding | deleterious(0) | probably_damaging(0.998) | TCGA-AA-A02W-01 | Colorectum | colon adenocarcinoma | Female | >=65 | I/II | Unknown | Unknown | PD |
| ADPGK | SNV | Missense_Mutation | novel | c.1295N>G | p.Phe432Cys | p.F432C | Q9BRR6 | protein_coding | deleterious(0) | probably_damaging(0.991) | TCGA-CA-6717-01 | Colorectum | colon adenocarcinoma | Male | <65 | I/II | Chemotherapy | oxaliplatin | CR |
| ADPGK | SNV | Missense_Mutation | c.365N>C | p.Phe122Ser | p.F122S | Q9BRR6 | protein_coding | tolerated(0.11) | benign(0.112) | TCGA-CM-6171-01 | Colorectum | colon adenocarcinoma | Female | >=65 | I/II | Unknown | Unknown | SD |
| Page: 1 2 3 4 |
Top |
Related drugs of malignant transformation related genes |
| Identification of chemicals and drugs interact with genes involved in malignant transfromation |
| (DGIdb 4.0) |
| Entrez ID | Symbol | Category | Interaction Types | Drug Claim Name | Drug Name | PMIDs |
| Page: 1 |

Copyright 2023-Present -The University of Texas Health Science Center at Houston |