
|
|||||
|
 | |
| |
| |
| |
| |
| |
|
Gene: ADAMTS9 |
Gene summary for ADAMTS9 |
| Gene information | Species | Human | Gene symbol | ADAMTS9 | Gene ID | 56999 |
| Gene name | ADAM metallopeptidase with thrombospondin type 1 motif 9 | |
| Gene Alias | ADAMTS9 | |
| Cytomap | 3p14.1 | |
| Gene Type | protein-coding | GO ID | GO:0001525 | UniProtAcc | Q9P2N4 |
Top |
Malignant transformation analysis |
| Identification of the aberrant gene expression in precancerous and cancerous lesions by comparing the gene expression of stem-like cells in diseased tissues with normal stem cells |
| Entrez ID | Symbol | Replicates | Species | Organ | Tissue | Adj P-value | Log2FC | Malignancy |
| 56999 | ADAMTS9 | P2T-E | Human | Esophagus | ESCC | 1.76e-53 | 1.02e+00 | 0.1177 |
| 56999 | ADAMTS9 | P16T-E | Human | Esophagus | ESCC | 5.05e-19 | 4.43e-01 | 0.1153 |
| 56999 | ADAMTS9 | P56T-E | Human | Esophagus | ESCC | 2.00e-05 | 8.99e-01 | 0.1613 |
| 56999 | ADAMTS9 | P76T-E | Human | Esophagus | ESCC | 1.03e-05 | 1.87e-01 | 0.1207 |
| 56999 | ADAMTS9 | C21 | Human | Oral cavity | OSCC | 1.31e-07 | -6.00e-01 | 0.2678 |
| 56999 | ADAMTS9 | C43 | Human | Oral cavity | OSCC | 1.80e-11 | -6.00e-01 | 0.1704 |
| 56999 | ADAMTS9 | C46 | Human | Oral cavity | OSCC | 1.57e-13 | -6.00e-01 | 0.1673 |
| 56999 | ADAMTS9 | C57 | Human | Oral cavity | OSCC | 5.39e-09 | -6.00e-01 | 0.1679 |
| 56999 | ADAMTS9 | C08 | Human | Oral cavity | OSCC | 3.58e-12 | -5.83e-01 | 0.1919 |
| 56999 | ADAMTS9 | C09 | Human | Oral cavity | OSCC | 4.40e-02 | -3.68e-01 | 0.1431 |
| 56999 | ADAMTS9 | LN46 | Human | Oral cavity | OSCC | 1.36e-05 | -6.00e-01 | 0.1666 |
| 56999 | ADAMTS9 | EOLP-2 | Human | Oral cavity | EOLP | 9.21e-03 | -3.18e-01 | -0.0203 |
| 56999 | ADAMTS9 | NEOLP-3 | Human | Oral cavity | NEOLP | 2.06e-02 | 4.05e-01 | -0.0191 |
| 56999 | ADAMTS9 | SYSMH1 | Human | Oral cavity | OSCC | 3.41e-13 | -6.00e-01 | 0.1127 |
| 56999 | ADAMTS9 | SYSMH2 | Human | Oral cavity | OSCC | 2.36e-11 | -5.87e-01 | 0.2326 |
| 56999 | ADAMTS9 | SYSMH3 | Human | Oral cavity | OSCC | 3.09e-14 | -6.00e-01 | 0.2442 |
| 56999 | ADAMTS9 | SYSMH4 | Human | Oral cavity | OSCC | 3.08e-12 | -6.00e-01 | 0.1226 |
| 56999 | ADAMTS9 | SYSMH5 | Human | Oral cavity | OSCC | 6.15e-15 | -5.98e-01 | 0.0647 |
| 56999 | ADAMTS9 | SYSMH6 | Human | Oral cavity | OSCC | 3.44e-12 | -5.70e-01 | 0.1275 |
| 56999 | ADAMTS9 | 047563_1562-all-cells | Human | Prostate | BPH | 3.39e-27 | 6.74e-01 | 0.0791 |
| Page: 1 2 |
| Tissue | Expression Dynamics | Abbreviation |
| Esophagus |  | ESCC: Esophageal squamous cell carcinoma |
| HGIN: High-grade intraepithelial neoplasias | ||
| LGIN: Low-grade intraepithelial neoplasias | ||
| Oral Cavity | 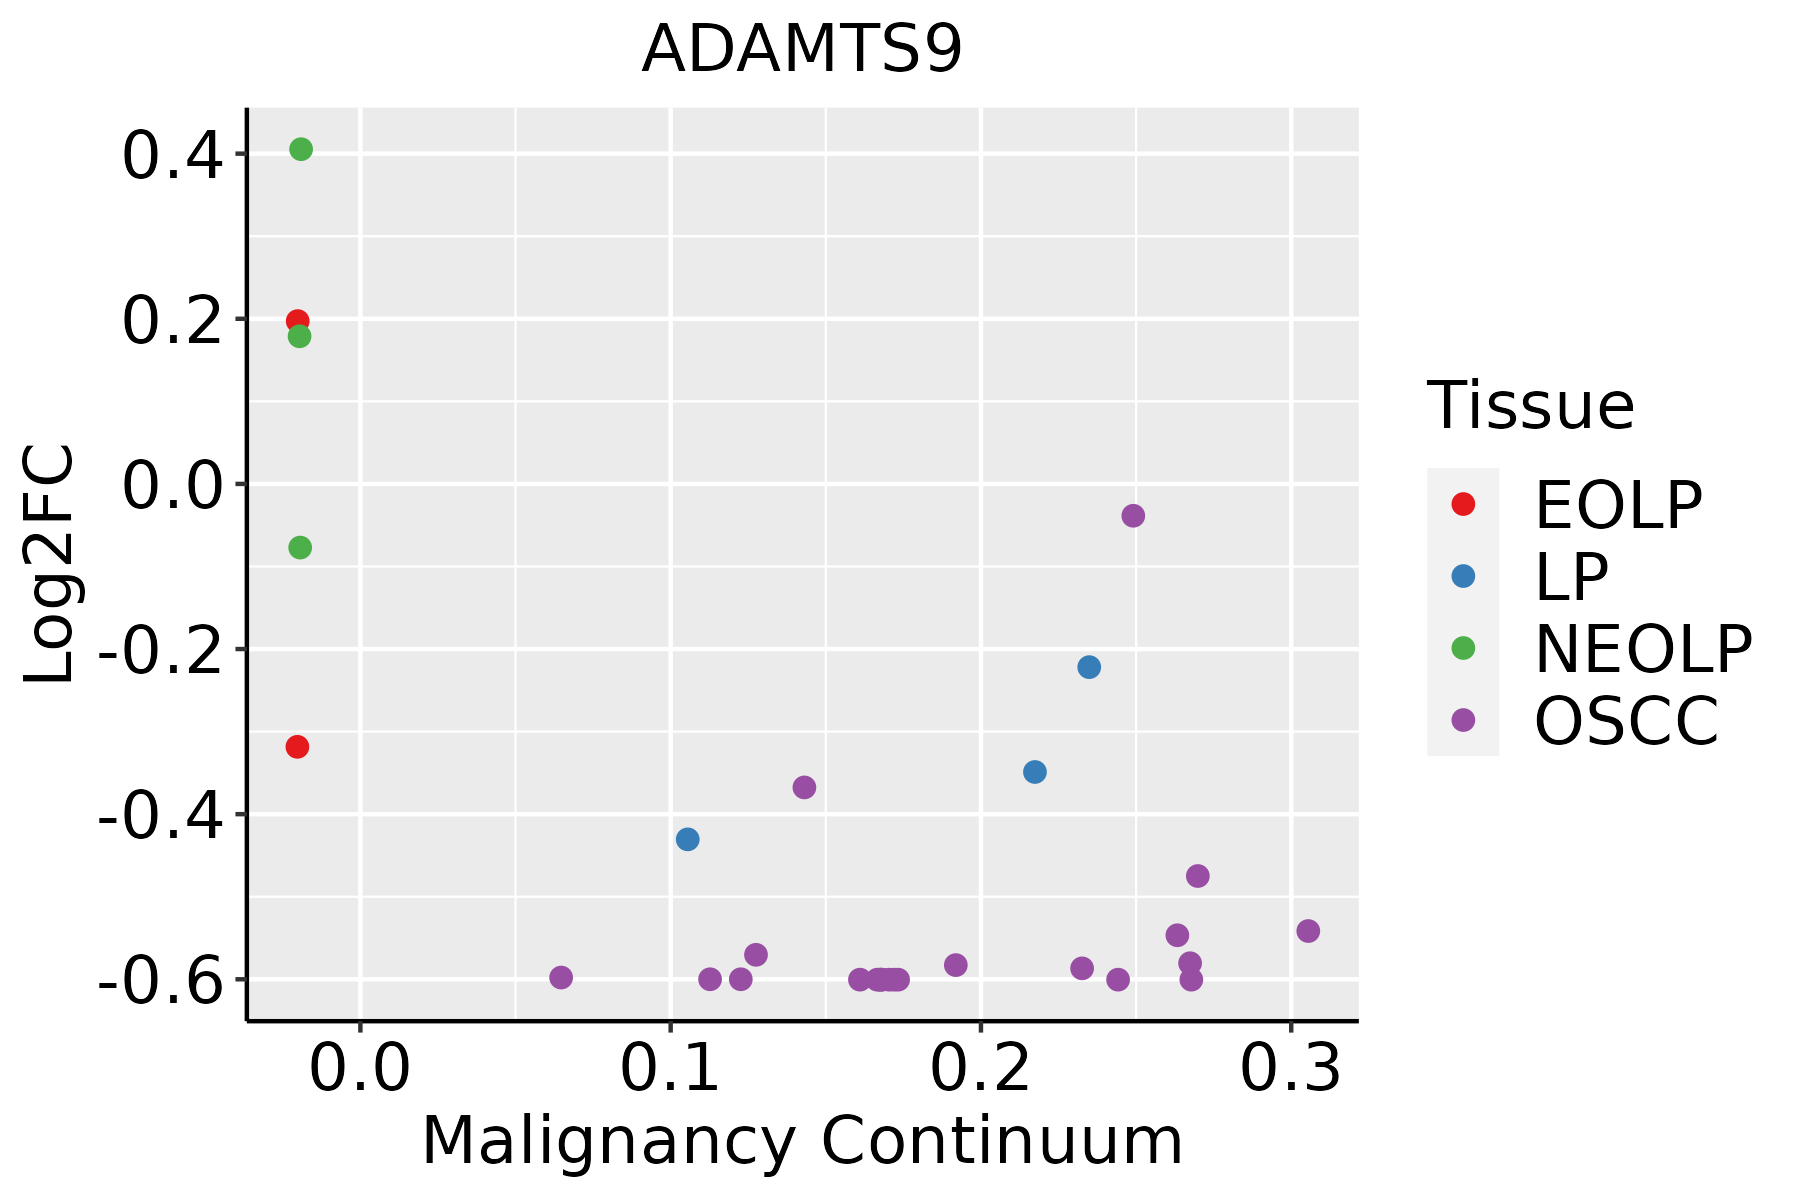 | EOLP: Erosive Oral lichen planus |
| LP: leukoplakia | ||
| NEOLP: Non-erosive oral lichen planus | ||
| OSCC: Oral squamous cell carcinoma | ||
| Prostate | 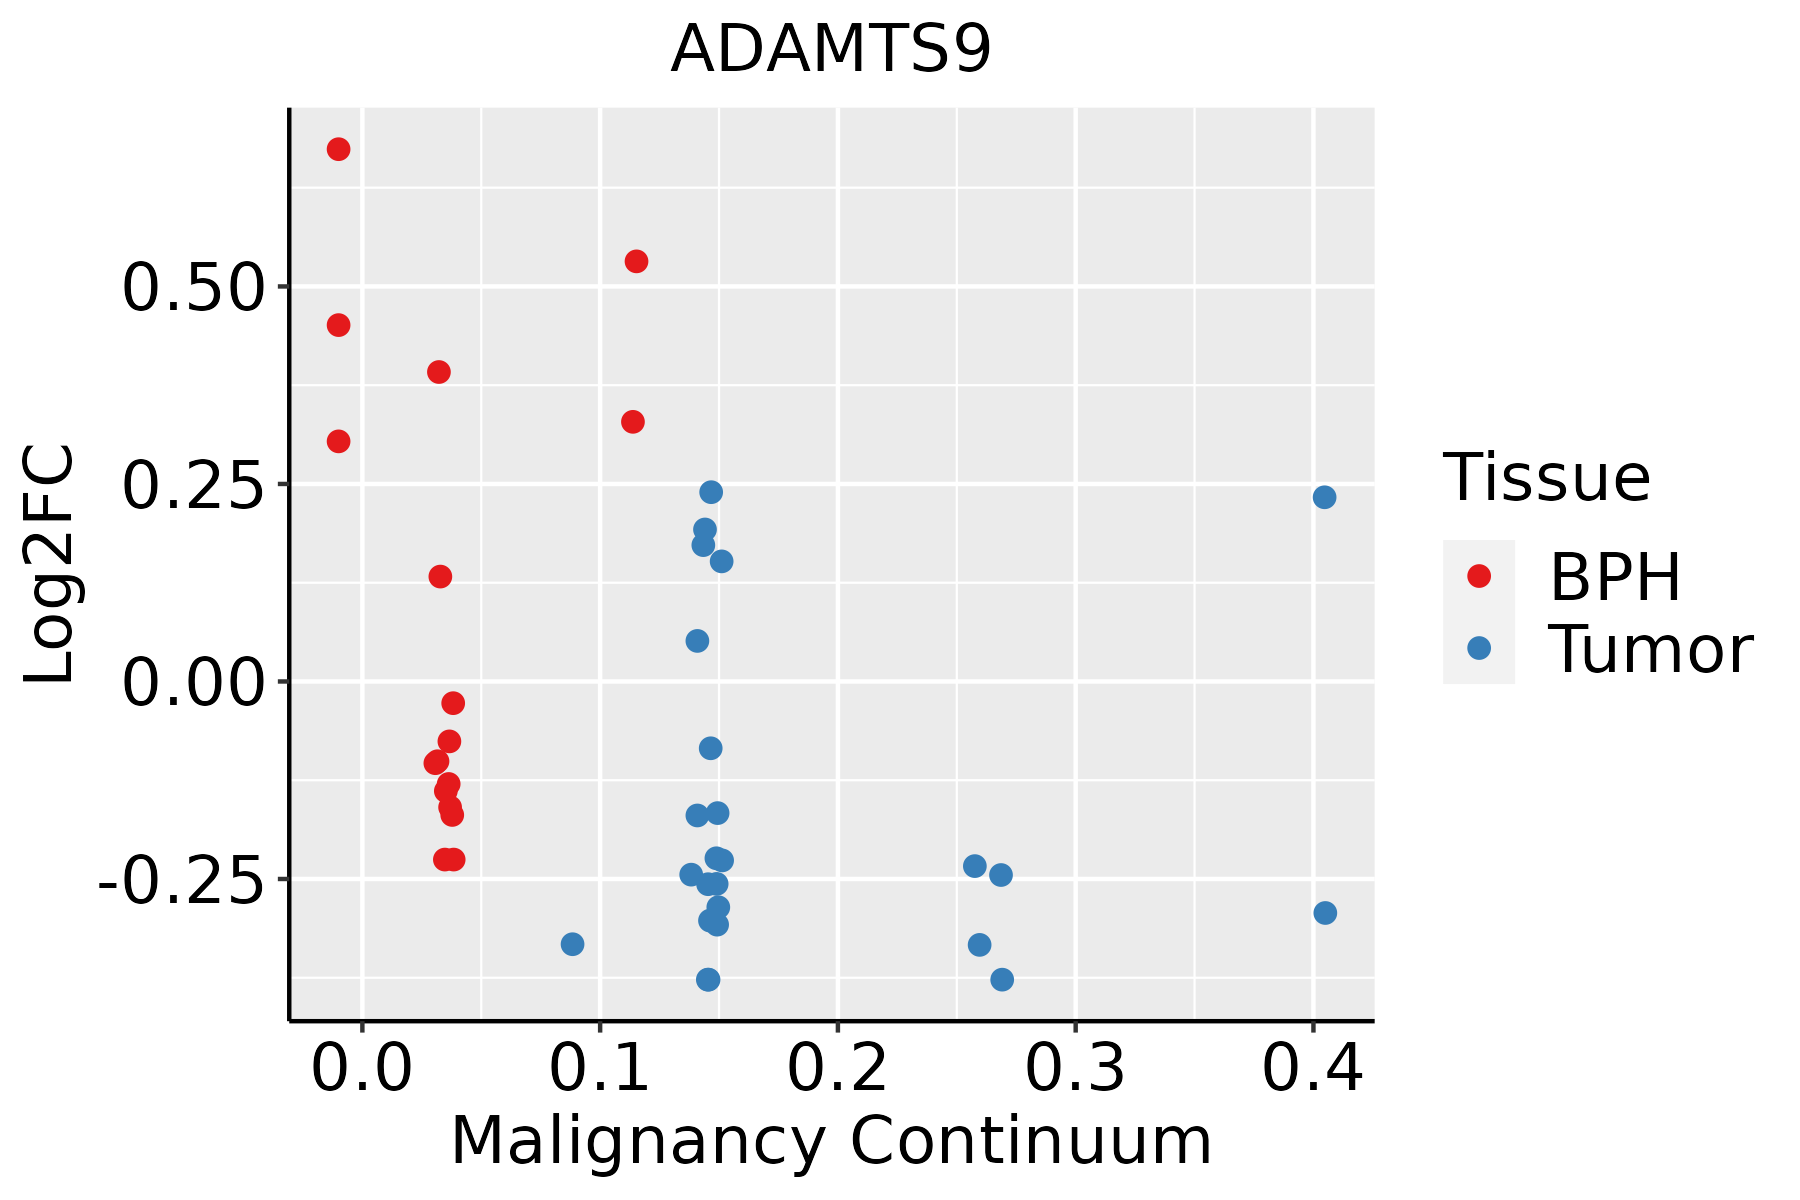 | BPH: Benign Prostatic Hyperplasia |
| Thyroid | 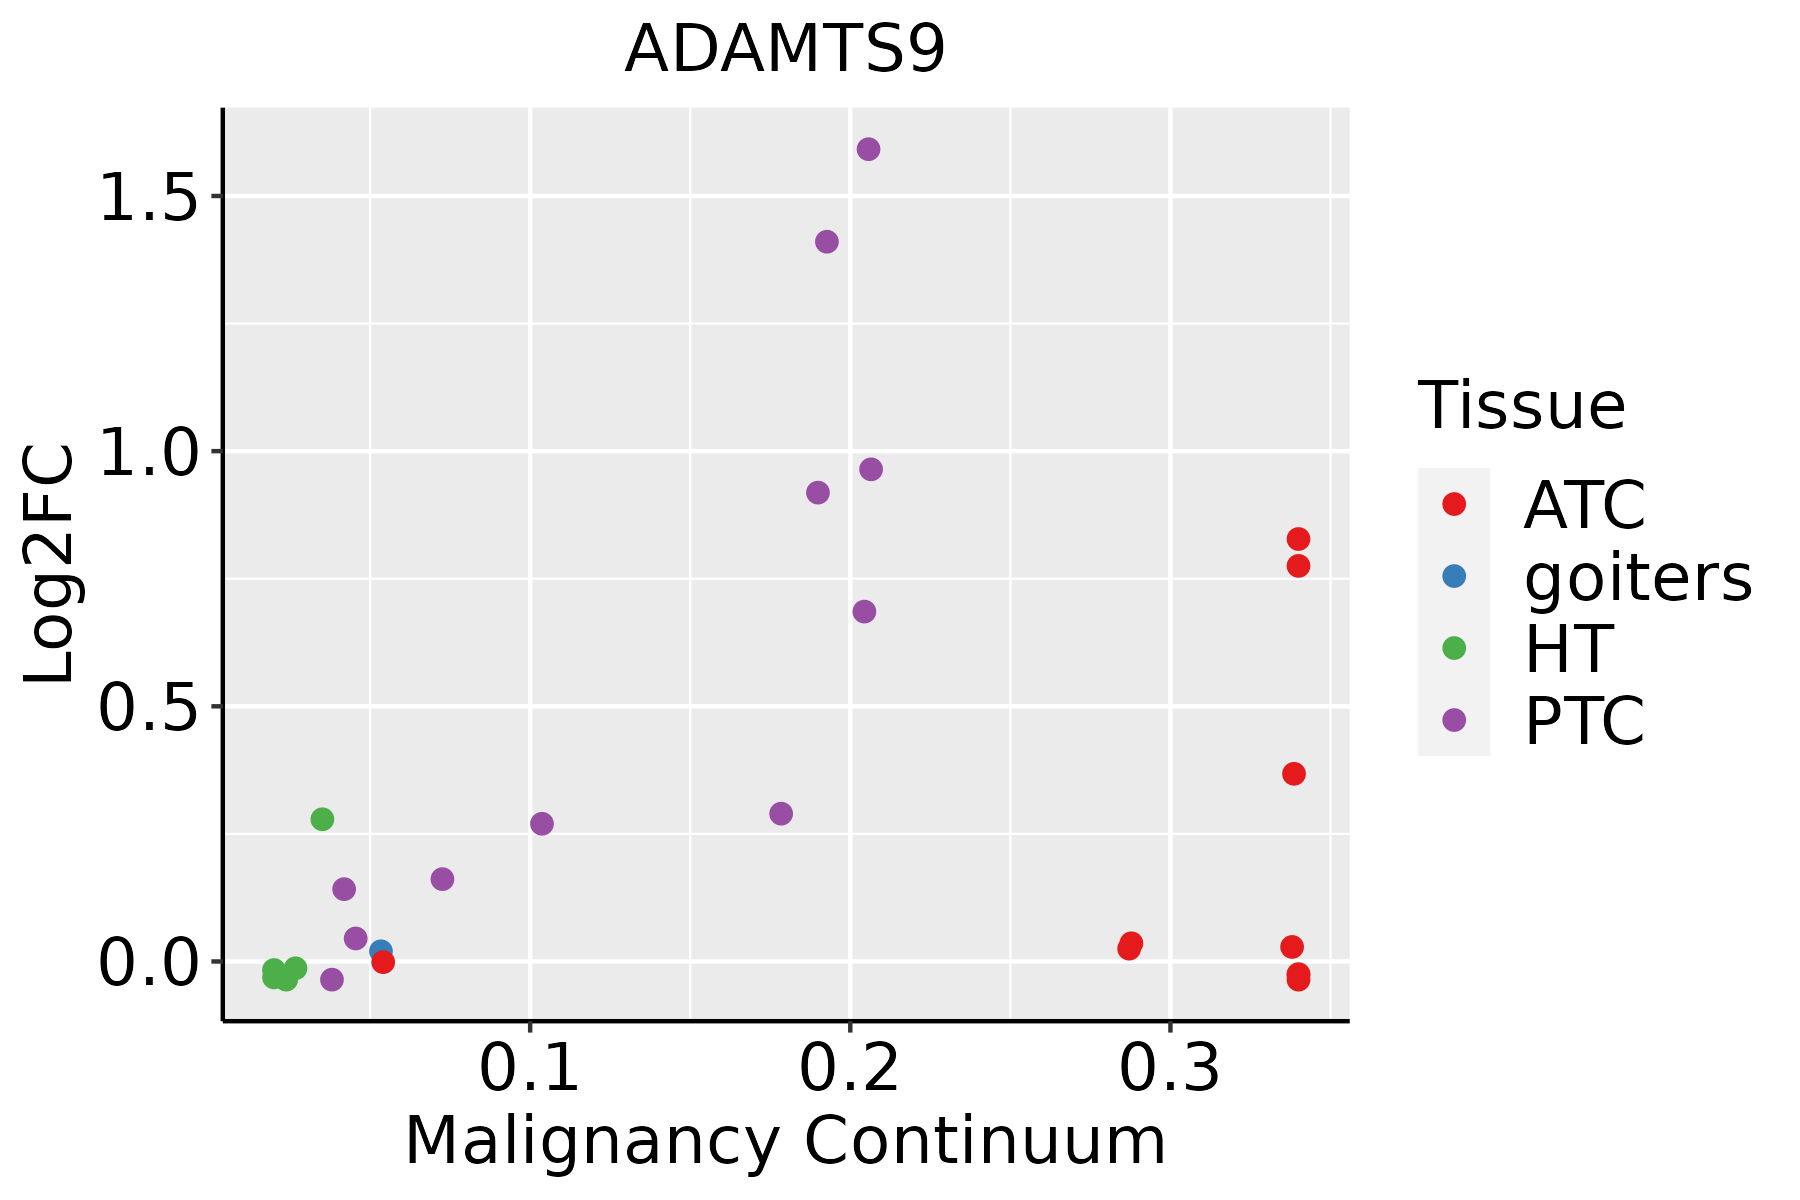 | ATC: Anaplastic thyroid cancer |
| HT: Hashimoto's thyroiditis | ||
| PTC: Papillary thyroid cancer |
| ∗log2FC in expression of this searched gene in stem-like cells from each diseased tissue sample relative to stem-like cells in normal samples in each tissue plotted against the malignancy continuum. Samples are colored based on if they are from different disease stage. |
Top |
Malignant transformation related pathway analysis |
| Find out the enriched GO biological processes and KEGG pathways involved in transition from healthy to precancer to cancer |
| Tissue | Disease Stage | Enriched GO biological Processes |
| Colorectum | AD |  |
| Colorectum | SER |  |
| Colorectum | MSS |  |
| Colorectum | MSI-H |  |
| Colorectum | FAP |  |
| ∗Top 15 enriched GO BP terms are showed in the bar plot of each disease state in each tissue. Each row represents a significant GO biological process which is colored according to the -log10(p.adjust). |
| Page: 1 2 3 4 5 6 7 8 9 |
| GO ID | Tissue | Disease Stage | Description | Gene Ratio | Bg Ratio | pvalue | p.adjust | Count |
| GO:003158916 | Prostate | Tumor | cell-substrate adhesion | 109/3246 | 363/18723 | 1.41e-09 | 6.71e-08 | 109 |
| GO:009013217 | Prostate | Tumor | epithelium migration | 105/3246 | 360/18723 | 1.57e-08 | 5.62e-07 | 105 |
| GO:009013017 | Prostate | Tumor | tissue migration | 106/3246 | 365/18723 | 1.73e-08 | 6.10e-07 | 106 |
| GO:001063117 | Prostate | Tumor | epithelial cell migration | 104/3246 | 357/18723 | 1.97e-08 | 6.91e-07 | 104 |
| GO:000166718 | Prostate | Tumor | ameboidal-type cell migration | 130/3246 | 475/18723 | 2.36e-08 | 8.09e-07 | 130 |
| GO:001063217 | Prostate | Tumor | regulation of epithelial cell migration | 85/3246 | 292/18723 | 3.91e-07 | 8.63e-06 | 85 |
| GO:000716015 | Prostate | Tumor | cell-matrix adhesion | 71/3246 | 233/18723 | 5.40e-07 | 1.16e-05 | 71 |
| GO:006053714 | Prostate | Tumor | muscle tissue development | 107/3246 | 403/18723 | 1.93e-06 | 3.34e-05 | 107 |
| GO:004354214 | Prostate | Tumor | endothelial cell migration | 76/3246 | 279/18723 | 2.19e-05 | 2.80e-04 | 76 |
| GO:001470613 | Prostate | Tumor | striated muscle tissue development | 98/3246 | 384/18723 | 2.96e-05 | 3.56e-04 | 98 |
| GO:005127114 | Prostate | Tumor | negative regulation of cellular component movement | 92/3246 | 367/18723 | 1.03e-04 | 9.99e-04 | 92 |
| GO:00031701 | Prostate | Tumor | heart valve development | 24/3246 | 65/18723 | 1.28e-04 | 1.19e-03 | 24 |
| GO:200014614 | Prostate | Tumor | negative regulation of cell motility | 89/3246 | 359/18723 | 1.99e-04 | 1.74e-03 | 89 |
| GO:001059413 | Prostate | Tumor | regulation of endothelial cell migration | 61/3246 | 232/18723 | 3.81e-04 | 2.96e-03 | 61 |
| GO:004001313 | Prostate | Tumor | negative regulation of locomotion | 94/3246 | 391/18723 | 4.20e-04 | 3.21e-03 | 94 |
| GO:003033613 | Prostate | Tumor | negative regulation of cell migration | 84/3246 | 344/18723 | 4.95e-04 | 3.66e-03 | 84 |
| GO:00031791 | Prostate | Tumor | heart valve morphogenesis | 20/3246 | 55/18723 | 5.74e-04 | 4.13e-03 | 20 |
| GO:00487382 | Prostate | Tumor | cardiac muscle tissue development | 57/3246 | 236/18723 | 4.67e-03 | 2.29e-02 | 57 |
| GO:190134212 | Prostate | Tumor | regulation of vasculature development | 79/3246 | 348/18723 | 5.84e-03 | 2.71e-02 | 79 |
| GO:004576512 | Prostate | Tumor | regulation of angiogenesis | 77/3246 | 342/18723 | 7.92e-03 | 3.52e-02 | 77 |
| Page: 1 2 3 4 5 6 7 8 9 |
| Pathway ID | Tissue | Disease Stage | Description | Gene Ratio | Bg Ratio | pvalue | p.adjust | qvalue | Count |
| Page: 1 |
Top |
Cell-cell communication analysis |
| Identification of potential cell-cell interactions between two cell types and their ligand-receptor pairs for different disease states |
| Ligand | Receptor | LRpair | Pathway | Tissue | Disease Stage |
| Page: 1 |
Top |
Single-cell gene regulatory network inference analysis |
| Find out the significant the regulons (TFs) and the target genes of each regulon across cell types for different disease states |
| TF | Cell Type | Tissue | Disease Stage | Target Gene | RSS | Regulon Activity |
| ∗The dot plots of a searched regulon are shown for all cell subpopulations in each disease state of each tissue based on the regulon specific score inferred using pySCENIC and by calculating the average expression. |
| Page: 1 |
Top |
Somatic mutation of malignant transformation related genes |
| Annotation of somatic variants for genes involved in malignant transformation |
| Hugo Symbol | Variant Class | Variant Classification | dbSNP RS | HGVSc | HGVSp | HGVSp Short | SWISSPROT | BIOTYPE | SIFT | PolyPhen | Tumor Sample Barcode | Tissue | Histology | Sex | Age | Stage | Therapy Types | Drugs | Outcome |
| ADAMTS9 | SNV | Missense_Mutation | c.1226N>A | p.Gly409Glu | p.G409E | Q9P2N4 | protein_coding | deleterious(0.01) | probably_damaging(1) | TCGA-A1-A0SI-01 | Breast | breast invasive carcinoma | Female | <65 | I/II | Unknown | Unknown | SD | |
| ADAMTS9 | SNV | Missense_Mutation | c.5698N>C | p.Ser1900Pro | p.S1900P | Q9P2N4 | protein_coding | tolerated(0.13) | possibly_damaging(0.718) | TCGA-A2-A1FW-01 | Breast | breast invasive carcinoma | Female | <65 | III/IV | Chemotherapy | cytoxan | SD | |
| ADAMTS9 | SNV | Missense_Mutation | novel | c.2728N>G | p.Gln910Glu | p.Q910E | Q9P2N4 | protein_coding | tolerated(0.07) | benign(0.096) | TCGA-A8-A07R-01 | Breast | breast invasive carcinoma | Female | >=65 | III/IV | Ancillary | zoledronic | SD |
| ADAMTS9 | SNV | Missense_Mutation | c.3422N>T | p.Ser1141Leu | p.S1141L | Q9P2N4 | protein_coding | tolerated(0.1) | benign(0.044) | TCGA-AC-A23H-01 | Breast | breast invasive carcinoma | Female | >=65 | I/II | Unknown | Unknown | PD | |
| ADAMTS9 | SNV | Missense_Mutation | rs775861579 | c.4717N>A | p.Glu1573Lys | p.E1573K | Q9P2N4 | protein_coding | tolerated(0.94) | benign(0.044) | TCGA-AC-A5XU-01 | Breast | breast invasive carcinoma | Female | >=65 | I/II | Hormone Therapy | letrozole | SD |
| ADAMTS9 | SNV | Missense_Mutation | rs749861523 | c.4837N>A | p.Glu1613Lys | p.E1613K | Q9P2N4 | protein_coding | tolerated(0.87) | benign(0.007) | TCGA-AC-A8OP-01 | Breast | breast invasive carcinoma | Female | >=65 | I/II | Unknown | Unknown | SD |
| ADAMTS9 | SNV | Missense_Mutation | novel | c.5272A>G | p.Ile1758Val | p.I1758V | Q9P2N4 | protein_coding | tolerated(1) | benign(0.009) | TCGA-AO-A1KT-01 | Breast | breast invasive carcinoma | Female | >=65 | I/II | Chemotherapy | fluorouracil | SD |
| ADAMTS9 | SNV | Missense_Mutation | c.4658G>A | p.Arg1553Gln | p.R1553Q | Q9P2N4 | protein_coding | tolerated(0.29) | benign(0) | TCGA-B6-A408-01 | Breast | breast invasive carcinoma | Female | <65 | III/IV | Chemotherapy | cyclophosphamide | SD | |
| ADAMTS9 | SNV | Missense_Mutation | c.4495C>T | p.Pro1499Ser | p.P1499S | Q9P2N4 | protein_coding | deleterious(0.01) | probably_damaging(0.98) | TCGA-BH-A0BM-01 | Breast | breast invasive carcinoma | Female | <65 | I/II | Chemotherapy | adriamycin | SD | |
| ADAMTS9 | SNV | Missense_Mutation | c.2533N>T | p.Ile845Phe | p.I845F | Q9P2N4 | protein_coding | deleterious(0.01) | probably_damaging(0.914) | TCGA-D8-A1J8-01 | Breast | breast invasive carcinoma | Female | >=65 | I/II | Hormone Therapy | nolvadex | SD |
| Page: 1 2 3 4 5 6 7 8 9 10 11 12 13 14 15 16 17 18 19 20 21 |
Top |
Related drugs of malignant transformation related genes |
| Identification of chemicals and drugs interact with genes involved in malignant transfromation |
| (DGIdb 4.0) |
| Entrez ID | Symbol | Category | Interaction Types | Drug Claim Name | Drug Name | PMIDs |
| Page: 1 |

Copyright 2023-Present -The University of Texas Health Science Center at Houston |